A vibrational spectroscopic study of the silicate mineral
pectolite – NaCa
2
Si
3
O
8
(OH)
Ray L. Frost
a,⇑, Andrés López
a, Frederick L. Theiss
a, Antônio Wilson Romano
b, Ricardo Scholz
caSchool of Chemistry, Physics and Mechanical Engineering, Science and Engineering Faculty, Queensland University of Technology, GPO Box 2434, Brisbane, Queensland 4001,
Australia
bGeology Department, Federal University of Minas Gerais, Belo Horizonte, MG 31,270-901, Brazil
cGeology Department, School of Mines, Federal University of Ouro Preto, Campus Morro do Cruzeiro, Ouro Preto, MG 35,400-00, Brazil
h i g h l i g h t s
We have studied mineral pectolite NaCa2Si3O8(OH).
Potential to be used in plaster boards and other industrial applications. Raman bands are assigned to the SiO
stretching vibrations of linked units of Si3O8units.
Raman spectroscopy with
complimentary infrared spectroscopy enables the characterisation of the silicate mineral pectolite.
g r a p h i c a l
a b s t r a c t
a r t i c l e
i n f o
Article history:
Received 24 March 2014
Received in revised form 2 June 2014 Accepted 16 June 2014
Available online 24 June 2014
Keywords:
Silicate
Raman spectroscopy Pectolite
Infrared spectroscopy Molecular structure
a b s t r a c t
The mineral pectolite NaCa2Si3O8(OH) is a crystalline sodium calcium silicate which has the potential to
be used in plaster boards and in other industrial applications.
Raman bands at 974 and 1026 cm 1are assigned to the SiO stretching vibrations of linked units of Si 3O8
units. Raman bands at 974 and 998 cm 1serve to identify Si
3O8units. The broad Raman band at around
936 cm 1is attributed to hydroxyl deformation modes. Intense Raman band at 653 cm 1is assigned to
OSiO bending vibration. Intense Raman bands in the 2700–3000 cm 1spectral range are assigned to
OH stretching vibrations of the OH units in pectolite. Infrared spectra are in harmony with the Raman spectra. Raman spectroscopy with complimentary infrared spectroscopy enables the characterisation of the silicate mineral pectolite.
Ó2014 Elsevier B.V. All rights reserved.
Introduction
Pectolite is a white to gray mineral, of formula NaCa2Si3O8(OH)
and may be described as a sodium calcium inosilicate hydroxide and is the calcium analogue of serandite. It crystallizes in the triclinic system typically occurring in radiated or fibrous crystalline masses
and is primary mineral in nepheline syenites. A hydrothermal min-eral in cavities in basalts and diabases; in serpentinites and perido-tites; from metamorphosed high-calcium rocks. Pectolite is triclinic, space groupP1, with 15 nonhydrogen atoms in the asymmetric unit
[1]. A review of the structure of pectolite and related minerals has been published[2]. The structure of pectolite is related to that of wollastonite[3]. A number of Ca and Mn pyroxenes and pyroxenoids are known and such minerals forms paragenesis in contact meta-morphic rocks, including pectolite, rhodonite, pyroxmangite,
http://dx.doi.org/10.1016/j.saa.2014.06.097
1386-1425/Ó2014 Elsevier B.V. All rights reserved.
⇑Corresponding author. Tel.: +61 7 3138 2407; fax: +61 7 3138 1804.
E-mail address:[email protected](R.L. Frost).
Contents lists available atScienceDirect
Spectrochimica Acta Part A: Molecular and
Biomolecular Spectroscopy
nambulite among others. The development and application of spec-troscopy technics can be an important tool in the non-destructive study of minerals mineral deposits.
No Raman spectroscopic analyses of pectolite and related min-erals have been forthcoming. There are spectra in the RRUFF data base but no band assignments are given. Some infrared studies have been undertaken[4]. Studies of hydrogen bonding in silicates relates the position of the hydroxyl stretching vibration to the
hydrogen bond distances [5]. Raman studies of cement phases
have been forthcoming[6–9]. In this way, identification of mineral phases using Raman spectroscopy has been made. Some infrared studies of calcium silicates have been undertaken, the purpose of which is for mineral identification and mineral content[10–12]. Some Raman spectra of calcium silicates have been collected and a number of the spectra were shown to be dependent upon the number of condensed silica tetrahedra[8]. Such detailed assign-ment of infrared and Raman bands for a wide range of silicate
structures was made by Dowty[13–16]. The thermal
decomposi-tion of calcium silicates has also been measured[17–19]. Pectolite is readily synthesised and is often found as components in cements
[20,21]. Pectolite may be used to make reinforced organic poly-mers. It can be used for the removal of organic polyelectrolytes and their metal complexes by adsorption onto pectolite. Pectolite and related minerals can be used for heavy metal uptake for exam-ple Nd(II)[20]. Because of the number and wide variation of the applications of the mineral pectolite, it is important to be readily able to identify the mineral pectolite using vibrational spectro-scopic techniques.
There is an apparent lack of information on the vibrational spec-tra of pectolite, even though some specspec-tra are provided in the RRUFF data base. The reason for such a lack of information is not known; yet the mineral contains OH units and siloxane units; Raman spectroscopy has proven most useful for the study of min-eral structure. The objective of this research is to report the Raman and infrared spectra of pectolite and to relate the spectra to the mineral structure.
Experimental
Samples description and preparation
The pectolite sample studied in this work occurs as single crys-tals with fibrous to acicular habitus up to 3 cm (please seeFig. 1). The mineral forms radial aggregates. The sample is part of the col-lection of the Geology Department of the Federal University of Ouro Preto, Minas Gerais, Brazil, with sample code SAC-100. The
sample was gently crushed and single crystals were selected under a stereomicroscope Leica MZ4. The pectolite sample studied in this work was analyzed by scanning electron microscopy (SEM) in the EDS mode to support the mineral characterization.
Scanning electron microscopy (SEM)
Experiments and analyses involving electron microscopy were performed in the Center of Microscopy of the Universidade Federal de Minas Gerais, Belo Horizonte, Minas Gerais, Brazil (http://www. microscopia.ufmg.br). Pectolite crystals were coated with a 5 nm layer of evaporated carbon. Secondary Electron and Backscattering Electron images were obtained using a JEOL JSM-6360LV equipment. Qualitative and semi-quantitative chemical analyses in the EDS mode were performed with a ThermoNORAN spectrometer model Quest and was applied to support the mineral characterization.
Raman microprobe spectroscopy
Crystals of pectolite were placed on a polished metal surface on the stage of an Olympus BHSM microscope, which is equipped with 10, 20, and 50objectives. The microscope is part of a Renishaw
1000 Raman microscope system, which also includes a monochro-mator, a filter system and a CCD detector (1024 pixels). The Raman spectra were excited by a Spectra-Physics model 127 He–Ne laser producing highly polarized light at 633 nm and collected at a nom-inal resolution of 2 cm 1and a precision of ±1 cm 1in the range
between 200 and 4000 cm 1. Repeated acquisitions on the crystals
using the highest magnification (50) were accumulated to
improve the signal to noise ratio of the spectra. Raman Spectra were calibrated using the 520.5 cm 1line of a silicon wafer.
It is noted that there are four spectra of pectolite provided in the RRUFF data base. However, no attribution of the bands is given. One spectrum has been downloaded for comparative purposes and is given in thesupplementary information.
Infrared spectroscopy
Infrared spectra of pectolite were obtained using a Nicolet Nexus 870 FTIR spectrometer with a smart endurance single
bounce diamond ATR cell. Spectra over the 4000–525 cm 1range
were obtained by the co-addition of 128 scans with a resolution of 4 cm 1and a mirror velocity of 0.6329 cm/s. Spectra were
co-added to improve the signal to noise ratio.
Spectral manipulation such as baseline correction/adjustment and smoothing were performed using the Spectracalc software package GRAMS (Galactic Industries Corporation, NH, USA). Band component analysis was undertaken using the Jandel ‘Peakfit’ soft-ware package that enabled the type of fitting function to be selected and allows specific parameters to be fixed or varied accordingly. Band fitting was done using a Lorentzian–Gaussian cross-product function with the minimum number of component bands used for the fitting process. The Gaussian–Lorentzian ratio was maintained at values greater than 0.7 and fitting was under-taken until reproducible results were obtained with squared corre-lations ofr2greater than 0.995.
Results and discussion
Mineral characterization
The SEM image of pectolite sample studied in this work is shown inFig. 1. The image shows a group of acicular crystals up to 1 mm. Qualitative chemical analysis shows a homogeneous phase, composed by Ca, Na and Si. No other contaminant elements
Fig. 1.Backscattered electron image (BSI) of a pectolite group of acicular crystals up to 1.0 mm in length.
were observed and the sample can be considered as a single phase (Fig. 2). Zonation was also not observed.
Vibrational spectroscopy
The Raman spectrum of pectolite over the 100–4000 cm 1
spec-tral range is shown inFig. 3a. This figure shows the position and relative intensity of the Raman bands. It is noted there are large parts of the spectrum where little or no intensity is observed. The Raman spectrum is therefore subdivided into sections based upon the types of vibration being studied. The infrared spectrum of pectolite over the 500–4000 cm 1 spectral range is displayed
inFig. 3b. This figure shows the position and relative intensities of the infrared bands. The infrared spectrum is subdivided into sec-tions based upon the type of vibration being studied.
The Raman spectrum of pectolite over the 800–1200 cm 1
spec-tral range is reported inFig. 4a. The structure of pectolite NaCa2Si3O8
(OH) consists of a single chain with linked silica tetrahedra[22]. Dow-ty calculated the band positions for the different ideal silicate units
and showed that the –SiO3 units had a unique band position of
1025 cm 1[16](seeFigs. 2 and 4of this reference). Pectolite has
chains of linked units of Si3O8. Dowty calculated the Raman spectrum
for these type of silicate networks and predicted two bands at around 1040 and 1070 cm 1with an additional band at around 600 cm 1. In Fig. 3a, we observe two bands at 1026 and 1047 cm 1in harmony
with Dowty’s predictions. Two other Raman bands are observed at 974 and 998 cm 1. These Raman bands identify Si
3O8units. A
signif-icantly broader band is observed at 911 cm 1. This band is not
associ-ated with siloxane units but is attributed to hydroxyl deformation modes.
The 1042 cm 1 Raman band is not observed in the infrared
spectrum (Fig. 4b). This indicates that the vibration contains a cen-tre of symmetry. Infrared bands are observed at 1028 and 1065 cm 1. This latter band is not observed in the Raman
spec-trum. Strong infrared bands are observed at 901, 925, 966 and 991 cm 1. Dowty calculated the position of infrared bands for
sili-cate structures and also showed measured spectra of the equiva-lent theoretical system. The infrared bands shown in Dowty’s work were broad. In this work the infrared bands of pectolite are reasonably sharp and readily resolved. Black et al.[23] reported the Raman spectra of a series of hydrated calcium silicate com-pounds with varying Ca/Si ratios. There is some resemblance between the spectra of this reference (seeFig. 3of this reference) and these spectra. However, it must be pointed out that the com-pounds synthesised by Black et al. were hydrated calcium silicates. In comparison, pectolite is a hydroxy sodium calcium silicate. Rich-ardson et al.[9] published a review of cement phases and their
characterisation of calcium silicate phases by a number of techniques including Raman spectroscopy.
Fig. 2.EDS analysis of pectolite.
Fig. 3.(a) Raman spectrum of pectolite (upper spectrum) over the 100–4000 cm 1
spectral range and (b) infrared spectrum of pectolite (lower spectrum) over the 500–4000 cm 1spectral range.
Fig. 4.(a) Raman spectrum of pectolite over the 800–1200 cm1spectral range and
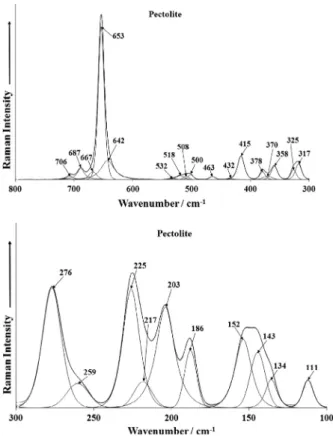
The Raman spectra of pectolite in the 300–800 cm 1region and
in the 100–300 cm 1region are displayed inFig. 5. A single intense
sharp Raman band is observed at 653 cm 1. The Raman band at
653 cm 1is assigned to the OSiO bending vibrations of the Si 3O8
units. The equivalent bands in the infrared spectrum are observed at 667, 674, 689 and 693 cm 1(Fig. 4b). These bands are assigned
to OSiO bending modes. Black et al.[23]reported the spectra of hydrated calcium silicates and reported a strong Raman band at 670 cm 1and attributed this band to a Si–O–Si symmetric bending
mode. The band is in a higher wavenumber position than for a sin-gle silicate chain[9]. This difference is related to the differences in the structures between pectolite and the hydrated calcium
sili-cates. The series of Raman band at 500, 508, 518 and 532 cm 1
are assigned to the OSiO out-of-plane bending vibrations of the Si3O8units. A series of low intensity Raman bands are observed
at 317, 325, 358, 370, 378, 415 and 463 cm 1. These bands are
con-sidered to be associated with Ca–O bonds. Two Raman bands are
observed at 505 and 524 cm 1. Bands in these positions are
assigned to the OSiO bending modes of SiO2 units [16]. Some
intense Raman bands are observed in the far low wavenumber region. Strong Raman bands are observed at 111, 143, 152, 186,
203, 225 and 276 cm 1with bands of lower intensity at 134 and
259 cm 1. These bands are simply described as lattice vibrations.
It is suggested that these bands are related to the OH units and the hydrogen bonding to the silicate units.
The Raman spectrum of pectolite in the 2600 and 3100 cm 1is
reported inFig. 6. No intensity was found in this spectral region in the infrared spectrum. Intense bands are observed in the Raman spectrum. Intense Raman bands are observed at 2809, 2851, 2879 and 2896 cm 1. These bands are assigned to the OH
stretch-ing bands of the OH units in pectolite. The range of peak positions provides evidence for a range of hydrogen bond strengths in the structure of pectolite. Both Raman and infrared bands at around
2900 cm 1are attributed to strong hydrogen bonding. The
hydro-gen bond distance is very short. The infrared band at 3529 cm 1is
attributed to water stretching vibration with intermediate hydro-gen bond strength. Such a range of hydrohydro-gen bond strengths is also reflected in the water bending modes (Fig. 7) where the band at 1615 cm 1. This latter band is attributed to the water bending
modes of water involved in hydrogen bonding.
Conclusions
Pectolite as a building material has many and varied applica-tions which are based upon the inherent properties of pectolite including porosity, thermal insulation and thermal decomposition temperature[24]. In order to raise the on-set combustion temper-ature of plaster boards, new types of plaster boards are made by combining gypsum with pectolite or some other suitable silicate mineral[24]. As part of this research, we have undertaken a vibra-tional spectroscopic study of pectolite to determine the character-istic bands of this mineral. In this way the ready identification of the mineral can be made.
The Raman spectrum of pectolite is characterised by intense
sharp bands at 974, 998, 1026 and 1047 cm 1. These bands are
assigned to the SiO stretching vibrations of the Si3O8units. Intense
Raman bands at 642, 653, 667, 687 and 706 cm 1are assigned to
OSiO bending vibrations. The intense Raman band profile centred upon 2880 cm 1 is attributed to the OH stretching vibrations of
the OH units in the pectolite structure. The mineral pectolite is well and truly characterised by its Raman spectrum. Further, Raman spectroscopy offers a technique for the study of pectolite and its admixtures including gypsum.
Fig. 5.Raman spectrum of pectolite (upper spectrum) in the 300–800 cm1spectral
range and (b) Raman spectrum of pectolite (lower spectrum) in the 100–300 cm1
spectral range.
Fig. 6.Raman spectrum of pectolite over the 2600–3100 cm1spectral range.
Fig. 7.Raman spectrum of pectolite over the 1300–1700 cm1spectral range.
Acknowledgements
The financial and infra-structure support of the Discipline of Nanotechnology and Molecular Science, Science and Engineering Faculty of the Queensland University of Technology, is gratefully acknowledged. The Australian Research Council (ARC) is thanked for funding the instrumentation. The authors would like to acknowledge the Center of Microscopy at the Universidade Federal de Minas Gerais (http://www.microscopia.ufmg.br) for providing the equipment and technical support for experiments involving electron microscopy.
Appendix A. Supplementary material
Supplementary data associated with this article can be found, in the online version, athttp://dx.doi.org/10.1016/j.saa.2014.06.097.
References
[1]M.J. Buerger, Zeit. Kristall. 108 (1956) 248–262. [2]N.V. Belov, Min. Sbornik (Lvov) (1960) 3–33.
[3]C.T. Prewitt, M.J. Buerger, Min. Soc. Am. Special Pap. (1) (1963) 293–302. [4]A. Beran, E. Libowitzky, Math. Phys. Sci. 543 (1999) 493–508.
[5]E. Libowitzky, Monat. Chem. 130 (1999) 1047–1059.
[6]L. Black, Spectrosc. Prop. Inorg. Organometallic Comp. 40 (2009) 72–127. [7]L. Black, C. Breen, J. Yarwood, J. Phipps, G. Maitland, Adv. Appl. Ceram. 105
(2006) 209–216.
[8]W. Pilz, Acta Phys. Hungarica 61 (1987) 27–30.
[9]I.G. Richardson, J. Skibsted, L. Black, R.J. Kirkpatrick, Adv. Cem. Res. 22 (2010) 233–248.
[10]O. Henning, B. Gerstner, Wissenschaft. Zeit. Hoch. 19 (1972) 287–293. [11]G.M. Krylov, Y.M. Priev, Dok. Akad. Nauk (1959) 25–27.
[12]G.M. Krylov, G.F. Sirotenko, Dok. Akad. Nauk (1961) 41–44.
[13]L. Ancillotti, E.M. Castellucci, M. Becucci, Inter. Soc. Opt. Eng. 5850 (2005) 182– 189.
[14]E. Dowty, Phys. Chem. Min. 14 (1987) 542–552. [15]E. Dowty, Phys. Chem. Min. 14 (1987) 122–138. [16]E. Dowty, Phys. Chem. Min. 14 (1987) 80–93.
[17]Y. Okada, H. Shibasaki, T. Masuda, Onoda Kenkyu Hok. 45 (1994) 126–141. [18]A. Winkler, W. Wieker, Zeit. Chem. 18 (1978) 375–376.
[19]A.E. Zadov, N.V. Chukanov, N.I. Organova, O.V. Kuz’mina, D.I. Belokovskii, M.A. Litsarev, V.G. Nechai, F.S. Sokolovskii, Zap. Vser. Min. Ob. 130 (2001) 26–40. [20]S. Komarneni, D.M. Roy, A. Kumar, Mater. Res. Soc. Symp. Proc. 44 (1985) 927–
934.
[21]H. Noma, Y. Adachi, H. Yamada, Y. Matsuda, T. Yokoyama, Inter. Ceram. Monogr. 2 (1996) 2450–2458.
[22]E. Thilo, H. Funk, Zeit. Anorg. Chem. 262 (1950) 185–191.
[23]L. Black, C. Breen, J. Yarwood, K. Garbev, P. Stemmermann, B. Gasharova, J. Am. Ceram. Soc. 90 (2007) 908–917.