A vibrational spectroscopic study of the silicate mineral ardennite-(As)
Ray L. Frost
a,⇑, Andrés López
a, Yunfei Xi
a, Ricardo Scholz
b, Antonio Luciano Gandini
baSchool of Chemistry, Physics and Mechanical Engineering, Science and Engineering Faculty, Queensland University of Technology, GPO Box 2434, Brisbane, Queensland 4001, Australia bGeology Department, School of Mines, Federal University of Ouro Preto, Campus Morro do Cruzeiro, Ouro Preto, MG 35,400-00, Brazil
h i g h l i g h t s
We have studied the mineral
ardennite-(As).
Qualitative chemical analysis shows a
homogeneous phase, composed by Si, Mn, Al and As.
Raman bands at 3041, 3149, 3211 and
3298 cm1are attributed to the stretching vibrations of water.
Bands attributable to OH units were
found.
Water adsorbed on the surfaces of
mineral ardennite-(As) was identified.
g r a p h i c a l
a b s t r a c t
a r t i c l e
i n f o
Article history:
Received 13 August 2013
Received in revised form 10 September 2013 Accepted 29 September 2013
Available online 8 October 2013
Keywords: Silicate
Raman spectroscopy Ardennite-(As) Infrared spectroscopy Adsorbed water
a b s t r a c t
We have used a combination of scanning electron microscopy with EDX and vibrational spectroscopy to study the mineral ardennite-(As). The mineral ardennite-(As) of accepted formula Mn2þ
4 (Al,Mg)6(Si3O10) (SiO4)2(AsO4,VO4)(OH)6 is a silicate mineral which may contain arsenate and/or vanadates anions. Because of the oxyanions present, the mineral lends itself to analysis by Raman and infrared spectros-copy. Qualitative chemical analysis shows a homogeneous phase, composed by Si, Mn, Al and As. Ca and V were also observed in partial substitution for Mn and As. Raman bands at 1197, 1225, 1287 and 1394 cm1are assigned to SiO stretching vibrations. The strong Raman bands at 779 and 877 cm1are assigned to the AsO3
4 antisymmetric and symmetric stretching vibrations. The Raman band at 352 cm1is assigned to the
m2symmetric bending vibration. The series of Raman bands between 414 and 471 cm1are assigned to the
m4out of plane bending modes of the AsO34units. Intense Raman bands observed at 301 and 314 cm1are attributed to the MnO stretching and bending vibrations. Raman bands at 3041, 3149, 3211 and 3298 cm1are attributed to the stretching vibrations of OH units. There is vibrational spectroscopic evidence for the presence of water adsorbed on the ardennite-(As) surfaces.
Ó2013 Elsevier B.V. All rights reserved.
Introduction
The mineral ardennite-(As) of formula Mn2þ
4 (Al,Mg)6(Si3O10)
(SiO4)2(AsO4,VO4)(OH)6 is a silicate mineral which may contain
arsenate and/or vanadates anions[1]. This mineral originally was referred to as ardennite, which was named for the type locality in the Ardennes Mountains in Belgium; it has since been redefined
as ardennite-(As), as there is also a vanadate (VO4) analogue of the
mineral [1]. The two minerals form a continuous solid solution. Ardennite-(As) is a rare mineral that occurs in pegmatites, quartz veins, and highly oxidized manganese and aluminum rich sedi-ments[2–5].
The mineral is orthorhombic[6–8]of point group: 2/m2/m2/m
and space group: Pnmm: a= 8.7126(8), b= 18.5124(11),
c= 5.8108(8), andZ= 2. According to Donnay and Allman[9], the crystal structure of ardennite-(As) can be derived from that of epi-dote by Ito-type twinning; it leads to the Si3O10 groups, which
1386-1425/$ - see front matterÓ2013 Elsevier B.V. All rights reserved.
http://dx.doi.org/10.1016/j.saa.2013.09.148
⇑ Corresponding author. Tel.: +61 7 3138 2407; fax: +61 7 3138 1804. E-mail address:[email protected](R.L. Frost).
Contents lists available atScienceDirect
Spectrochimica Acta Part A: Molecular and
Biomolecular Spectroscopy
strengthen the bond chains alongc. As in epidote, chains of octahe-dra sharing edges extend alongb. These chains are connected by the SiO4and Si3O10groups. (As,V)O4tetrahedra do not share
cor-ners with SiO4tetrahedra[9].
There is an apparent lack of information on the vibrational spec-tra of ardennite-(As). The reason for such a lack of information is not known; yet the mineral contains OH units, siloxane units and arsenate and/or vanadates units. Such units lend themselves to vibrational spectroscopy. Raman spectroscopy has proven most useful for the study of mineral structures especially at the molec-ular level. The objective of this research is to report the Raman and infrared spectra of ardennite-(As) and to relate the spectra to the mineral structure.
Experimental
Samples description and preparation
The ardennite-(As) sample studied in this work occurs as single crystals with tabular habitus up to 1 cm in association with quartz. The sample is from the Salmchâteau, Vielsalm, Stavelot Massif, Luxembourg Province, Belgium, the type locality for the mineral
[1]. Ardennite-(As) occurs in association with quartz. The mineral shows yellow color and vitreous to sub-adamantine luster. An image of ardennite-(As) is provided in the Supplementary informa-tion 1.
The mineral has been analyzed by X-ray diffraction. The XRD pattern of our ardennite-(As) matches the standard exactly. The XRD pattern of our ardennite-(As) is given in the Supplementary information.
The sample is part of the collection of the Geology Department of the Federal University of Ouro Preto, Minas Gerais, Brazil, with sample code SAC-088. The sample was gently crushed and the associated minerals were removed under a stereomicroscope Leica MZ4. The ardennite-(As) sample studied in this work was analyzed by scanning electron microscopy (SEM) in the EDS mode to support the mineral characterization.
Scanning electron microscopy (SEM)
Experiments and analyzes involving electron microscopy were performed in the Center of Microscopy of the Universidade Federal de Minas Gerais, Belo Horizonte, Minas Gerais, Brazil (http://www. microscopia.ufmg.br). Ardennite-(As) crystals were coated with a 5 nm layer of evaporated carbon. Secondary Electron and Backscat-tering Electron images were obtained using a JEOL JSM-6360LV equipment. Qualitative and semi-quantitative chemical analyzes in the EDS mode were performed with a ThermoNORAN spectrom-eter model Quest and were applied to support the mineral characterization.
Raman microprobe spectroscopy
Crystals of ardennite-(As) were placed on a polished metal sur-face on the stage of an Olympus BHSM microscope, which is equipped with 10, 20, and 50objectives. The microscope is part of a Renishaw 1000 Raman microscope system, which also includes a monochromator, a filter system and a CCD detector (1024 pixels). The Raman spectra were excited by a Spectra-Physics model 127 He-Ne laser producing highly polarized light at 633 nm and collected at a nominal resolution of 2 cm1and a precision of
±1 cm1in the range between 200 and 4000 cm1. Repeated
acqui-sitions on the crystals using the highest magnification (50) were accumulated to improve the signal to noise ratio of the spectra. Raman Spectra were calibrated using the 520.5 cm1 line of a
silicon wafer. The Raman spectrum of at least 10 crystals was col-lected to ensure the consistency of the spectra.
A Raman spectrum of ardennite-As is given in the RRUFF data base at http://rruff.info/Ardennite-(As). No assignment of the bands was provided. This spectrum is included in the Supplemen-tary information 2. This RRUFF spectrum does not show bands above 1100 cm1; no water bands or OH stretching vibrations
are provided when at least the latter could be expected. In the RRUFF spectrum of ardennite-As, some very intense Raman bands are observed between 4000 cm1and 5000 cm1. These bands may
be caused by fluorescence.
Infrared spectroscopy
Infrared spectra were obtained using a Nicolet Nexus 870 FTIR spectrometer with a smart endurance single bounce diamond ATR cell. Spectra over the 4000–525 cm1 range were obtained
by the co-addition of 128 scans with a resolution of 4 cm1and a
mirror velocity of 0.6329 cm/s. Spectra were co-added to improve the signal to noise ratio.
Spectral manipulation such as baseline correction/adjustment and smoothing were performed using the Spectracalc software package GRAMS (Galactic Industries Corporation, NH, USA). Band component analysis was undertaken using the Jandel ‘Peakfit’ software package that enabled the type of fitting function to be selected and allows specific parameters to be fixed or varied accordingly. Band fitting was done using a Lorentzian-Gaussian cross-product function with the minimum number of component bands used for the fitting process. The Gaussian–Lorentzian ratio was maintained at values greater than 0.7 and fitting was undertaken until reproducible results were obtained with squared correlations ofr2greater than 0.995.
Results and discussion
Mineral characterization
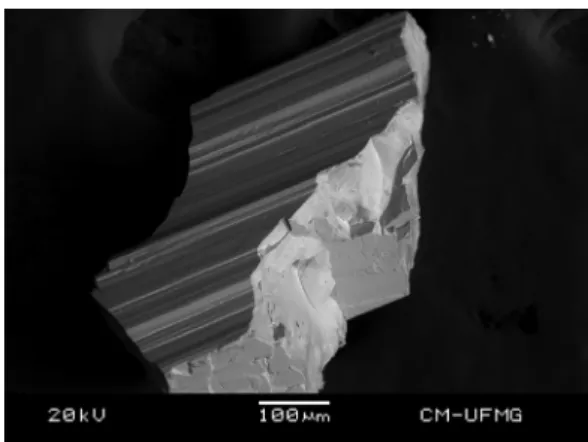
The SEM image of ardennite-(As) sample studied in this work is shown inFig. 1. The image shows a crystal fragment up to 1 mm. A perfect cleavage is observed on 010. Qualitative chemical analysis shows a homogeneous phase, composed by Si, Mn, Al and As. Ca and V were also observed in partial substitution of Mn and As, respectively. Semiquantitative chemical analysis shows an As/V ratio equal to 89/11. Zonation of the crystal was not observed and the sample can be considered as a single phase (Fig. 2).
Vibrational spectroscopy
The Raman spectrum of ardennite-(As) over the 3600–100 cm1
spectral range is reported inFig. 3a. This spectrum displays the band positions and relative intensities of these Raman bands. There are large parts of the spectrum where little or no intensity is observed. Therefore, the spectrum is divided into subsections depending upon the type of vibration being studied. It is noted that there is an apparent lack of intensity in the OH stretching region. The spectrum is dominated by Raman bands in the 1400–1100 cm1region. The infrared spectrum of ardennite-(As)
over the 4000–500 cm1 spectral range is illustrated in Fig. 3b.
The position of the infrared bands and their relative intensities are observed. There are parts of the spectrum where little or no intensity is observed. The infrared spectrum is subdivided into sections based upon the type of vibration being analyzed.
The formula of the mineral ardennite-(As) is Mn2þ 4 (Al,Mg)6
(Si3O10)(SiO4)2(AsO4,VO4)(OH)6and it is expected that there would
be Raman and infrared bands dominated by SiO4and Si3O10peaks.
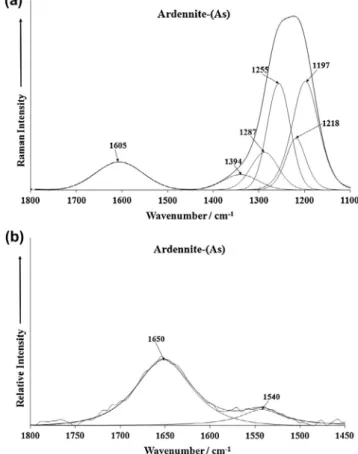
The Raman spectrum of ardennite-(As) over the 1100–1800 cm1
spectral range is shown inFig. 4a. This spectrum shows strong Ra-man bands between 1100 and 1400 cm1with band components
resolved at 1197, 1225, 1287 and 1394 cm1. These bands are as-signed to SiO antisymmetric stretching vibrations. Because of the complexity of bonded silicate polyhedra, it is difficult to assign the SiO bands.
The Raman band at 1605 cm1is due to a water bending mode.
Dowty showed that theSiO3units had a unique band position of
980 cm1 [10] (seeFigs. 2 and 4 of this reference). Dowty also
showed that Si2O5units had a Raman peak at around 1100 cm1.
The bands at around 1200 cm1are assigned to the SiO stretching
vibration of these Si2O5units. The infrared spectrum of
ardennite-(As) over the 1450–1800 cm1spectral range is shown inFig. 4b.
The infrared band at 1650 cm1is assigned to the water bending
mode of strongly hydrogen bonded water molecules. The observa-tion of bands at 1605 cm1 (Raman) and 1650 cm1 (infrared) gives credence to the adsorption of water on the ardennite-(As) surfaces.
The Raman spectrum of ardennite-(As) over the 1000–700 cm1
spectral range is reported in Fig. 5a. This spectrum shows well-resolved bands with Raman peaks observed at 713, 779, 877 and 935 cm1. The Raman spectrum of ardennite-As from the Fig. 2.EDS spectrum of ardennite-(As).
Fig. 3.(a) Raman spectrum of ardennite-(As) over the 4000–100 cm1spectral range and (b) infrared spectrum of ardennite-(As) over the 4000–500 cm1spectral range.
Fig. 4.(a) Raman spectrum of ardennite-(As) over the 1800–1100 cm1spectral range and (b) infrared spectrum of ardennite-(As) over the 1800–1450 cm1 spectral range.
RRUFF data base (provided in the Supplementary information) shows a very strong peak at 875 cm1and two other intense bands
at 713, 780 and 932 cm1. The values detailed here are in excellent
agreement with our data inFig. 5a. One possible interpretation of this Raman spectrum is to assign the band at 877 (875 RUFF) cm1 to the AsO3
4
m
1symmetric stretching mode and the bandat band at 779 (780 RRUFF) cm1to the AsO3
4
m
3antisymmetricstretching mode. The semi-quantitative analysis of the ardennite-As sample shows the ratio of ardennite-As to V is about 89/11. The Raman band at 935 (932 RRUFF) is due to the VO34
m
1symmetricstretch-ing mode. Some low intensity shoulders are also observed. These bands are thought to be related to the Si–O stretching and bending vibrations. Dowty calculated the band position of these bending modes for different siloxane units[10]. Dowty demonstrated the band position of the bending modes for SiO3 units at around
650 cm1. This calculated value is in harmony with the higher
wavenumber band observed at 625 cm1(628 cm1in the RRUFF
spectrum).
The infrared spectrum of ardennite-(As) over the 1150–650 cm1spectral range is reported inFig. 5b. The spectrum
shows great complexity with multiple overlapping bands. This complexity shows why the Raman spectroscopy is more advanta-geous to collect data on ardennite-(As) than infrared spectroscopy. Infrared bands are found at 1103 and 1126 cm1and are assigned
to the SiO antisymmetric stretching vibrations. The series of bands observed at 780, 817, 841, 877, 901, 917, 959, 977, 990 and 1016 cm1are related to the stretching and bending vibrations of the Si3O10and SiO4 units. Knowing which band is due to which
vibration is difficult to assess.
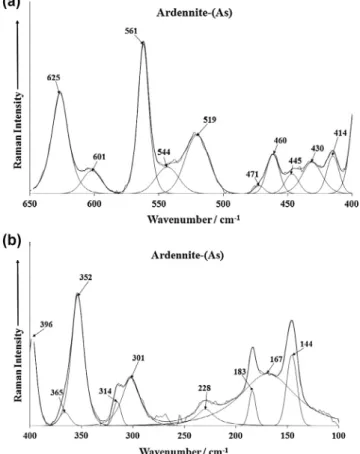
The Raman spectra of ardennite-(As) in the 650–400 cm1and
400–100 cm1spectral range are shown inFig. 6. There are three
sections in the first figure: (a) the bands at 601 and 625 cm1(b)
the bands at 519, 544 and 561 cm1 (c) the series of bands at
414, 430, 445, 460 and 471 cm1. In the RRUFF spectrum of
arden-nite-(As) Raman bands are observed at 350, 398, 462, 522, 557 and 628 cm1. The position of these peaks are in harmony with the
bands determined in this work as displayed inFig. 6a. The series of Raman bands between 414 and 471 cm1are assigned to the
m
4 out of plane bending modes of the AsO34 units. The band at
352 cm1(Fig. 6b) is assigned to the
m
2symmetric bendingvibra-tion. Griffith who reported bands at 324 and 310 cm1 for the
bending modes of olivenite.
Dowty calculated the band position of these bending modes for different silicate units[10]. Dowty demonstrated the band position of the bending modes for SiO3units at around 650 cm1. Thus, the
two bands at 601 and 623 cm1are assigned to this vibrational
mode. This calculated value is in harmony with the higher wave-number band observed at 625 cm1. According to Adams et al. [11]the band at 430 cm1is due to the coincidence of both the
B2g and Eg modes. Thus the series of bands between 414 and
471 cm1are due to this bending mode vibration. Intense bands
are observed at 301, 314, 352 and 396 cm1. These bands are due
to the MnO stretching and bending vibrations. The other bands inFig. 5b at 144, 183 and 228 cm1are simply described as lattice
bands.
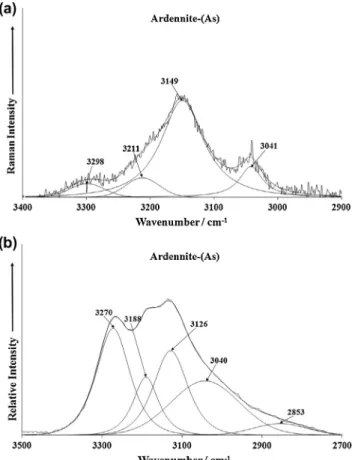
The Raman spectrum of ardennite-(As) over the 3400–2900 cm1spectral range is illustrated inFig. 7a. This figure
shows resolved bands at 3041, 3149, 3211 and 3298 cm1. The
po-sition of these bands is such that they are assigned to water stretching vibrations. The position of these bands suggests that water is strongly hydrogen bonded to the arsenate anions in the ardennite-(As) structure. The formula of the mineral Mn2þ4 (Al,Mg)6
(Si3O10)(SiO4)2(AsO4,VO4)(OH)6is such that no water is expected in Fig. 5.(a) Raman spectrum of ardennite-(As) over the 1400–800 cm1spectral
range and (b) infrared spectrum of ardennite-(As) over the 1300–800 cm1spectral range.
the formula. Thus, if the formula is not correct as it is written, then some water should be expected in the formula of ardennite-(As). Otherwise these bands are due to the OH units in the ardennite-(As) structure. The infrared spectrum of ardennite-ardennite-(As) in the 1800–1450 cm1region, shows a strong band at 1650 cm1which
is assigned to water bending modes (Fig. 4b). The presence of this band proves that water is adsorbed on the surfaces of ardennite-(As). The infrared spectrum of ardennite-(As) in the 3500–2700 cm1 spectral range is reported in Fig. 7b. Infrared
bands are found at 3126, 3188 and 3270 cm1. A broad tail is ob-served with resolved bands at 2853 and 3040 cm1. These bands
are ascribed to the stretching vibrations of the water units, proba-bly adsorbed on the hydroxyl surface of ardennite-As. These bands are assigned to the stretching vibrations of the OH units.
Both Raman and infrared bands in the OH stretching region, indicate the presence of water on the surface of ardennite-(As). However, the accepted formula has only OH units; thus bringing into question the formula of ardennite-(As). The formula of the mineral is given as Mn2þ4 (Al,Mg)6(Si3O10)(SiO4)2(AsO4,VO4)(OH)6.
However, the bands which could be assigned to OH stretching or deformation modes could be identified.
Conclusions
A study of the rare mineral ardennite-(As) was made using a combination of SEM with EDX and infrared and Raman spectros-copy. Qualitative chemical analysis shows a homogeneous phase, composed by Si, Mn, Al and As. Some minor substitution of V for As and Ca for Mn was observed. Raman bands were assigned to the stretching vibrations of the siloxane and arsenate units. Both Raman and infrared bands in the OH stretching region, indicate the presence of water in the structure of ardennite-(As). However, the accepted formula has only OH units; thus bringing into question the formula of ardennite-(As). The formula of the mineral is given as Mn2þ
4 (Al,Mg)6(Si3O10)(SiO4)2(AsO4,VO4)(OH)6. The
position of the OH stretching vibrations provides strong evidence for bonding of water to the hydroxyl surfaces of ardennite-(As). Vibrational spectroscopy offers new information on the molecular structure of ardennite-(As) which might not be readily obtained by other methods.
Acknowledgements
The financial and infra-structure support of the Discipline of Nanotechnology and Molecular Science, Science and Engineering Faculty of the Queensland University of Technology, is gratefully acknowledged. The Australian Research Council (ARC) is thanked for funding the instrumentation. The authors would like to acknowledge the Center of Microscopy at the Universidade Federal de Minas Gerais (http://www.microscopia.ufmg.br) for providing the equipment and technical support for experiments involving electron microscopy. R. Scholz thanks to CNPq – Conselho Nacional de Desenvolvimento Científico e Tecnológico (Grant No. 306287/ 2012-9).
Appendix A. Supplementary material
Supplementary data associated with this article can be found, in the online version, athttp://dx.doi.org/10.1016/j.saa.2013.09.148.
References
[1]A.A. Barresi, P. Orlandi, M. Pasero, Euro. J. Mineral. 19 (2007) 581–587. [2]C. Chopin, Bull. Min. 101 (1978) 514–531.
[3]D.S. Coombs, Y. Kawachi, A. Reay, Min. Petr. 48 (1993) 295–308. [4]T. Minakawa, H. Momoi, Kobut. Zasshi 18 (1987) 87–98. [5]N. Sasaki, M. Yano, F. Matsuyama, Chig. Kenkyu 51 (2002) 67–72. [6]P.B. Moore, Can. Min. 8 (1965) 262–265.
[7]P.B. Moore, J. Shen, T. Araki, Amer. Min. 70 (1985) 171–181.
[8]M. Pasero, T. Reinecke, A.M. Fransolet, Neues Jahrb. Min. Mh. 166 (1994) 137–167.
[9]G. Donnay, R. Allmann, Acta Cryst. B24 (1968) 845–855. [10] E. Dowty, Phys. Chem., Min. 14 (1987) 80–93.
[11]D.M. Adams, R.S. Armstrong, S.P. Best, Inorg. Chem. 20 (1981) 1771–1776.
Fig. 7.(a) Raman spectrum of ardennite-(As) over the 4000–2600 cm1spectral range and (b) infrared spectrum of ardennite-(As) over the 4000–2600 cm1 spectral range.