BGD
9, 387–409, 2012Seasonal variability of tropical wetland
CH4 emissions
A. A. Bloom et al.
Title Page
Abstract Introduction
Conclusions References
Tables Figures
◭ ◮
◭ ◮
Back Close
Full Screen / Esc
Printer-friendly Version
Interactive Discussion
Discussion
P
a
per
|
Dis
cussion
P
a
per
|
Discussion
P
a
per
|
Discussio
n
P
a
per
|
Biogeosciences Discuss., 9, 387–409, 2012 www.biogeosciences-discuss.net/9/387/2012/ doi:10.5194/bgd-9-387-2012
© Author(s) 2012. CC Attribution 3.0 License.
Biogeosciences Discussions
This discussion paper is/has been under review for the journal Biogeosciences (BG). Please refer to the corresponding final paper in BG if available.
Seasonal Variability of Tropical Wetland
CH
4
emissions: the role of the
methanogen-available carbon pool
A. A. Bloom, P. I. Palmer, A. Fraser, and D. S. Reay
School of GeoSciences, University of Edinburgh, Edinburgh, UK
Received: 21 November 2011 – Accepted: 12 December 2011 – Published: 12 January 2012
Correspondence to: A. A. Bloom ([email protected])
BGD
9, 387–409, 2012Seasonal variability of tropical wetland
CH4 emissions
A. A. Bloom et al.
Title Page
Abstract Introduction
Conclusions References
Tables Figures
◭ ◮
◭ ◮
Back Close
Full Screen / Esc
Printer-friendly Version
Interactive Discussion
Discussion
P
a
per
|
Dis
cussion
P
a
per
|
Discussion
P
a
per
|
Discussio
n
P
a
per
|
Abstract
We develop a dynamic methanogen-available carbon model (DMCM) to quantify the role of the methanogen-available carbon pool in determining the spatial and tempo-ral variability of tropical wetland CH4 emissions over seasonal timescales. We fit DMCM parameters to satellite observations of CH4 columns from SCIAMACHY CH4
5
and equivalent water height (EWH) from GRACE. Over the Amazon river basin we find substantial seasonal variability of this carbon pool (coefficient of variation=28±22 %)
and a rapid decay constant (φ=0.017 day−1), in agreement with available laboratory measurements, suggesting that plant litter is likely the prominent methanogen car-bon source over this region. Using the DMCM we derive global CH4 emissions for
10
2003–2009, and determine the resulting seasonal variability of atmospheric CH4on a global scale using the GEOS-Chem atmospheric chemistry and transport model. First, we estimate tropical emissions amount to 111.1 Tg CH4yr
−1
of which 24 % is emitted from Amazon wetlands. We estimate that annual tropical wetland emissions have in-creased by 3.4 Tg CH4yr
−1
between 2003 and 2009. Second, we find that the model
15
is able to reproduce the observed seasonal lag between CH4 concentrations peaking
1–3 months before peak EWH values. We also find that our estimates of CH4 emis-sions substantially improve the comparison between the model and observed CH4
sur-face concentrations (r=0.9). We anticipate that these new insights from the DMCM represent a fundamental step in parameterising tropical wetland CH4 emissions and
20
quantifying the seasonal variability and future trends of tropical CH4emissions.
1 Introduction
Wetlands are the single largest source of methane (CH4) into the atmosphere and account for 20–40 % of the global CH4source (Denman et al., 2007), of which tropical
wetlands account for 50–60 % of this global wetland CH4source (e.g. Cao et al., 1996;
25
BGD
9, 387–409, 2012Seasonal variability of tropical wetland
CH4 emissions
A. A. Bloom et al.
Title Page
Abstract Introduction
Conclusions References
Tables Figures
◭ ◮
◭ ◮
Back Close
Full Screen / Esc
Printer-friendly Version
Interactive Discussion
Discussion
P
a
per
|
Dis
cussion
P
a
per
|
Discussion
P
a
per
|
Discussio
n
P
a
per
|
to boreal peatlands (Mitsch et al., 2010), resulting in large inter-model discrepancies of the magnitude and distribution of tropical wetland CH4emission estimates (Riley et al., 2011). Tropical climate variability (e.g., resulting in widespread droughts, Lewis et al., 2011) can lead to large year to year variations in tropical wetland CH4emissions and
subsequently the global CH4 budget (Hodson et al., 2011). An improved quantitative
5
understanding of the magnitude, distribution, and variation of tropical wetland CH4
emissions is therefore essential to further understanding of the global CH4cycle. Here,
we parameterise tropical wetland CH4 emissions, and hence introduce a predictive capability that can be used to determine future emissions and to help quantify global CH4climate feedbacks.
10
In wetlands and rice paddies, methanogenesis (the biogenic production of CH4) oc-curs as the final step of anoxic organic matter decomposition (Neue et al., 1997). Fac-tors influencing methanogenesis rates include substrate availability, soil pH, tempera-ture, water table position and redox potential (Whalen, 2005). Wetland vegetation type and aquatic herbivore activity can also affect the transport of CH4between the soil and
15
atmosphere (Joabsson et al., 1999; Dingemans et al., 2011). On a global scale, sea-sonal variations in wetland CH4fluxes are mostly determined by temporal changes in wetland water volume and soil temperature (Walter et al., 2001; Gedney et al., 2004), and from seasonal changes in wetland extent and wetland water table depth (Ringeval et al., 2010; Bloom et al., 2010). Recent work that used SCIAMACHY lower
tropo-20
spheric CH4 column concentrations and Gravity Recovery And Climate Experiment
(GRACE) equivalent water height (EWH) retrievals shows that the seasonality of wet-land CH4emissions can be largely explained by seasonal changes in surface temper-ature and water volume (Bloom et al., 2010). The Amazon and Congo river basins were the only major exceptions in this study, where CH4 concentrations peaked
sev-25
eral weeks before EWH, highlighting our incomplete understanding of the processes controlling tropical wetland CH4emissions over seasonal timescales.
In this paper we focus on the seasonal lag between CH4emissions and flooding over
BGD
9, 387–409, 2012Seasonal variability of tropical wetland
CH4 emissions
A. A. Bloom et al.
Title Page
Abstract Introduction
Conclusions References
Tables Figures
◭ ◮
◭ ◮
Back Close
Full Screen / Esc
Printer-friendly Version
Interactive Discussion
Discussion
P
a
per
|
Dis
cussion
P
a
per
|
Discussion
P
a
per
|
Discussio
n
P
a
per
|
and GRACE EWH (both described in Sect. 2.2) to determine the seasonal lag between wetland CH4 emissions and wetland water volume. Figure 1 shows that seasonal
flooding of the Amazon basin occurs typically 1–3 months after the peak CH4
concen-trations, and to a lesser extent the lag persists throughout tropical wetland areas. In Sect. 2, we test the hypothesis that this lag is related to the depletion of
methanogen-5
available carbon during the onset of the tropical wet season by explicitly accounting for this carbon pool in a parameterised model of tropical wetland CH4 emissions (Bloom et al., 2010). We optimise model parameters by fitting them to SCIAMACHY CH4
col-umn and GRACE EWH measurements, and use the resulting model to estimate global wetland emission estimates. In Sect. 3 we compare our results to previous estimates of
10
wetland CH4emissions and to decomposition rates of methanogen-available carbon in anaerobic environments. Finally, we use our estimated emissions to drive the GEOS-Chem atmospheric chemistry model as an approach to test the consistency between our emission estimates and observed variations of atmospheric CH4 concentration. We conclude the paper in Sect. 4.
15
2 Process-based model and application
Here, we introduce a methanogen-available carbon pool (Cµ) that typically originates
from labile plant litter, recalcitrant organic matter decomposition and root exudates (e.g. Wania et al., 2010). Typically soil carbon pool decay constants are more than an order of magnitude lower than those of leaf litter (Sitch et al., 2003; Wania et al., 2010).
20
Therefore, ifCµoriginates mostly from the slow-decomposing recalcitrant carbon pool, then variations in Cµ over seasonal timescales are likely to be small. Conversely, if
Cµ is drawn from leaf litter, then large variations in Cµ abundance may arise as a
result of rapid litter decomposition in the tropics. Miyajima et al. (1997) measured CH4
accumulation of anaerobic decomposition of incubated tropical withered tree leaves
25
BGD
9, 387–409, 2012Seasonal variability of tropical wetland
CH4 emissions
A. A. Bloom et al.
Title Page
Abstract Introduction
Conclusions References
Tables Figures
◭ ◮
◭ ◮
Back Close
Full Screen / Esc
Printer-friendly Version
Interactive Discussion
Discussion
P
a
per
|
Dis
cussion
P
a
per
|
Discussion
P
a
per
|
Discussio
n
P
a
per
|
dried and ground anaerobic decomposition ofOxycaryum cubense at 20◦
C: following a 20-day lag (where no emissions were observed) CH4produced from organic carbon
decomposition peaked after a 50-day period, and then rapidly decreased. On a tropical river-basin scale, flooded areas expand at the onset of the wet season and engulf newly available plant litter: as a result, CH4emissions from plant litter may peak before
5
the height of the water table. The occurrence of anaerobic CH4 emissions from litter
decomposition within sub-seasonal timescales raises the question as to whetherCµ
significantly varies in time.
2.1 Model description
We base our model on previous work (Bloom et al., 2010) that describes the temporal
10
variability of wetland emissions FCHt
4 (mg CH4m −2
day−1
) as a function of EWH and surface temperature:
FCHt
4=k(Γ
t
w+Dα)Q10(Tst)
T ts
10, (1)
where at time t (days), Γtw is the EWH, Tst is the surface temperature (K), Dα is
the equivalent depth of the wetland soil (m), Q10(T t
s) is the temperature dependence
15
function implemented by Gedney et al. (2004), and k is a scaling constant (mg CH4m
−2
day−1) accounting for all temporally constant factors (e.g. Gedney et al., 2004).
Equation (1) assumes an inexhaustible source of methanogen-available carbon. Here we account for the potential seasonal changes inCµby substitutingkwithφ0C
t µ,
20
whereφ0(day
−1
) is the temperature, water and carbon independent decay constant of wetland methanogenesis, andCtµis the value ofCµ(mg CH4m
−2
) at timet:
FCHt
4=φ0C
t
µ(Γtw+Dα)Q10(Ts)
T ts
BGD
9, 387–409, 2012Seasonal variability of tropical wetland
CH4 emissions
A. A. Bloom et al.
Title Page
Abstract Introduction
Conclusions References
Tables Figures
◭ ◮
◭ ◮
Back Close
Full Screen / Esc
Printer-friendly Version
Interactive Discussion
Discussion
P
a
per
|
Dis
cussion
P
a
per
|
Discussion
P
a
per
|
Discussio
n
P
a
per
|
To determine temporal changes inCµ, we defineCµt+1in terms ofCtµ:
Cµt+1=Cµt+Nµ∆t−Ft
CH4∆t, (3)
where∆t is the time interval, FCHt
4 is the carbon loss due to emitted CH4(Eq. 2), Nµ
is the net influx of carbon available for methanogenesis from plant litter, root exudates, and breakdown of complex polymers from the recalcitrant carbon pool. We assume Nµ
5
is temporally constant, and we assume wetland carbon stocks are in quasi-equilibrium on annual timescales, henceNµ =FCHt
4. Note that whenφ0 is small, the equilibrium
Cµ≫N
µ∆t. In this case, Ct+ 1
µ ≃Cµt and Eq. (2) converges to Eq. (1) (Bloom et al.,
2010), which assumesφ0Cµis constant over seasonal timescales. In order to compare
derived decay constants with observed and model values (e.g. Miyajima et al., 1997;
10
Wania et al., 2010), we determine the annual mean decay constant of wetlands areas as φ=FCHt
4/C
t µ (day
−1
). Equations (2) and (3) constitute the dynamic methanogen-available carbon model (DMCM).
2.2 Data
For the sake of brevity we only include a brief description of the datasets for our
analy-15
sis and refer the reader to dedicated papers. Solar backscatter data from the Scanning Imaging Absorption Spectrometer for Atmospheric Cartography (SCIAMACHY) instru-ment onboard Envisat is used to retrieve the mean column concentrations of CH4 in the atmosphere (Frankenberg et al., 2005). The spatial resolution of CH4 retrievals is
30 km×60 km, and the Envisat orbital geometry ensures global coverage at 6-day
in-20
tervals. CH4retrievals are only achievable in daytime cloud-free conditions. The Grav-ity Recovery and Climate Experiment (GRACE) is a twin satellite system from which the Earth’s gravity field is retrieved at 10-day intervals. Tides, atmospheric pressure and wind are included in the applied corrections on GRACE gravity retrievals: the re-maining temporal variation in GRACE gravity is dominated by terrestrial water variability
BGD
9, 387–409, 2012Seasonal variability of tropical wetland
CH4 emissions
A. A. Bloom et al.
Title Page
Abstract Introduction
Conclusions References
Tables Figures
◭ ◮
◭ ◮
Back Close
Full Screen / Esc
Printer-friendly Version
Interactive Discussion
Discussion
P
a
per
|
Dis
cussion
P
a
per
|
Discussion
P
a
per
|
Discussio
n
P
a
per
|
(Tapley et al., 2004). We incorporate SCIAMACHY CH4concentrations, GRACE EWH and NCEP/NCAR daily 1.9◦×1.88◦ temperature re-analyses (Kalnay et al., 1996) into
a process-based model following Bloom et al. (2010). We use the 2003–2008 SCIA-MACHY column CH4 retrievals (Frankenberg et al., 2008), and the CNES GRACE EWH 1◦×1◦ 10-day resolution product (Lemoine et al., 2007): we aggregate all three
5
datasets to a daily 3◦×3◦ horizontal grid (see Bloom et al., 2010).
2.3 Global parameter optimisation
We implement the DMCM on a global 3◦
×3◦grid for the period 2003–2009. We drive
the DMCM using the aggregated daily values of Tst and Γtw. We spin up the DMCM
using 2003Tst and Γtw values until it reaches an annual equilibrium (Nµ = FCHt
4). In
10
contrast to Bloom et al. (2010), we supplement theQ10(Ts) function with a gradual linear
cut-offfor temperatures for 0◦C< Tst<−10◦C, and whenTt s<−10
◦
C,FCHt
4=0 as a first
order approximation to wintertime CH4 emission inhibition in boreal wetlands. As the Q10function never reaches zero, this supplementary constraint will effectively suppress
winter-time CH4emissions, which is broadly consistent with our current understanding
15
of CH4emissions in boreal wetlands.
We apply the DMCM globally in order to determine (i) the magnitude of φand Cµ
in the tropics within each 3◦×3◦ gridcell (ii) the potential ofC
µ temporal variability on
extra-tropical wetland environments, and (iii) CH4 emissions from wetlands and rice
paddies at a global scale. We determine the global distribution and seasonal variability
20
of wetland CH4 emissions by optimising parameters φ0 and Dα at each gridcell by
minimising the following cost function (J):
J=
n X
t=1
(κ∗∆Ft
CH4−∆S t CH4)
2,
BGD
9, 387–409, 2012Seasonal variability of tropical wetland
CH4 emissions
A. A. Bloom et al.
Title Page
Abstract Introduction
Conclusions References
Tables Figures
◭ ◮
◭ ◮
Back Close
Full Screen / Esc
Printer-friendly Version
Interactive Discussion
Discussion
P
a
per
|
Dis
cussion
P
a
per
|
Discussion
P
a
per
|
Discussio
n
P
a
per
|
where∆SCHt
4 denotes the SCIAMACHY CH4 variability after we remove the
interan-nual trend (represented as a 2nd order polynomial);FCHt
4 is derived from Eqs. (2) and
(3); and the conversion factorκ (ppm kg−1CH4m
−2
day−1) relates CH4 emissions to
the equivalent column concentration in the lower troposphere (e.g. Bloom et al., 2010). We then implement the global Q10(Ts) optimisation approach of Bloom et al. (2010).
5
Like other top-down parameter optimisation methods of global wetland CH4emissions
(Gedney et al., 2004; Bloom et al., 2010), our method is unable to distinguish between the seasonality of CH4emissions from wetlands and rice paddies due to the concurring fluxes over seasonal timescales, although we anticipate varying fertilisation and irriga-tion practices will also influence the seasonality in rice paddy CH4 emissions (Conen
10
et al., 2010). We hence distinguish the sources spatially (Bloom et al., 2010) for which we have more confidence in the distribution of rice paddies. Finally, we use the IPCC global wetland and rice paddy CH4 emissions median of 227.5 Tg CH4yr
−1
(Denman et al., 2007) as a base value for 2003 emissions.
We propagate the following uncertainties through our global wetland and rice paddy
15
CH4 emissions estimation (Bloom et al., 2010): (i) SCIAMACHY CH4 observation
er-rors; (ii) the uncertainty of the linear fit between FCHt
4 and S
t
CH4; (iii) the uncertainty σκ=±16 % associated withκ; and (iv) a global wetland and rice paddy uncertainty of ±58 Tg CH4yr−1(Denman et al., 2007).
3 Results and discussion
20
Over the Amazon river basin we find wetland CH4 fluxes coinciding with small values ofCµ, resulting in a highly variableCµover seasonal timescales. Assuming an annual mean inundated fraction of 3.3 % (Prigent et al., 2007), the median CH4 flux over a
flooded area is 1.06 Mg C ha−1(369 mg CH4m−2day−1). The median Amazon wetland
Cµ=0.16 Mg C ha
−1
with a range of 0.02–7.89 Mg C ha−1
(5th–95th percentile). The
25
BGD
9, 387–409, 2012Seasonal variability of tropical wetland
CH4 emissions
A. A. Bloom et al.
Title Page
Abstract Introduction
Conclusions References
Tables Figures
◭ ◮
◭ ◮
Back Close
Full Screen / Esc
Printer-friendly Version
Interactive Discussion
Discussion
P
a
per
|
Dis
cussion
P
a
per
|
Discussion
P
a
per
|
Discussio
n
P
a
per
|
in wetlands (Neue et al., 1997; Whalen, 2005). Large temporal changes of Cµ are observed in the Amazon river basin where the mean Cµ coefficient of variation (cv)
is 28±22 % over the period 2003–2009. When we allowC
µ to vary in extra-tropical
regions we find a median ofcv<0.1 %, and as a result the relatively smallCµvariability
does not influence the seasonality of CH4emissions outside the tropics. For rice paddy
5
areas in southeast Asia we find a median ofcv=4.8 %. We acknowledge that due to
the varying rice cultivation practices around the world (Conen et al., 2010), the effects of rice paddy irrigation and the timing of fertilisation onCµ cannot be captured by the
DMCM approach.
To determine whether our derived values forCµandφare relevant to tropical
ecosys-10
tems, we compare them against laboratory measurements of anaerobic decomposition of withered leaves from a wetland region in Narathiwat, Thailand (Miyajima et al., 1997). We simulate CH4production fromCµat each model gridcell for a 200-day period
with-out fresh carbon input (Nµ=0), and we use innundated fraction observations (Prigent et al., 2007) to determine the flux magnitude over flooded areas only. Figure 2 shows
15
the cumulative CH4 production over a 200-day period for (i) simulated decomposition from derived φ and Cµ values over the Amazon, (ii) simulated decomposition from derived φ and Cµ values over boreal wetlands, and (iii) upscaled withered leaf
min-eralisation rates by Miyajima et al. (1997) using a median of 17.5 Mg C ha−1fine and coarse woody debris (Malhi et al., 2009). For boreal and tropicalCµ decomposition,
20
the median cumulative CH4emissions, 68 % confidence interval, and mean decay
con-stants (φ) are shown. For the withered leaf mineralisation rates, we show the mean fitted decay constant (φ) and the range and median cumulative CH4emissions.
The top-down parameter estimation of φand Cµ suggest plant litter Cµ is a funda-mental component of tropical CH4 emission seasonality. Our top-down estimation of
25
anaerobic decomposition rates for tropical wetland CH4emissions compare favourably
with laboratory measurements of anaerobically produced CH4: while the magnitude
BGD
9, 387–409, 2012Seasonal variability of tropical wetland
CH4 emissions
A. A. Bloom et al.
Title Page
Abstract Introduction
Conclusions References
Tables Figures
◭ ◮
◭ ◮
Back Close
Full Screen / Esc
Printer-friendly Version
Interactive Discussion
Discussion
P
a
per
|
Dis
cussion
P
a
per
|
Discussion
P
a
per
|
Discussio
n
P
a
per
|
measurements (Miyajima et al., 1997), the mean decay constantφAmazon=0.017 day
−1
compares well toφleaf=0.011 day
−1
for withered leaf decomposition. The larger lab-oratory measurements (Miyajima et al., 1997) are partially explained by an incubation temperature of 35◦
C (cf. a mean surface temperature in the Amazon basin of 23◦
C), and the lack of observations for coarse woody debris decomposition. As a result of
5
relatively highφvalues, measured leaf decomposition and model CH4emissions both show a significant reduction of CH4emission rates throughout the 200-day period. In
contrast, the boreal decay constant (φBoreal=0.0003 day
−1
) indicates relatively con-stant CH4emission rates throughout the 200-day period.
Table 1 shows a comparison between observed and model decay constants derived
10
from a variety of methods. The range ofφAmazon values are within the order of
mag-nitude of leaf and wetland macrophyte decay constants (Miyajima et al., 1997; Longhi et al., 2008; Wania et al., 2010). We believe thatφAmazon is an indicator for the
cumu-lative decay constant of the rapid anaerobic decomposition of root exudates, plant litter decomposition, and the contribution of recalcitrant carbon pools. For a more detailed
15
φAmazoncomparison with observed and model decay constant values, an estimation of
the overallφ in wetland CH4 production from bottom-up process-based models (e.g.
Wania et al., 2010) is needed.
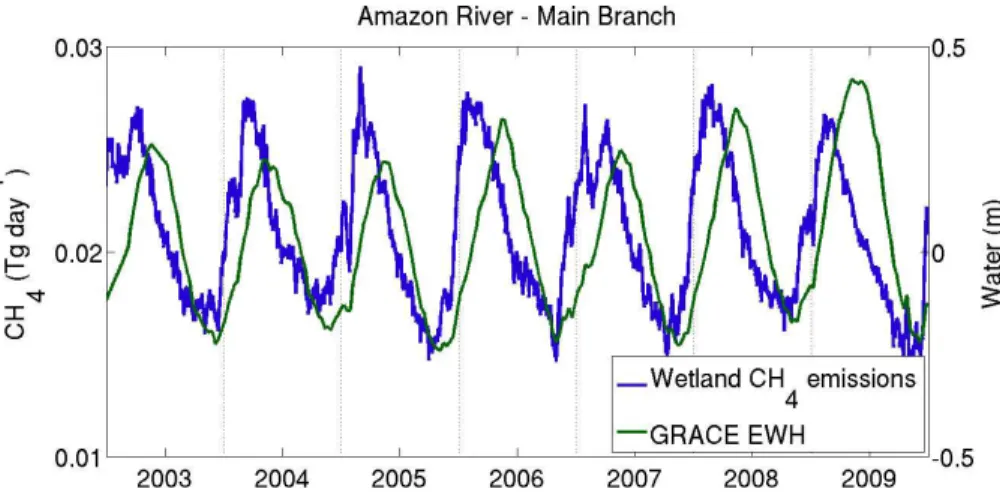
Figure 3 shows the total CH4flux over the central branch of the Amazon river (0
◦
N– 6◦S, 80◦W–40◦W). The temporal changes inCµresult in a significantly different timing
20
for CH4 emissions over the tropics in comparison to the Bloom et al. (2010) water volume and temperature dependence approach. While in the dry season the minimum CH4 fluxes coincide with the lowest GRACE EWH, peak CH4 fluxes occur during the
rising water phase. The DMCM optimisation predicts that the accumulation of carbon in the dry season results in higher Cµ values at the onset of the wet season. This
25
carbon pool is then rapidly depleted during the wet season. As a result, CH4emission
BGD
9, 387–409, 2012Seasonal variability of tropical wetland
CH4 emissions
A. A. Bloom et al.
Title Page
Abstract Introduction
Conclusions References
Tables Figures
◭ ◮
◭ ◮
Back Close
Full Screen / Esc
Printer-friendly Version
Interactive Discussion
Discussion
P
a
per
|
Dis
cussion
P
a
per
|
Discussion
P
a
per
|
Discussio
n
P
a
per
|
emissions during the peak of the wet season (Mitsch et al., 2010), although this would result in a second CH4peak at the end of the wet season. The absence of this peak in our analysis suggests this process plays only a minor role in the seasonality of tropical wetland CH4emissions.
By globally integrating the DMCM method we estimated tropical wetlands emit
5
111.1 Tg CH4yr
−1
, where Amazon wetlands account for 26.2 Tg CH4yr
−1
(24 %). Ta-ble 2 shows our estimates are within the range of other independent Amazon wetland emission CH4 estimates. Figure 4 shows the zonal profile of our top-down approach with the associated uncertainty estimates. We capture three main features of global wetland and rice paddy emissions, i.e. peaks over the tropics, subtropics and lower
10
mid-latitudes (mainly due to rice), and boreal latitudes, in agreement with previous studies (Bloom et al., 2010; Fung et al., 1991; Riley et al., 2011). In comparison to our previous work (Bloom et al., 2010) we find a slight reduction in boreal wetland emissions (3.2 %), primarily due to the introduction of a gradual cut-off in methano-genesis rates under 0◦C (Sect. 2.3). During 2003–2008, the global change in CH4
15
wetland emissions amounts to an increase of 7.7 Tg CH4yr
−1
, mostly as a result of bo-real wetlands (3.1 Tg CH4yr
−1
) and tropical wetlands (3.4 Tg CH4yr
−1
), while there is also a significant increase of 1.1 Tg CH4yr−1
from mid-latitude wetlands. The increase in Southern Hemisphere extra-tropical wetland emissions (0.13 Tg CH4yr−1
) did not significantly contribute to the CH4wetland emissions growth during 2003–2008.
20
Finally, we use our wetland and rice CH4 emission estimates to drive the
GEOS-Chem global 3-D atmospheric chemistry and transport model (described and evalu-ated by Fraser et al., 2011) allowing us to test consistency between our emissions to surface measurements of CH4 concentrations. We sample the model at the time and
geographical location of the surface CH4 measurements from the GasLab, AGAGE
25
and ESRL networks (Francey et al., 1996; Prinn et al., 2000; Cunnold et al., 2002; Dlugokencky et al., 2009). Figure 5 shows model and observed CH4 concentration
BGD
9, 387–409, 2012Seasonal variability of tropical wetland
CH4 emissions
A. A. Bloom et al.
Title Page
Abstract Introduction
Conclusions References
Tables Figures
◭ ◮
◭ ◮
Back Close
Full Screen / Esc
Printer-friendly Version
Interactive Discussion
Discussion
P
a
per
|
Dis
cussion
P
a
per
|
Discussion
P
a
per
|
Discussio
n
P
a
per
|
seasonality of model and surface measurements of CH4. We show that the DMCM approach better describes the observed seasonality in both hemispheres (rNH=0.9, rSH=0.9), and the amplitude of the Southern Hemisphere seasonality is largely
im-proved in comparison to the GEOS-Chem runs using Fung et al. (1991) and Bloom et al. (2010) CH4emissions.
5
4 Concluding remarks
Understanding the temporal controls of temperature, water volume and carbon content of wetlands is crucial in determining the global and regional seasonal cycle of wet-land CH4 emissions. We show that incorporating a temporally variable methanogen-available carbon pool,Cµ, in our top-down approach results in a significant
improve-10
ment in describing the temporal behaviour of tropical and global CH4emissions.
By implementing our dynamic methanogen-available carbon model (DMCM) on a global scale we determine the effects of a seasonally variableCµon the seasonality of
wetland CH4emissions in the Amazon river basin. We find a median decay constant
ofφAmazon=0.017 day
−1
over the Amazon river basin. Seasonal changes inCµin the
15
tropics largely explain the seasonal lag between SCIAMACHY observed CH4
concen-trations and GRACE equivalent water height. The relatively high seasonal variability in
Cµ(meancv=28 %) over the Amazon river basin results in peak CH4emissions
occur-ring mostly 1–3 months prior to the peak water height period: in contrast, the median boreal Cµ variability is cv<0.1 %. We show a substantial improvement in simulating
20
surface concentrations when using the GEOS-Chem ACTM with our wetland and rice CH4 emission estimates (r =0.9). These improvements in the magnitude and
tem-poral dynamics of tropical CH4 emissions will ultimately help constrain global inverse
modelling efforts.
We anticipate that this work will lead to further and more detailed parameterisation
25
of tropical wetland CH4 emissions, and we expect our tropical wetland CH4 emission
BGD
9, 387–409, 2012Seasonal variability of tropical wetland
CH4 emissions
A. A. Bloom et al.
Title Page
Abstract Introduction
Conclusions References
Tables Figures
◭ ◮
◭ ◮
Back Close
Full Screen / Esc
Printer-friendly Version
Interactive Discussion
Discussion
P
a
per
|
Dis
cussion
P
a
per
|
Discussion
P
a
per
|
Discussio
n
P
a
per
|
Acknowledgements. We thank Catherine Prigent for providing global inundated fraction data
and Christian Frankenberg for providing the SCIAMACHY CH4 retrievals. We thank Nancy Burns for her input on model and measured decomposition rate comparison. The surface measurements were provided by the NASA AGAGE network, the NOAA ESRL network, and the CSIRO Marine and Atmospheric Research GASLab network. A. A. B. was supported by
5
the UK Natural Environmental Research Council (NERC) studentship NE F007973 1 and funds from P. I. P.’s Philip Leverhulme Prize. A. F. was supported by the NERC National Centre for Earth Observation.
References
Bianchini Jr., I., Cunha-Santino, M. B. d., Romeiro, F., and Bitar, A. L.: Emissions of methane
10
and carbon dioxide during anaerobic decomposition of aquatic macrophytes from a tropical lagoon (S ˜ao Paulo, Brazil), Acta Limnologica Brasiliensia, 22, 157–164, 2010. 390
Bloom, A. A., Palmer, P. I., Fraser, A., Reay, D. S., and Frankenberg, C.: Large-Scale Controls of Methanogenesis Inferred from Methane and Gravity Spaceborne Data, Science, 327, 322– 325, 2010. 388, 389, 390, 391, 392, 393, 394, 396, 397, 398, 404, 408, 409
15
Cao, M., Marshall, S., and Gregso, K.: Global carbon exchange and methane emissions from natural wetlands: Application of a process-based model, J. Geophys. Res., 101, 14399– 14414, 1996. 388
Conen, F., Smith, K. A., and Yagi, K.: Methane from rice cultivation, in: Methane and Climate Change, edited by: Reay, D., Smith, P., and van Amstel, A., Earthscan, London, UK, 115–
20
135, iSBN 9781844078233, 2010. 394, 395
Cunnold, D. M., Steele, L. P., Fraser, P. J., Simmonds, P. G., Prinn, R. G., Weiss, R. F., Porter, L. W., O’Doherty, S., Langenfelds, R. L., Krummel, P. B., Wang, H. J., Emmons, L., Tie, X. X., and Dlugokencky, E. J.: In situ measurements of atmospheric methane at GAGE/AGAGE sites during 1985-2000 and resulting source inferences, J. Geophys. Res. Atmos., 107, 4225,
25
doi:10.1029/2001JD001226, 2002. 397, 409
Denman, K., Brasseur, G., Chidthaisong, A., Ciai, P., Cox, P., Dickinson, R., Hauglustaine, D., Heinze, C., Holland, E., Jacob, D., Lohmann, U., Ramachandran, S., da Silva Dias, P., Wofsy, S., and Zhang, X.: Couplings Between Changes in the Climate System and Biogeochemistry, in: Climate Change 2007: The Physical Science Basis. Contribution of Working Group I to
BGD
9, 387–409, 2012Seasonal variability of tropical wetland
CH4 emissions
A. A. Bloom et al.
Title Page
Abstract Introduction
Conclusions References
Tables Figures
◭ ◮
◭ ◮
Back Close
Full Screen / Esc
Printer-friendly Version
Interactive Discussion
Discussion
P
a
per
|
Dis
cussion
P
a
per
|
Discussion
P
a
per
|
Discussio
n
P
a
per
|
the Fourth Assessment Report of the Intergovernmental Panel on Climate Change edited by: Solomon, S., Qin, D., Manning, M., Chen, Z., Marquis, M., Averyt, K. B., Tignor, M., and Miller, H. L., Cambridge University Press, Cambridge, UK and New York, NY, USA, 2007. 388, 394
Dingemans, B., Bakker, E., and Bodelier, P.: Aquatic herbivores facilitate the emission of
5
methane from wetlands, Ecology, 92, 1166–1173, 2011. 389
Dlugokencky, E. J., Lang, P., and Masarie, K.: Atmospheric Methane Dry Air Mole Fractions from the NOAA ESRL Carbon Cycle Cooperative Global Air Sampling Network, 1983–2007, Version: 2008-07-02, 2009. 397, 409
Francey, R. L., Steele, L., Langenfelds, R., Lucarelli, M., Allison, C., Beardsmore, D., Coram, S.,
10
Derek, N., de Silva, F., Etheridge, D., Fraser, P., Henry, R., Turner, B., Welch, E., Spencer, D., and Cooper, L.: Global Atmospheric Sampling Laboratory (GASLAB): supporting and extending the Cape Grim trace gas programs. Baseline Atmospheric Program (Australia) 1993, edited by: Francey, R. J., Dick, A. L., and Derek, N., 8–29, Bureau of Meteorology and CSIRO Division of Atmospheric Research, Melbourne, Australia, 1996. 397, 409
15
Frankenberg, C., Meirink, J. F., van Weele, M., Platt, U., and Wagner, T.: Assessing Methane Emissions from Global Space-Borne Observations, Science, 308, 1010–1014, 2005. 392 Frankenberg, C., Warneke, T., Butz, A., Aben, I., Hase, F., Spietz, P., and Brown, L. R.:
Pres-sure broadening in the 2ν3 band of methane and its implication on atmospheric retrievals, Atmos. Chem. Phys., 8, 5061–5075, doi:10.5194/acp-8-5061-2008, 2008. 393
20
Fraser, A., Chan Miller, C., Palmer, P. I., Deutscher, N. M., Jones, N. B., and Griffith, D. W. T.: The Australian methane budget: Interpreting surface and train-borne measurements using a chemistry transport model, J. Geophys. Res., 116, D20306, doi:10.1029/2011JD015964, 2011. 397, 409
Fung, I., John, J., Lerner, J., Matthews, E., Prather, M., Steele, L. P., and Fraser, P. J.:
Three-25
dimensional model synthesis of the global methane cycle, J. Geophys. Res., 96, 13033– 13065, doi:10.1029/91JD01247, 1991. 397, 398, 404, 408, 409
Gedney, N., Cox, P. M., and Huntingford, C.: Climate feedback from wetland methane emis-sions, Geophys. Res. Lett., 31, L20503, doi:10.1029/2004GL020919, 2004. 389, 391, 394 Hodson, E. L., Poulter, B., Zimmermann, N. E., Prigent, C., and Kaplan, J. O.: The El Ni
˜no-30
Southern Oscillation and wetland methane interannual variability, Geophys. Res. Lett., 38, L08810, doi:10.1029/2011GL046861, 2011. 389
BGD
9, 387–409, 2012Seasonal variability of tropical wetland
CH4 emissions
A. A. Bloom et al.
Title Page
Abstract Introduction
Conclusions References
Tables Figures
◭ ◮
◭ ◮
Back Close
Full Screen / Esc
Printer-friendly Version
Interactive Discussion
Discussion
P
a
per
|
Dis
cussion
P
a
per
|
Discussion
P
a
per
|
Discussio
n
P
a
per
|
from northern peatforming wetlands, Trends Ecol. Evol., 14, 385–388, 1999. 389
Kalnay, E., Kanamitsu, M., Kistler, R., Collins, W., Deaven, D., Gandin, L., Iredell, M., Saha, S., White, G., Woollen, J., Zhu, Y., Leetmaa, A., Reynolds, R., Chelliah, M., Ebisuzaki, W., Higgins, W., Janowiak, J., K.C. Mo, C. R., Wang, J., Jennec, R., and Joseph, D.: The NCEP/NCAR 40-Year Reanalysis Project, B. Am. Meteorol. Soc., 77, 437–471, 1996. 393
5
Lemoine, J.-M., Bruinsma, S., Loyer, S., Biancale, R., Marty, J.-C., Perosanz, F., and Balmino, G.: Temporal gravity field models inferred from GRACE data, Adv. Space Res., 39, 1620– 1629, doi:10.1016/j.asr.2007.03.062, 2007. 393
Lewis, S. L., Brando, P. M., Phillips, O. L., van der Heijden, G. M. F., and Nepstad, D.: The 2010 Amazon Drought, Science, 331, 554, doi:10.1126/science.1200807, 2011. 389
10
Longhi, D., Bartoli, M., and Viaroli, P.: Decomposition of four macrophytes in wetland sedi-ments: Organic matter and nutrient decay and associated benthic processes, Aquat. Bot. 89, 303–310, doi:10.1016/j.aquabot.2008.03.004, 2008. 396, 403
Malhi, Y., Aragao, L. E. O. C., Metcalfe, D. B., Paiva, R., Quesada, C. A., Almeida, S., Anderson, L., Brando, P., Chambers, J. Q., Da Costa, A. C. L., Hutyra, L. R., Oliveira, P., Patino, S.,
15
Pyle, E. H., Robertson, A. L., and Teixeira, L. M.: Comprehensive assessment of carbon productivity, allocation and storage in three Amazonian forests, Global Change Biol., 15, 1255–1274, doi:10.1111/j.1365-2486.2008.01780.x, 2009. 395, 406
Melack, J. M., Hess, L. L., Gastil, M., Forsberg, B. R., Hamilton, S. K., Lima, I. B. T., and Nova, E. M. L. M.: Regionalization of methane emissions in the Amazon basin with microwave
20
remote sensing, Global Change Biol., 10, 530–544, 2004. 404
Mitsch, W., Nahlik, A., Wolski, P., Bernal, B., Zhang, L., and Ramberg, L.: Tropical wet-lands: seasonal hydrologic pulsing, carbon sequestration, and methane emissions, Wetl. Ecol. Manage., 18, 573–586, doi:10.1007/s11273-009-9164-4, 2010. 389, 397
Miyajima, T., Wada, E., Hanba, Y. T., and Vijarnsorn, P.: Anaerobic mineralization of indigenous
25
organic matters and methanogenesis in tropical wetland soils, Geochim. Cosmochim. Ac., 61, 3739–3751, doi:10.1016/S0016-7037(97)00189-0, 1997. 390, 392, 395, 396, 403, 406 Neue, H., Wassmann, R., Kludze, H., Bujun, W., and Lantin, R.: Factors and processes
control-ling methane emissions from rice fields, Nutr. Cycl. Agroecosys., 49, 111–117, 1997. 389, 395
30
Oki, T. and Sud, Y. C.: Design of Total Runoff Integrating Pathways (TRIP) – A global river channel network, Earth Interact., 2, 1–37, 1998. 389
BGD
9, 387–409, 2012Seasonal variability of tropical wetland
CH4 emissions
A. A. Bloom et al.
Title Page
Abstract Introduction
Conclusions References
Tables Figures
◭ ◮
◭ ◮
Back Close
Full Screen / Esc
Printer-friendly Version
Interactive Discussion
Discussion
P
a
per
|
Dis
cussion
P
a
per
|
Discussion
P
a
per
|
Discussio
n
P
a
per
|
inferred from multiple satellite observations, 1993-2000, J. Geophys. Res. Atmos., 112, D12107, doi:10.1029/2006JD007847, 2007. 394, 395, 405
Prinn, R. G., Weiss, R. F., Fraser, P. J., Simmons, P. G., Cunnold, D. N., Alyea, F. N., O’Doherty, S., Salameh, P., Miller, B. R., Huang, J., Wang, R. H. J., Hartley, D. E., Harth, C., Steele, L. P., Sturrock, G., Midgley, P. M., and McCulloch, A.: A History of Chemically and Radiatively
5
Important Gases in Air deduced from ALE/GAGE/AGAGE, J. Geophys. Res., 105, 17751– 17792, 2000. 397, 409
Riley, W. J., Subin, Z. M., Lawrence, D. M., Swenson, S. C., Torn, M. S., Meng, L., Mahowald, N. M., and Hess, P.: Barriers to predicting changes in global terrestrial methane fluxes: analyses using CLM4Me, a methane biogeochemistry model integrated in CESM, Biogeosciences, 8,
10
1925–1953, doi:10.5194/bg-8-1925-2011, 2011. 389, 397, 404, 408
Ringeval, B., de Noblet-Ducoudr ´e, N., Ciais, P., Bousquet, P., Prigent, C., Papa, F., and Rossow, W. B.: An attempt to quantify the impact of changes in wetland extent on methane emis-sions on the seasonal and interannual time scales, Global Biogeochem. Cy., 24, GB2003, doi:10.1029/2008GB003354, 2010. 389
15
Sitch, S., Smith, B., Prentice, I. C., Arneth, A., Bondeau, A., Cramer, W., Kaplan, J. O., Levis, S., Lucht, W., Sykes, M. T., Thonicke, K., and Venevsky, S.: Evaluation of ecosystem dynamics, plant geography and terrestrial carbon cycling in the LPJ dynamic global vegetation model, Global Change Biol., 9, 161–185, doi:10.1046/j.1365-2486.2003.00569.x, 2003. 390 Tapley, B. D., Bettadpur, S., Ries, J. C., Thompson, P. F., and Watkins, M. M.:
20
GRACE Measurements of Mass Variability in the Earth System, Science, 305, 503–506, doi:10.1126/science.1099192, 2004. 393
Walter, B. P., Heimann, M., and Matthews, E.: Modelling modern methane emissions from natural wetlands 1. Model description and results, J. Geophys. Res., 106, 34189–34206, 2001. 389
25
Wania, R., Ross, I., and Prentice, I. C.: Implementation and evaluation of a new methane model within a dynamic global vegetation model: LPJ-WHyMe v1.3.1, Geosci. Model Dev., 3, 565–584, doi:10.5194/gmd-3-565-2010, 2010. 390, 392, 396, 403
Whalen, S. C.: Biogeochemistry of Methane Exchange between Natural Wetlands and the Atmosphere, Environ. Eng. Sci., 22, 73–95, 2005. 389, 395
BGD
9, 387–409, 2012Seasonal variability of tropical wetland
CH4 emissions
A. A. Bloom et al.
Title Page
Abstract Introduction
Conclusions References
Tables Figures
◭ ◮
◭ ◮
Back Close
Full Screen / Esc
Printer-friendly Version
Interactive Discussion
Discussion
P
a
per
|
Dis
cussion
P
a
per
|
Discussion
P
a
per
|
Discussio
n
P
a
per
|
Table 1. Model and observed decay constants for organic matter decomposition in anaerobic environments.
Decay Constant (yr−1
) Study
Amazon Wetlands (φAmazon) 2.6−9.6a This Study: Top-down wetland CH
4
(median=5.9) emission parameter optimization
Withered Leaves (35◦C) 4.0 Miyajima et al. (1997): Decay constant from anaerobic tropical leaf CH4mineralisation
Wetland Macrophyte 1.0−5.5 Longhi et al. (2008)b:
Decomposition Measured decomposition
rates in Paluda di Ostiglia, Italy
Soil Carbon Pool (10◦
C) 0.001−0.03 Wania et al. (2010): Bottom-up
CH4Emissions from Northern Peatlands
Leaf Litter (10◦
C) 0.35
Root Exudates (10◦C) 13
BGD
9, 387–409, 2012Seasonal variability of tropical wetland
CH4 emissions
A. A. Bloom et al.
Title Page
Abstract Introduction
Conclusions References
Tables Figures
◭ ◮
◭ ◮
Back Close
Full Screen / Esc
Printer-friendly Version
Interactive Discussion
Discussion
P
a
per
|
Dis
cussion
P
a
per
|
Discussion
P
a
per
|
Discussio
n
P
a
per
|
Table 2.Estimates of total annual Amazon river basin wetland CH4emissions (Tg CH4yr−1
).
Study Amazon Wetland CH4Emissions (Tg CH4yr−1
)
Melack et al. (2004) 22 Fung et al. (1991) 5.3 Riley et al. (2011) 58.9a Bloom et al. (2010) 20.0
This study 26.2±9.8
aHigh tropical fluxes by Riley et al. (2011) are a result of anomalously high predicted net primary productivity in the
BGD
9, 387–409, 2012Seasonal variability of tropical wetland
CH4 emissions
A. A. Bloom et al.
Title Page
Abstract Introduction
Conclusions References
Tables Figures
◭ ◮
◭ ◮
Back Close
Full Screen / Esc
Printer-friendly Version
Interactive Discussion
Discussion
P
a
per
|
Dis
cussion
P
a
per
|
Discussion
P
a
per
|
Discussio
n
P
a
per
|
Fig. 2.Model and laboratory measurements of cumulative CH4emissions from withering leaves over a 200-day period. Blue: median and range of values from Miyajima et al. (1997). Red (green): median and 68 % confidence interval range of CH4emissions from the Amazon river basin (boreal wetland) fromCµandφvalues whenNµ=0. A total litter stock of 17.5 Mg C ha−1
BGD
9, 387–409, 2012Seasonal variability of tropical wetland
CH4 emissions
A. A. Bloom et al.
Title Page
Abstract Introduction
Conclusions References
Tables Figures
◭ ◮
◭ ◮
Back Close
Full Screen / Esc
Printer-friendly Version
Interactive Discussion
Discussion
P
a
per
|
Dis
cussion
P
a
per
|
Discussion
P
a
per
|
Discussio
n
P
a
per
|
Fig. 3. Daily wetland CH4emissions for 2003–2009 (blue) and GRACE equivalent water height (green) over the central branch of the Amazon river (0◦
–6◦ S, 40◦
BGD
9, 387–409, 2012Seasonal variability of tropical wetland
CH4 emissions
A. A. Bloom et al.
Title Page
Abstract Introduction
Conclusions References
Tables Figures
◭ ◮
◭ ◮
Back Close
Full Screen / Esc
Printer-friendly Version
Interactive Discussion
Discussion
P
a
per
|
Dis
cussion
P
a
per
|
Discussion
P
a
per
|
Discussio
n
P
a
per
|