Estudo morfométrico da fossa inter
Estudo morfométrico da fossa inter
Estudo morfométrico da fossa inter
Estudo morfométrico da fossa inter
Estudo morfométrico da fossa intercondilar femoral em
condilar femoral em
condilar femoral em
condilar femoral em
condilar femoral em
joelhos com e sem lesão do ligamento cruzado anterior
joelhos com e sem lesão do ligamento cruzado anterior
joelhos com e sem lesão do ligamento cruzado anterior
joelhos com e sem lesão do ligamento cruzado anterior
joelhos com e sem lesão do ligamento cruzado anterior
(L.C.A.), através da aplicação de um sof
(L.C.A.), através da aplicação de um sof
(L.C.A.), através da aplicação de um sof
(L.C.A.), através da aplicação de um sof
(L.C.A.), através da aplicação de um softwar
twar
twar
twar
tware sobr
e sobr
e sobr
e sobr
e sobre
e
e
e
e
imagens radiográficas digitalizadas
imagens radiográficas digitalizadas
imagens radiográficas digitalizadas
imagens radiográficas digitalizadas
imagens radiográficas digitalizadas
Morphometric study of the femoral intercondylar notch of knees with and without injuries of anterior
cruciate ligament (A.C.L.), by the use of software in digitalized radiographic images.
R
ITADIC
ÁSSIA DEO
LIVEIRAA
NGELO1, S
ÍLVIAR
EGINAA
RRUDA DEM
ORAES2,
L
UCIANOC
ARVALHOS
URUAGY 3, T
ETSUOT
ASHIRO4, H
ELENAM
EDEIROSC
OSTA5.
Trabalho recebido em 29/04/2003. Aprovado em 20/06/2004.
A
RTIGOO
RIGINAL/
ORIGINAL ARTICLE
Trabalho realizado no Centro Médico Hospitalar da Polícia Militar do estado de Pernambuco (CMH/ PMPE).
1 - Mestre em Anatomia Patológica do Departamento de Anatomia Patológica da UFPE.
2 - Professora Adjunta - Doutora do Departamento de Anatomia da UFPE (Orientadora).
3 - Médico do Serviço de Artroscopia e Cirurgia do Joelho do CMH/ PMPE.
4 - Professor Assistente do Departamento de Educação Física da UFPE. 5 - Fisioterapeuta.
Endereço para correspondência: Rua Estevão de Sá, 650 Várzea -Recife - PE - CEP 50740-270 - email: rita-sol@uol.com.br
RESUMO
Os autores sugerem a aplicação de um software sobre imagens radiográficas digitalizadas para análise morfométrica da fossa inter-condilar e dos côndilos femorais. O programa permite o tracejamento de linhas guias que facilitam a mensuração da extremidade distal do fêmur. Foram analisadas 39 radiografias simples da fossa intercondilar femoral dos joelhos direito e esquerdo, obtidas de indivíduos do sexo masculino reunidos em grupo normal (n=23) e grupo lesionado (n=16). A média de idade da amostra foi de 26,56 anos. As variáveis analisa-das foram largura bicondilar femoral, larguras da fossa intercondilar ao nível do sulco poplíteo e da base da fossa, a altura da fossa intercon-dilar e a largura do côndilo femoral lateral. A fossa interconintercon-dilar foi classificada quanto ao formato em cônica, circular e retangular. Os resultados encontrados sugerem que a largura da base da fossa e a largura do côndilo femoral lateral seriam fatores de risco importantes na lesão do L.C.A. Os valores médios das variáveis analisadas aproxi-mam-se dos descritos na literatura especializada em mensurações diretas em peças cadavéricas e ressonância nuclear magnética e demonstram que a aplicação de um software sobre as imagens radio-gráficas digitalizadas proporciona uma mensuração confiável, mesmo utilizando-se de imagens radiográficas simples e de baixo custo.
Descritores: Fossa intercondilar femoral; Ligamento cruzado anterior; Morfologia; Joelho.
SUMMARY
The authors suggest the use of software in digitalized radiographic images to morphometric analysis of the intercondylar notch and the femoral condyles. The software allows the draw of guide lines which facilitate the measurement of the distal extremity of femur. Thirty-nine radiographic simple has been analyzed of femoral intercondylar notch of right and left knees, of male sex individuals collected into normal (n=23) and injured (n=16) groups. The age average was 26-56 years old.The analyzed variable had been femoral bicondylar width, widths of intercondylar notch to the level of the popliteal groove and the notch base, intercondylar notch height and the width of lateral femoral condyle. The intercondylar notch was classified according to its shape into con-ical , circular and rectangular. The results suggest that the base width of the notch and the width of the femoral condyle would be important risk factors of the injury of A.C.L. The average range of analyzed vari-ables are near to the ones described in the specialized literature in direct measurements in corpse pieces and magnetic resonance imag-ing and demonstrate that the use of a software in digitalized radio-graphic images provides a realiable measurement, even if simple and low cost radiographic images are used.
Key words: Femoral intercondylar notch; Anterior cruciat ligament; Morphology; Knee.
Work performed at the Anatomy Department of the Federal University of Pernambuco (UFPE)
1 - Master Graduate in Morphology at Anatomy Department of UFPE 2 - Associated Professor in Morphology of Anatomy Department of UFPE 3 - Doctor of Arthroscopy Service and Knee Surgery of CMH/PMPE. 4 - Assistant Professor of Physical Education Department of UFPE 5 - Physiotherapist
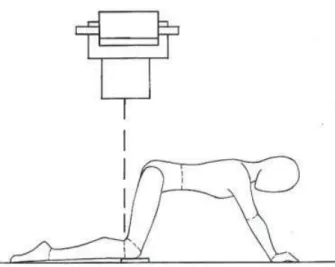
Figura 1 - Desenho esquemático demonstrando método de Holmblad (1937) para exame radiográfico em incidência
póstero-anterior axial.
Figure 1 - Schematic picture demonstrating Holmblad method (1937) for radiographic exam in posterior to anterior view. INTRODUÇÃO
A ruptura aguda do ligamento cruzado anterior (L.C.A.) é comum em esportes que requerem freqüentes movimentos rotacionais, para-das bruscas ou aterrissagem de saltos. Acredita-se que a morfologia da fossa intercondilar femoral pode predispor a lesões do L.C.A., e que sua análise morfométrica poderia fornecer importantes dados a serem utilizados na prevenção e prognóstico dessas lesões(13).
A fossa intercondilar já foi analisada à luz da tomografia computa-dorizada (T.C.)(6), da ressonância nuclear magnética (R.N.M.)(1,7), da radiografia(2,9,7,12 13,14) e, também, através da medição direta em cadá-veres(3,4,10,11,15). Em 1937, Holmblad(8) propôs uma incidência radiográ-fica para melhor visualização da fossa intercondilar femoral onde a imagem da fossa era obtida com os joelhos flexionados em 75º, a tíbia aproximadamente paralela à mesa de exame e a ampola dos raios X centrada no cavo poplíteo, perpendicularmente ao eixo tibial. Outros autores(9,13, 14), igualmente utilizando-se do método de Holmblad (1937)(8), realizaram estudos da fossa intercondilar em imagens radio-gráficas, entretanto, a mensuração das variáveis foi manual e direta-mente sobre o filme radiográfico.
Este estudo propõe utilizar um software para análise dos aspectos morfométricos e morfológicos em imagens radiográficas da fossa in-tercondilar femoral e do côndilo femoral lateral, e sugere um método de tracejamento de linhas guias que facilitam a mensuração de variá-veis como largura e altura da fossa intercondilar femoral, larguras da base da fossa intercondilar e do côndilo femoral lateral, largura bicon-dilar femoral e o Índice de Largura do Intercôndilo, proporcionando dados mais acurados a fim de traçar um perfil anatômico da fossa intercondilar femoral e dos côndilos femorais de adultos jovens de ambos os sexos, em faixa etária ativa com e sem lesão do L.C.A.
MATERIAIS E MÉTODOS
Foram analisadas 39 radiografias simples da fossa intercondilar femoral dos joelhos direito e esquerdo, obtidas de 39 indivíduos do sexo masculino, com faixa etária entre 14 e 45 anos, reunidos em dois grupos: 46 joelhos normais de 23 indivíduos sem patologias prévias dos membros inferiores (Grupo 1) e
32 joelhos de 16 indivíduos com di-agnóstico de lesão aguda unilateral do L.C.A. (Grupo 2). A triagem e co-leta de dados foram realizadas no Centro Médico Hospitalar da Polícia Militar de Pernambuco. Os voluntári-os assinaram termo de consentimen-to livre e esclarecido onde se com-prometeram em ceder as imagens radiográficas para fins de pesquisa. O presente estudo foi aprovado de acordo com a resolução nº 196/96 pelo Comitê de Ética em Pesquisa envolvendo seres humanos do Cen-tro de Ciências da Saúde da Univer-sidade Federal de Pernambuco (CEP/CCS/UFPE).
Para obtenção das imagens ra-diográficas da fossa intercondilar femoral, foi adotado o método pro-posto por Holmblad (1937)(8). Os in-divíduos foram posicionados sobre a mesa de exame em genuflexo com as mãos e os joelhos apoiados
INTRODUCTION
The acute tear of anterior cruciate ligament (A.C.L.) is common in sports requiring frequent that rotational movements, rough stops or jumps. It is a belief that the morphology of the femoral intercondylar notch can predispose the injuries of A.C.L., and its morphometry anal-ysis could provide important data to be used in the prevention and prognostic of these injuries(13).
The intercondylar notch has already been analyzed by computed tomography (C.T.)(6), by magnetic resonance imaging (M.R.I.)(1,7), by film radiography (2,9,7,12,13,14) and, also by the direct measurement in corpses(3,4,10,11,15).
In 1937, Holmblad(8) considered a radiographic view for better visu-alization of femoral intercondylar notch where notch image was gotten with 75 ° knees flexed, the tibia approximately parallel on examination table and the X-rays blister centered in popliteal cavum, perpendicular-ly to the tibial axis. Other authors(9,13,14) ,equally using Holmblad meth-od (1937)(8) , had carried out intercondylar notch radiographic images studies, however, the measurement of the variables was manual and directly on the radiographic film.
This study proposes using a software for analysis of the morpho-metric and morphologic aspects in radiographic images of femoral intercondylar notch and the lateral femoral condyle, and suggest a draw method of guide lines that facilitate the measurement of variables as width and height of femoral intercondylar notch, intercondylar notch base width and lateral femoral condyle, femoral bicondylar width and the Intercondyle Width Index, providing more accurate data in order to trace an anatomic profile of femoral intercondylar notch and femoral condyles of young adults of both sex, in active age group with and without injured of A.C.L.
MATERIALS AND METHODS
Thirty-nine radiographic studies have been analyzed of the femoral intercondylar notch of left and right knees, of 39 male sex individuals, in 14 – 45 age range, collected into two groups: 46 normal knees of 23 individuals with no prior pathologies of inferior members (group 1) and 32 knees of 16 individuals with a di-agnostic of unilateral acute injury of A.C.L. (group 2). The data have been sellected and collected at Centro Médico Hospitalar da Polícia Militar de Pernambuco. The volunteers signed a commitment term to give the radiographic images for re-search. The present study have been aproved in according to the resolution nº 196/96 of Comitê de Ética em Pesquisa involving human beings of Centro de Ciências da Saúde da Universidade Federal de Pernambuco (CEP/CCS/UFPE).
Figura 2 - Tracejamento das linhas referenciais para mensuração das variáveis. Em a desenho esquemático e b
imagem radiográfica com traçado de linhas referenciais.
Figure 2 - Drawing of reference lines to variable measurement. In a schematic picture and b radiographic image with reference picture
lines. sobre a mesa (Figura 1). A amplitude articular dos joelhos foi estabelecida em 75º(8) e determinada através de goniômetro clínico, variações no posicionamento das pernas, tornozelos e pés foram corrigidas pelo pesquisador que esteve presente durante a coleta de todas as imagens.
As imagens radiográficas foram digitalizadas através de um scan-ner da marca TCÊ MK 600u e do programa MGI Photo Suite SE que
permitiu o tracejamento das linhas referenciais com nitidez dos contor-nos ósseos. Para melhor visualização dos limites da fossa, foram feitos vários cliques com o mouse demarcando a área com 10 a 20 pontos. Posteriormente, as variáveis foram mensuradas através do software KEYCAD complete version 1.0 (1993).
As variáveis analisadas foram: a largura bicondilar femoral (lbc), a largura da fossa intercondilar femoral (lf), o Índice de Largura do Inter-côndilo (I.L.I.)(14), a largura da base da fossa intercondilar femoral (B); a largura do côndilo femoral lateral (lcl) e a altura da fossa (af). Para a medição das variáveis, foram traçadas linhas referenciais (Figura 2): Linha A, traçada horizontalmente através do centro do sulco poplíteo, presta-se à mensuração da distância bicondilar femoral, da largura da fossa intercondilar e do côndilo femoral lateral; Linha B, tangente à superfície articular ventral dos côndilos femorais; referencial para a medição da altura da fossa intercondilar; Linha C, traçada ligando-se o vértice mais distal das faces da fossa intercondilar, determina o valor da base da fossa intercondilar; Linha D, traçada perpendicularmente à linha B, seguindo em direção ao teto da fossa intercondilar, determina a altura da fossa (distância entre o teto e a linha C). O I.L.I. foi calcu-lado pela razão entre a largura da fossa intercondilar femoral e a largu-ra bicondilar femolargu-ral(14) ao nível da linha A.
Os valores obtidos foram comparados entre os grupos 1 (normal) e 2 (lesionado) quanto à lateralidade e, posteriormente, submetidos à análise estatística. Utilizou-se o teste t de Student na comparação de
amostras paramétricas não pareadas para correlacionar os dados quan-to à lateralidade e a condição clínica do joelho, com e sem lesão do L.C.A. Em todos os testes realizados adotou-se nível de significância de 5% (pd”0,05). A forma da fossa intercondilar femoral foi classificada segundo os critérios adotados por Ellera Gomes; Scarton (1998)(2) em cônica, circular e retangular. O Sign Test (teste do sinal) foi utilizado na fase final do estudo para observar a freqüência de semelhança da forma da fossa intercondilar femoral entre os joelhos direito e esquerdo do grupo 1 e entre os joelhos direito e esquerdo do grupo 2.
RESULTADOS
A correlação dos valores médios obtidos da mensuração das variáveis de ambos os joelhos do grupo 1 (sem lesão do LCA) e do grupo 2 (com lesão do LCA) estão demonstrados nas Tabelas 1, 2, 3, 4, 5 e 6. A análise comparativa dos dados obtidos não apresentou diferenças estatísticas significantes (p ≤ 0,05). Quanto à for-ma da fossa intercondilar femoral, 78,26% dos joelhos do grupo 1 foram considerados cônicos (Figura 3), 17,4% circulares (Figura 4) e 4,34% de formato retangular (Figura 5). No grupo 2, 56,25% dos joelhos apre-sentaram a fossa intercondilar femo-ral de formato cônico, 31,25% circu-lar e 12,5% retangucircu-lar (Figuras 6, 7).
by a clinical goniometer, any variation of legs, ankles and feet position were corrected by the researcher who was present during the collec-tion of all images.
The radiographic images were digitalized by the scanner TCÊ MK
600u and the software MGI Photo Suite SE, that allowed the draw of
reference lines with bone sharp contours. For a better visualization of notch limits, various clicks of the mouse were made to mark the area with 10 to 20 points. Afterwards, the variables were measured by the software KEYCAD complete version 1.0 (1993).
The variables analyzed were: femoral bicondylar width (fbw), fem-oral intercondylar notch width (inw), Intercondyle Width Index (I.W.I.)(14), femoral intercondylar notch base width (B); lateral femoral condyle width (lcw) and the notch height (nh). To measure the variables, refer-ence lines were drawn (Figure 2): Line A, horizontally traced through the popliteal groove, to measure bicondylar distance, intercondylar notch width and lateral femoral condyle; Line B, tangent to the articular ven-tral surface of femoral condyles; reference to the measurement of intercondylar notch height; Line C, join the more distal vertex of inter-condylar notch faces, determines the value of interinter-condylar notch base; Line D, perpendicular to line B, towards the intercondylar notch roof, determines the notch height (distance between the roof and line C). The I.W.I. was calculated by the division between the femoral inter-condyle notch width and femoral bicondylar width(14) to line A level.
The obtained values were compared between groups 1 (normal) and 2 (injured) as for the laterality and, afterwards, submitted to statis-tical analysis. The Student t test was used in non coupled parametrical samples comparision to correlate the data as laterality and knee clinical condition, with and without A.C.L. injury. In all the carried out tests, 5% significance level was adopted (pd”0,05). The femoral intercondylar notch shape was classified according to criteria adopted by Ellera Go-mes; Scarton (1998)(8) in conical, circular and rectangular. The Sign Test was used in the final phase of the study to observe the likeness frequency of femoral intercondylar notch shape between right and left knees of group 1 and between right and left knees of group 2.
RESULTS
The correlation of average values obtained by the measurement of variables of both knees of group 1 (without injury of A.C.L.) and group 2 (injured A.C.L.) are shown on tables 1, 2, 3, 4, 5 and 6. The comparative analysis of obtained data did not show significant statistically differenc-es (p £ 0,05). Concerning about the femoral intercondylar notch shape, 78,26% of group 1 knees were considered conical (Figure 3), 17,4% circular (Figure 4) and 4,34% rectan-gular (Figure 5). In group 2, 56,25% showed the conical femoral inter-condylar notch, 31,25% circular and 12,5% rectangular (Figures 6,7).
DISCUSSION
mor-Tabela 1 - Valores médios da largura bicondilar da fossa intercondilar (lbc) dos joelhos direitos (D) e esquerdos (E) de indivíduos sem lesão (grupo1) e indivíduos com lesão unilateral
do L.C.A. (grupo 2), desvio-padrão (DP), erro padrão da média (EPM), valores máximo (Máx) e mínimo (Mín) e número de casos
(N) segundo o grupo.
Table 1 - Average values of intercondylar notch bicondylar width (fbw) of right knees (R) and left (L) of individuals without injury (group1) and individuals with unilateral injury of A.C.L. (group 2),
standard-deviation (SD), average standard error (ASE), values maximum (Max) and minimum (Min) and number of cases (N)
according to the group.
lbc (milímetros) / fbw (milimeters)
Grupo/Group 1 Grupo/Group 2 Grupo/Group 1Grupo/Group 2
D/R D/R E/L E/L
Média/Average 82,17 83,70 82,13 83,79 DP / SD 4,924 6,467 5,422 5,928 EPM / ASE 1,026 1,161 1,130 1,482 Máx / Max 91,00 92,91 92,59 100,42 Mín / Min 69,04 76,31 67,96 76,47
N / N 23 16 23 16
Teste T de Student / Test T of Student p ≤ 0,05; pD=0,410; pE=0,371 FONTE/Source:*
f (milímetros) / inw (milimeters)
Grupo/Group 1 Grupo/Group 2 Grupo/Group 1 Grupo/Group 2
D/R D E E
Média / Average 21,89 24,07 23,44 23,87 DP / SD 5,273 3,606 3,392 3,768 EPM / ASE 1,099 0,901 0,707 0,942 Máx / Max 31,45 30,93 29,69 29,85 Mín / Min 14,37 19,48 16,61 16,60
N / N 23 16 23 16
Teste T de Student / Test T of Student p ≤ 0,05; pD=0,135; pE=0,712 FONTE/SOURCE*
Tabela 2 - Valores médios da largura da fossa intercondilar (lf) dos joelhos direitos (D) e esquerdos (E) de indivíduos sem lesão
(grupo1) e indivíduos com lesão unilateral do L.C.A. (grupo 2), desvio-padrão (DP), erro padrão da média (EPM), valores máximo
(Máx) e mínimo (Mín) e número de casos (N) segundo o grupo. Table 2 - Average values of intercondylar notch width (inw) of right
knees (R) and left (L) of individuals without injury (group1) and individuals with unilateral injury of A.C.L. (group 2), standard-deviation (SD), average standard error (ASE), values maximum (Max) and minimum (Min) and number of cases (N) according to
the group.
ILI (milímetros)/ IWI (milimeters)
Grupo/Group 1 Grupo/Group 2 Grupo/Group 1 Grupo/Group 2
D/R D/R E/L E/L
Média / Average 0,2669 0,2879 0,2857 0,2856 DP / SD 6,398 3,834 3,855 4,098 EPM / ASE 1,334 9,585 8,038 1,025 Máx / Max 0,3877 0,3509 0,3423 0,3465 Mín / Min 0,1703 0,2226 0,1926 0,1984
N / N 23 16 23 16
Teste T de Student / Test T of Student p ≤ 0,05; pD=0,209; pE=0,993 FONTE/SOURCE*
Tabela 3 - Valores médios do Índice de Largura do Intercôndilo (I.L.I.) dos joelhos direitos (D) e esquerdos (E) de indivíduos sem lesão (grupo1) e indivíduos com lesão unilateral do L.C.A. (grupo 2), desvio-padrão (DP), erro padrão da média (EPM), valores máximo (Máx) e mínimo (Mín) e número de casos (N) segundo o
grupo.
Table 3 - Average values of Intercondyle Width Index (I.W.I.) of right knees (R) and left (L) of individuals without injury (group1) and individuals with unilateral injury of A.C.L. (group 2), standard-deviation
(SD), average standard error (ASE), values maximum (Max) and minimum (Min) and number of cases (N) according to the group.
B (milímetros) / B (milimeters)
Grupo/Group 1 Grupo/Group 2 Grupo/Group 1 Grupo/Group 2
D/R D/R E/L E/L
Média / Average 25,93 24,99 25,60 24,45 DP / SD 4,568 4,444 3,366 4,139 EPM / ASE 0,952 1,111 0,701 1,034 Máx Max 34,16 34,48 30,97 34,16 Mín / Min 15,01 18,20 17,88 18,04
N / N 23 16 23 16
Teste T de Student / Test T of Student p ≤ 0,05; pD=0,529; pE=0,349 FONTE/SOURCE*
Tabela 4 - Valores médios da largura da base da fossa intercondilar (B) dos joelhos direitos (D) e esquerdos (E) de indivíduos sem lesão (grupo1) e indivíduos com lesão unilateral
do L.C.A. (grupo 2), desvio-padrão (DP), erro padrão da média (EPM), valores máximo (Máx) e mínimo (Mín) e número de casos
(N) segundo o grupo.
Table 4 - Average values of intercondylar notch base width (B) of right knees (R) and left (L) of individuals without injury (group1) and individuals with unilateral injury of A.C.L. (group 2), standard-deviation
(SD), average standard error (ASE), values maximum (Max) and minimum (Min) and number of cases (N) according to the group.
lcl (milímetros) / lcw (milimeters)
Grupo/Group 1 Grupo/Group 2 Grupo/Group 1Grupo/Group 2
D/R D/R E/L E/L
Média / Average 30,06 30,40 29,45 30,50 DP / SD 3,984 3,789 3,380 3,226 EPM / ASE 0,830 0,947 0,704 0,806 Máx / Max 36,08 37,36 36,40 35,76 Mín / Min 23,95 25,07 23,33 25,07
N / N 23 16 23 16
Teste T de Student / Test T of Student p ≤ 0,05; pD=0,795; pE=0,338 FONTE/SOURCE*
Tabela 5 - Valores médios da largura do côndilo femoral lateral (lcl) dos joelhos direitos (D) e esquerdos (E) de indivíduos sem lesão (grupo1) e indivíduos com lesão unilateral do L.C.A. (grupo
2), desvio-padrão (DP), erro padrão da média (EPM), valores máximo (Máx) e mínimo (Mín) e número de casos (N) segundo o
grupo.
Table 5 - Average values of lateral femoral condyle width (lcw) of right knees (R) and left (L) of individuals without injury (group1)
and individuals with unilateral injury of A.C.L. (group 2), standard-deviation (SD), average standard error (ASE), values maximum (Max) and minimum (Min) and number of cases (N)
according to the group.
Tabela 6 - Valores médios da altura da fossa intercondilar (af) dos joelhos direitos (D) e esquerdos (E) de indivíduos sem lesão (grupo1) e indivíduos com lesão unilateral do L.C.A. (grupo 2), desvio-padrão (DP), erro padrão da média (EPM), valores máximo
(Máx) e mínimo (Mín) e número de casos (N) segundo o grupo.
Table 6 - Average values of intercondilar notch height (nh) of right knees (R) and left (L) of individuals without injury (group1) and
individuals with unilateral injury of A.C.L. (group 2), standard-deviation (SD), average standard error (ASE), values maximum (Max)
and minimum (Min) and number of cases (N) according to the group. nh (milimetres)
Af (milímetros) / Nh (milimeters)
Grupo/Group 1 Grupo/Group 2 Grupo/Group 1 Grupo/Group 2
D/R D/R E/L E/L
Média / Average 17,36 16,63 17,25 16,80 DP / SD 1,767 2,165 2,134 2,635 EPM / ASE 0,368 0,541 0,445 0,658 Máx / Max 20,27 20,60 22,03 21,23 Mín / Min 3,41 13,09 11,49 10,74
N / N 23 16 16 16
Teste T de Student / Test T of Student p ≤ 0,05; pD=0,259 ; pE=0,557 FONTE/SOURCE*
DISCUSSÃO
O método mais usual e acessível para mensuração da fossa inter-condilar femoral tem sido a radiografia(9). Estudos adicionais utilizando imagens radiográficas, têm relacionado a morfologia e a morfometria da fossa intercondilar femoral às lesões do L.C.A.(2,9,12,13,14). As radio-grafias podem oferecer informações úteis na detecção de anormali-dades, admitindo-se que o limite de erro será maior e que as medidas não serão tão precisas quanto as medidas obtidas na secção dos múltiplos planos estudados na R.N.M(7).
Optamos pelo uso de um software para a mensuração, objetivan-do uma medição mais confiável, minimizanobjetivan-do prováveis distorções originadas do ato de medir diretamente sobre a película radiográfica
Figura 3 - Imagem radiográfica de uma fossa intercondilar femoral
cônica.
Figure 3 - Radiographic image of conical femoral intercondylar notch.
Figura 4 - Imagem radiográfica de uma fossa intercondilar femoral
circular.
Figure 4 - Radiographic image of circular femoral intercondylar notch.
Figura 5 -Imagem radiográfica de uma fossa intercondilar femoral
retangular.
Figure 5 - Radiographic image of rectangular femoral intercondylar
notch.
Figura 6 - Determinação dos valores percentuais da classificação da fossa intercondilar femoral quanto à forma nos grupos 1
(normal, n=46) e 2 (lesionado, n=32) de acordo com a lateralidade.
Sign Test (Teste do Sinal)
Figure 6 - Determination of percentage values of femoral intercondylar notch classification as to groups 1 (normal, n=46) and
2 (injured, n=32) shapes according to laterality. Sign Test
Figura 7 - Determinação dos valores percentuais de igualdade da forma da fossa intercondilar femoral entre os grupos 1 (normal,
n=46) e 2 (lesionado, n=32) independente da lateralidade. Sign Test (Teste do Sinal).
Figure7 - Determination of percentage values of femoral intercondylar notch equalitty between groups 1 (normal, n=46) and
2 (injured, n=32) laterality independent. Sign Test.
phologic and morphometry to A.C.L. injuries(2,9,12,13,14) The radiogra-phies can offer useful information in abnormalities detection, admiting that the error limit will be bigger and that measurements will not be as precise as those obtained in multiple planes section M.R.I.(7) studies.
com régua milimetrada, método adotado por alguns autores(9,13,14). O tracejamento das linhas referenciais, neste estudo, foi baseado nos métodos propostos por Herzog et al.(7) e Ellera Gomes e Scarton(2) e adaptado para mensuração computadorizada através do software KEYCAD®. Tillman et al.(15) analisaram fotografias digitais da fossa intercondilar femoral, utilizando o software MATLAB 5,2 (MATHWORKS, INC., NATICK, MILIAMPÈRE, EUA) em estudo cadavérico; o traceja-mento das linhas referenciais com o mouse e o esboço do contorno dos côndilos femorais com uma série de pontos (mínimo de 10) é similar ao nosso método.
No entanto, concordamos com Ellera Gomes e Scarton(2), quan-do afirmam que não há um referencial apropriaquan-do, uniformemente aceito na literatura para a mensuração da fossa intercondilar femoral. Neste estudo, durante o exame radiográfico, foi estabelecido um grau de flexão do joelho de 75º, considerando a amplitude do movi-mento de extensão em 0º. A flexão do joelho de 70º a 75º proporciona um maior relaxamento das estruturas articulares, aumentando o espa-ço articular entre a tíbia e o fêmur, fornecendo uma melhor visualiza-ção da fossa intercondilar(8).
A análise comparativa dos dados referentes à largura bicondilar femoral mostrou similaridade entre joelhos normais e lesionados. Nos-sos resultados são discordantes de alguns autores, que descrevem valores superiores para a largura bicondilar em joelhos sem lesão do L.C.A.(5). Nossos achados no grupo 1 são análogos ao valor médio da “largura condilar femoral máxima” encontrado por Herzog et al.(7) (82,00mm) na mensuração radiográfica de fossas intercondilares fe-morais cadavéricas e inferiores aos dados de Mall et al.(11) (84,00mm) na medição direta em cadáveres. Na literatura revisada, a maioria dos autores, entretanto, não correlaciona valores absolutos dessa variável à probabilidade de lesão ligamentar; observa-se o emprego freqüente da largura bicondilar no cálculo do índice de largura do intercôndilo (I.L.I.)(1,13,14,15) e na determinação do sexo(3,11). Estudos sugerem que a largura bicondilar femoral aumentaria desproporcionalmente mais do que a largura da fossa, de acordo com a variação da altura do indivíduo(1,12) e do peso corporal(12). A discrepância entre os dados, portanto, deve-se provavelmente às características morfológicas cons-titucionais da nossa amostra, uma vez que os padrões antropométri-cos variam consideravelmente entre populações diferentes(11).
Nossos resultados não apresentaram diferença estatística signi-ficante para a largura da fossa intercondilar femoral entre os grupos analisados. Os valores médios apresentados por Herzog et al.(7) (23,9mm) em estudo radiográfico e por Anderson et al.(1) (23,7mm) em estudo por R.N.M., equivalem ao nosso resultado no lado esquer-do esquer-do grupo 1. Os valores esquer-do laesquer-do esqueresquer-do de ambos os grupos são análogos, concordando com alguns autores que descrevem valores semelhantes em joelhos normais e em joelhos com lesões agudas do L.C.A.(6,7). Tal similaridade pode ser explicada provavelmente pela amostra limitada deste estudo que não permitiu reconhecer peque-nas diferenças na largura da fossa, ou pela não formação de osteó-fitos como resultado de instabilidade articular nos joelhos lesionados, uma vez que o grupo 2 foi constituído por indivíduos com lesões ligamentares agudas, ou ainda porque não existem diferenças mor-fométricas entre joelhos normais e joelhos com lesões ligamentares agudas. Estudos compararam indivíduos sem lesão e com lesão uni e bilateral do L.C.A. e encontraram estenose da fossa intercondilar femoral nos joelhos com lesão ligamentar bilateral. Segundo os auto-res, pacientes com lesões bilaterais são jovens, apresentam uma relativa estenose da fossa intercondilar femoral na imagem radiográ-fica e a lesão inicial geralmente ocorre sem contato(13). É relevante salientar que o grupo lesionado neste estudo foi constituído por indi-víduos com lesões unilaterais.
study; the drawing of reference lines with a mouse and the femoral condyles contours outlines with a series of points (least of 10) is similar to our method.
However, we agree to Ellera Gomes and Scarton(2) when they affirm that there is not an appropriate reference, uniformly accepted in literature for the measurement of femoral intercondylar notch.
In this study, during the radiographic examination, a 75° knee flex-ion was established, considering a 0° extensflex-ion movement amplitude. The 70° to 75° knee flexion provides a bigger relaxation of joint struc-tures, increasing the joint space between tibia and femur, supplying a better intercondylar notch visualization(8) .
Comparative analysis of femoral bicondylar width referring data showed similarity between normal and injured knees. Our results differ from some authors, who describe superior values for bicondylar width in knees without A.C.L. injury(5). Our group 1 findings are similar to the “maximum femoral condylar width” avarage value found by Herzog et al. (1994)(7) (82,00mm) in radiographic measurements of corpse femo-ral intercondylar notches and with inferior to Mall et al.(11) (84,00mm) data in direct measurement of corpses. In revised literature, the major-ity of the authors, however, do not correlate absolute values of this variable to the ligament injury probability, the frequent use of bicondylar width is observed in the Intercondyle Width Index calculus (I.W.I.)(1,13,14,15) and in sex determination(3,11) . Studies suggest that the femoral bi-condylar width would increase disproportionatily more than the width notch, according with the individual height variation(1,12) . and corporal weight(12) . The discrepancy between data, therefore, is probably due to our constitutional morphologic characteristics sample, since our an-thropometric standards considerably vary between different popula-tions(11).
Our results have not shown difference statistically significant among the femoral intercondylar notch width of analyzed groups.The avarage values presented by Herzog et al.(7) (23,9mm) in radiographic study and by Anderson et al.(1) (23,7mm) in M.R.I.study, are equivalent to our result in the left side of group 1. The values of left side of both groups are kindred, in accordance with some authors which describes similar val-ues in normal knees and knees with acute injuries of A.C.L.(6,7). Such similarity can be probably explained by the limited sample of this study that did not allow to recognize small differences in the width notch, or by osteophites non formation as result of joint instability in injured knees, since group 2 was constituted by individuals with acute ligament injuries, or still because there is no morphometrical differences be-tween normal knees and acute ligament knees injuries. Studies had compared individuals without injury and with A.C.L. uni and bilateral injury and had found estenosis of femoral intercondylar notch in bilater-al ligament knee injury. According to authors, patients with bilaterbilater-al injuries are young, present relative estenosis of femoral intercondylar notch in the radiographic images and the initial injury generally occurs without contact(13). It is important to point out that injuried group in this study was constituted by individuals with unilateral injuries.
According to some authors the estenosis of anterior part of femoral intercondylar notch in A.C.L. knees injury occurs precociously due to formation of ostheophites, probably result of the secondary instability to injury; however, the precise beginning of measurable estenosis could not be determined(4). However, studies state that the prevalence of lesional mechanism without contact suggests that the A.C.L. injury risk is intrinsic for nature and that congenital estenosis of femoral inter-condylar notch can be considered as one of the intrinsic risk factors in the AC.L. injury (5,13,14)
Segundo alguns autores a estenose da região anterior da fossa intercondilar femoral em joelhos com lesão do L.C.A. ocorre precoce-mente devido à formação de osteófitos, provavelprecoce-mente resultado da instabilidade secundária a lesão; todavia, o início preciso da estenose mensurável não poderia ser determinado(4). No entanto, estudos asseveram que a prevalência de mecanismo lesional sem contato sugere que o risco de lesão do L.C.A. é intrínseco por natureza e que a estenose congênita da fossa intercondilar femoral pode ser considerada como um dos fatores intrínsecos de risco na lesão do L.C.A.(5, 13,14)
Concordando com a literatura(6,7,14), observamos valores similares no I.L.I. de ambos os grupos, particularmente no lado esquerdo. O valor médio encontrado nos joelhos do grupo normal é equivalente aos valores encontrados em estudo através de R.N.M.(1,7). O valor médio observado no grupo lesionado é análogo ao descrito em joelhos com L.C.A. deficiente (0,28) em estudo através de R.N.M(7). Nossos valores no grupo normal são similares aos encontrados em homens africanos na mensuração direta em cadáveres(0,26) e não estão de acordo com os dados observados em descendentes europeus (0,24)(15); fato possivelmente explicado pela miscigenação brasileira. A confiabilida-de do I.L.I. como confiabilida-determinante da largura da fossa, entretanto, é controversa. Essa medida é pretendida para eliminar a variação da ampliação ao comparar medidas radiográficas e padronizar pacientes de biótipos morfológicos diferentes(14). Alguns autores, porém, discor-dam deste índice(1,7,12). Para ser uma medida matemática válida do tamanho da fossa, ambas as variáveis deste índice devem variar pro-porcionalmente com a altura dos indivíduos. Entretanto, estudos su-gerem que a largura da fossa não é diretamente proporcional à altura, todavia a largura bicondilar femoral aumenta com o acréscimo da estatura(12).
A análise comparativa da largura da base da fossa intercondilar entre ambos os lados dos grupos 1 e 2 mostrou valores maiores para o grupo normal, concordando com os achados da literatura(2) que relata um estreitamento distal significativo em joelhos instáveis ocorrendo na ordem de 0,0446mm/mês após a lesão. Em estudo cadavérico, auto-res demonstraram que a fossa intercondilar é mais estreita distalmente e mais alargada proximalmente(10), levando a questionar se a base da fossa estenótica não seria um fator de risco mais importante na lesão do L.C.A. do que sua largura ao nível do sulco poplíteo.
Palmerapud Shelbourne e Kerr(12) foi o primeiro a correlacionar as dimensões da fossa intercondilar femoral e a predisposição à lesão do L.C.A. Observou que o L.C.A. possui uma posição constitucionalmen-te vulnerável, sendo reconstitucionalmen-tesado sobre a face inconstitucionalmen-terna do côndilo femoral lateral durante os movimentos rotacionais do joelho, facilitando a rup-tura. Os resultados neste estudo, apesar da não estatisticamente sig-nificantes, evidenciam um côndilo femoral lateral mais largo no grupo com lesão do L.C.A. Nossos valores são compatíveis com os achados de alguns autores na medição direta em peças cadavéricas (29,6mm)(4). Em estudo tomográfico, autores observaram que pacientes com le-sões bilaterais do L.C.A. tinham o côndilo femoral lateral mais largo do que indivíduos sem lesão e concluíram que a largura do côndilo femo-ral latefemo-ral pode interferir na largura da fossa e constituir um fator intrín-seco de risco para lesão daquele ligamento(6). No entanto, o presente estudo não comprova tal hipótese, já que a largura da fossa intercon-dilar femoral não apresentou valor reduzido nos joelhos lesionados em função da maior largura do côndilo femoral lateral. Vale salientar que a amostra foi constituída de indivíduos com lesões unilaterais do L.C.A. Apesar de não estatisticamente significantes, nossos dados de-monstram que a altura da fossa intercondilar do grupo normal foi maior do que nos joelhos do grupo lesionado. Tal achado é compatível com os resultados de alguns autores(7), entretanto, nossos valores são nu-mericamente superiores. A disparidade numérica pode ser explicada
value found in right knees of normal group is equivalent to values found in M.R.I. studies(1,7). The avarage value observed in the injuried group is similar to the one described in disabled A .C.L. knees (0,28) by M.R.I. study(7). Our values from normal group are similar to those found in african men in corpse direct measurement (0,26) and are not in accor-dance with the data observed by some authors for European descen-dant (0,24)(15); that can be explained by the Brazilian miscegenation. The reliability of I.W.I. as determinant of the notch width, however, is controvertible. This measure intends to eliminate the variation of mag-nification when comparing radiographic measures and standardize patients with different morphologic biotypes(14). Some authors, howev-er, disagree with this index(1,7,12). In order to be a valid mathematical measure of notch size, both variable of this index must vary proportion-ally to the individual’s heights. However, some studies suggest that the notch width is not directly proportional to the height, though the femoral bicondylar width increases with the addition of stature(12).
The comparative analysis of the base width of intercondylar notch between both sides of groups 1 and 2 showed higher values for the normal group, in agreement with literature findings(2) which relates a significant distal narrowness in unstable knees occuring in the order of 0,0446mm/month after injury. In corpse study, authors demonstrated that the intercondylar notch is more distally strait and more proximally wide(10), leading to question if the base of stenotic notch would not be a more important risk factor of A.C.L. injury than its width in the level of popliteal groove.
Palmer apud Shelbourn and Kerr(12) was the first to correlate the femoral intercondylar notch proportions and A.C.L. injury prediposition. Observed that A.C.L. gets constitucionally a vulnerable position, being retaining over the lateral femoral condyle internal face during knees rotational movements, facilitating its rupture. Our results at this study, in spite of statistically non significant, show clearly a lateral femoral condyle wider in group with A.C.L. injury Our values are consistent with the ones found by some authors in direct measurement of corpse pieces (29,6mm)(4) .In tomography study, authors observed that patients with bilateral injuries of A.C.L. had the lateral femoral condyle wider than individuals without injury and concluded that the width of lateral femoral condyle can interfere in the notch width and constitute an intrinsic risk factor to the injury of that ligament(6). However, the present study do not prove such hypothesis, since the femoral intercondylar notch width did not show decresead value in injured knees originated from the wider lateral femoral condyle. It is important to say that the sample was filled with unilateral A.C.L. injuries individuals.
In spite of statistically non significant, our data demonstrate that the intercondylar notch height of normal group was higher than the injured knees group. This argument is consistent with the results of some authors(7), however, our values are numerically higher. The numerical disparity can be explained by the ethnic heterogeneity of the population studied sample, characterized by the intense Brazilian miscegenation. In corpse study, the notch height was measured separating the sam-ples by racial groups, the authors have concluded that black people have the intercondylar notch height higher than white people; the rea-son of this morphological variation is an anterior curvature of femoral diaphysis lower in black population. Theoretically, the lower femoral curvature causes an upward rotation of femoral condyles, producing a higher notch(3).
pela heterogeneidade étnica da amostra populacional aqui estudada, caracterizada pela intensa miscigenação brasileira. Em estudo cada-vérico, a altura da fossa foi mensurada separando-se a amostra por grupos raciais, os autores concluíram que negros possuem a altura da fossa intercondilar maior do que brancos; a razão para esta variação morfológica reside numa curvatura anterior da diáfise femoral mais baixa na população negra. Teoricamente, a curvatura femoral mais baixa causa uma rotação ascendente dos côndilos femorais, produ-zindo uma fossa mais elevada(3).
Neste estudo o formato cônico predominou em ambos os grupos, com percentuais mais elevados no grupo normal em ambos os lados. O maior percentual de formato cônico nos joelhos lesionados concor-da com os achados concor-da literatura para joelhos com instabiliconcor-dade ânte-ro-lateral (54,4%)(2). Observamos um percentual discretamente eleva-do eleva-do formato circular nos joelhos eleva-do grupo lesionaeleva-do, independente da lateralidade, em relação aos joelhos do grupo normal quanto aos formatos circular e retangular. No formato circular a largura da base da fossa intercondilar femoral é menor do que seu ápice; é provável que uma base mais estreita atue como fator intrínseco de risco para lesão do L.C.A. A diferença na forma da fossa intercondilar femoral pode parcialmente explicar a probabilidade de lesão do L.C.A.(15) Isto expli-caria um percentual maior de fossas circulares no grupo lesionado em relação ao formato retangular e aos percentuais de formas circulares e retangulares encontrados nos joelhos direito e esquerdo do grupo normal.
Os valores percentuais de igualdade de formato da fossa intercondi-lar femoral, determinados pelo Sign Test, mostram percentuais mais elevados de formatos diferentes das fossas intercondilares dos indivídu-os do grupo lesionado. É provável que tal achado encontre-se relacio-nado à presença de fatores como altura, peso corporal, dominância de um membro em relação a outro, que podem influenciar na predominân-cia da lateralidade nas lesões ligamentares, entretanto não encontra-mos dados na literatura revisada para confrontar tais achados.
CONCLUSÃO
Os resultados apresentados neste estudo não apresentaram dife-renças estatísticas significantes entre joelhos sem lesão ligamentar e joelhos com lesão aguda unilateral do L.C.A. tal achado pode estar relacionado a uma amostra populacional pequena, que não permitiu a observação de diferenças peculiares entre os grupo analisados. En-tretanto não podemos descartar a hipótese de não haver diferença entre joelhos normais e joelhos com lesões ligamentares recentes. A estenose da fossa intercondilar femoral é preconizada como fator de risco para lesão do L.C.A., contudo acreditamos na necessidade de maior investigação a fim de estabelecer a real influência da estenose da fossa intercondilar sobre esse ligamento, se é determinada conge-nitamente ou se ocorre após a lesão do ligamento.
Parece-nos que a largura da base da fossa intercondilar e a largu-ra do côndilo femolargu-ral latelargu-ral seriam fatores de risco mais importantes na lesão do L.C.A. do que a largura da fossa intercondilar ao nível do sulco poplíteo, e que tais variáveis podem influenciar no formato da fossa o que explicaria o comportamento diferenciado dos formatos circulares nos joelhos lesionados. É necessário maior verificação de tal achado a fim de correlacionar a forma da fossa à probabilidade de ruptura do L.C.A.
Quanto ao método de mensuração aplicado, acreditamos que a analogia dos resultados encontrados neste estudo aos descritos na literatura especializada, demonstra que a aplicação de um software sobre as imagens radiográficas digitalizadas pode proporcionar uma mensuração confiável e prática, mesmo utilizando-se de imagens ra-diográficas simples e de baixo custo, o que se enquadraria à realidade da saúde pública brasileira.
circular and rectangular shapes. In circular shape the femoral inter-condylar notch base width is lesser than its apex; it is pobable that a narrower base acts an intrinsic risk factor for A.C.L.injury. The differ-ence of the femoral intercondylar notch shape can partially explain the probability of circular A.C.L. injury(15). This would explain a bigger per-centage of circular notch in the injured group in relation to the rectan-gular shape and the percentages of circular and rectanrectan-gular shapes found in right and left knees of the normal group.
The percentage values of shape equality of femoral intercondylar notch, determined by the Sign Test, show higher percentages of differ-ent shapes of intercondylar notch of injured individuals group. It is probable that such finding is related to presence of factors as height, corporal weight, member dominance in relation to the other one, that can influence in predominance of laterality in ligament injuries, howev-er we do not find data in revised lithowev-erature to oppose such findings.
CONCLUSION
The results presented in this study did not presented significant statistical differences between knees without ligament injury and knees with unilateral acute A.C.L. injury; such finding can be related to a small population sample, that did not allow the observation of peculiar differ-ences between the analyzed group. However we can not discard the hypothesis not to have difference between normal knees and knees with recent ligamentar injuries. Estenosis of femoral intercondylar notch is praised as risk factor for A.C.L. injury, however we believe there is necessity further investigation in order to establish the real influence of intercondylar notch estenosis on this ligament, if it is determined con-genitally or if it occurs after the ligament injury.
It seems to us that theintercondylar base width and lateral femoral condyle width would be more important risk factors in A.C.L. injury than the intercondylar width to popliteal groove level, and that such variable can influence in notch format, what would explain the differentiated behavior of circular shapes in injuried knees. It is necessary higher verification of such finding in order to correlate the notch shape to A.C.L. probability of rupture.
REFERÊNCIAS BIBLIOGRÁFICAS
1. Anderson AF, Dome DC, Gautam S, Awh MH, Rennirt GW. Correlation of anthropo-metric measurements, strength, anterior cruciate ligament size, and intercondylar notch characteristics to sex differences in anterior cruciate ligament tear rates. Am J Sports Med 29:58-66, 2001.
2. Ellera Gomes JL, Scarton A. Planificação radiológica da abertura intercondiliana na reconstrução do ligamento anterior. Rev Bras Ortop 33:651-654, 1998.
3. Gill GW. Racial variation in the proximal and distal femur: heritability and forensic utility. J Forensic Sci 46:791-799, 2001.
4. Good L, Odensten M, Gillquist J. Intercondylar notch measurements with special re-ference to anterior cruciate ligament surgery. Clin Orthop 263:184-189, 1991.
5. Harner CD, Paulos LE, Greenwald AE, Rosenberg TD, Cooley VC. Detailed analysis of patients with bilateral anterior cruciate ligament injuries. Am J Sports Med 22:37-43, 1994.
6. Herzog RJ, Siliman JF, Hutton K, Rodkey WG, Steadman JR. Measurements of the intercondylar notch by plain film radiography and magnetic resonance imaging. Am J Sports Med 22:204-210, 1994.
7. Holmblad EC. Postero-anterior x-ray view of knee in flexion. JAMA 9:1196-1197, 1937.
8. Ireland ML, Ballantyne BT, Little K, McClay IS. A radiographic analysis of the relati-onship between the size and shape of the intercondylar notch and anterior cruciate ligament injury. Knee Surg Sports Traumatol Arthrosc 9:200-205, 2001.
9. Koukoubis TD, Glisson RR, Bolognesi M, Vail TP. Dimensions of the intercondylar notch of the knee. Am J Knee Surg 10:83-87, 1997.
10. Mall G, Graw M, Gehring KD, Hubig M. Determination of sex from femora. Forensic Sci Int 113:315-321, 2000.
11. Palmer I. On the injuries to the ligaments of the knee joint. A clinical study. Acta Chir Scand 81: 1-282, 1938.
12. Shelbourne KD, Kerr B. The relationship of femoral intercondylar notch width to height, weight, and sex in patients with intact anterior cruciate ligaments. Am J Knee Surg 14:92-96, 2001.
13. Souryal TO, Freeman TR. Intercondylar notch size and anterior cruciate ligament injuries in athletes: a prospective study. Am J Sports Med 21:535-539, 1993.
14. Souryal TO, Moore HA, Evans J.P. Bilaterality in anterior cruciate ligament injuries: associated intercondylar notch stenosis. Am J Sports Med 16:449-454, 1988.