SRef-ID: 1684-9981/nhess/2006-6-109 European Geosciences Union
© 2006 Author(s). This work is licensed under a Creative Commons License.
and Earth
System Sciences
Surface latent heat flux and nighttime LF anomalies prior to the
M
w
=8.3 Tokachi-Oki earthquake
G. Cervone1, S. Maekawa2, R. P. Singh1,3, M. Hayakawa2, M. Kafatos1, and A. Shvets4
1Center for Earth Observing and Space Research, School of Computational Sciences, George Mason University, Fairfax, VA 22039, USA
2University of Electro-Communications, 1-5-1 Chofugaoka, Chofu Tokyo 182-8585, Japan 3Department of Civil Engineering, Indian Institute of Technology, Kanpur 208 016, India 4Institute of Radiophysics and Electronics, Kharkov, Ukraine
Received: 19 May 2005 – Revised: 1 December 2005 – Accepted: 13 December 2005 – Published: 26 January 2006
Abstract. Surface Latent Heat Flux (SLHF) is an
atmo-spheric parameter proportional to the evaporation from the Earth’s surface. SLHF has been found to exhibit an anoma-lous behavior in the epicentral region prior to several coastal earthquakes. Sub-ionospheric low frequency (LF) radio sounding measurements have shown its potentiality for the short-term earthquake forecasting since the last decade. The anomalous SLHF and nighttime LF sub-ionospheric signals are found to show complementary nature associated with the large Tokachi-Oki earthquake of 25 September 2003. Such complementary nature of parameters may prove to be poten-tial in providing early warning information about an impend-ing earthquake.
1 Introduction
Significant changes in the Earth, ocean, atmosphere and even ionosphere have been observed prior to earthquakes (Hayakawa et al., 1996; Singh et al., 2001a, b; Tramutoli et al., 2001; Hayakawa and Molchanov, 2002; Dey and Singh, 2003; Bello et al., 2004; Cervone et al., 2004; Hayakawa et al., 2004; Maekawa et al., 2004; Ouzounov and Freund, 2004; Pulinets, 2004; Pulinets and Boyarchuk, 2004; Cer-vone et al., 2005). Hayakawa et al. (2004) have discussed different mechanisms of lithosphere-atmosphere-ionosphere coupling as possible explanation of the observed ionosphere anomalies, and their relation to the earthquake preparatory process. The first mechanism is related to thermal anomaly, which in turns also responsible for enhancement in DC elec-tric field that give rise to the changes in lower ionosphere (Pulinets and Boyarchuk, 2004). The second mechanism is based on the energy transmission in terms of atmospheric
Correspondence to:R. P. Singh
(rpalka425@gmail.com, ramesh@iitk.ac.in)
oscillations (gravity wave) (Molchanov et al., 2001; Shvets et al., 2004). Some promising results have been found to demonstrate anomalous deviations in the VLF phase or/and amplitude (Gokhberg et al., 1989; Hayakawa et al., 1996, 2004; Hayakawa, 1999).
Due to low spatial and temporal resolution of ground ob-servation data, it was not possible to study the complemen-tary nature of different precursory signals. However, with the availability of high resolution global remote sensing data, it has become possible to detect different types of anomalies, and study their complementary behavior. It is now believed that the routine monitoring of such changes can provide early warning information about impending earthquakes.
Changes in temperature at the epicentral have been stud-ied in relation to large seismic events (Qiang, 1997; Tramu-toli et al., 2001; Tronin et al., 2002). Thermal anomalies in the epicentral region prior to an earthquake are caused by the release of gases, movement and fluctuations of water and slow deformation (Glowacka and Nava, 1996). Several IR wavelength observations using MODIS data have shown an increase up to 5 K of the surface temperature in the epi-central region prior to earthquakes (Tramutoli et al., 2001; Ouzounov and Freund, 2004).
Recently, surface latent heat flux (SLHF), a key compo-nent of the Earth’s energy budget, representing the heat flux from the Earth’s surface to the atmosphere has been proposed as a possible precursor of coastal earthquakes. Dey and Singh (2003) and Cervone et al. (2004, 2005) have shown the consistent occurrence of anomalous SLHF peaks a few days prior to the main earthquake events. They have concluded that the routine measurements of SLHF can provide an early warning information of impending coastal earthquakes.
et al., 1996; Parrot, 2002; Valliantos and Tzanis, 2003; Liu et al., 2004; Maekawa and Hayakawa, 2004; Pulinets and Bo-yarchuk, 2004). Seismic zones are considered more conduc-tive due to the high level of fracturing and micro-fracturing along the faults, caused by an increase in porosity and fluid content in the rocks (Madden and Mackie, 1996). The high stress field prior to earthquakes is responsible for surface and subsurface deformation in the epicentral region, which, in turn, is responsible for changes in the electrical and magnetic fields (Madden and Mackie, 1996; Pulinets and Boyarchuk, 2004). This phenomenon is often referred to asdilatancy, since the rocks either dilate or contract, and evidence of this phenomenon is likely to be associated with the large defor-mation that is sometimes observed prior to earthquakes. It is believed that electromagnetic fields associated with the earth-quake preparation process can influence the lower ionosphere (Hayakawa, 2001; Pilipenko et al., 2001; Hayakawa et al., 2004).
In the present paper, we have discussed the retrospective analysis of SLHF and sub-ionospheric LF nighttime data, prior to theMw=8.3 Tokachi-Oki earthquake of 25 Septem-ber 2003. The SLHF and sub-ionosphere LF nighttime anomaly show a complementary nature, and may provide early warning information for coastal earthquakes.
2 SLHF and LF data
The SLHF data used in the present study have been taken from the NCEP/NCAR reanalysis data of the IRI/LDEO Climate Data Library (http://iridl.ldeo.columbia.edu/). The IRI/LDEO Climate Data Library contains over 300 datasets from a variety of Earth science disciplines and climate-related topics. All the datasets are distributed using a com-mon netCDF format in gridded format, and can be down-loaded using a simple and effective HTML based interface.
The NCEP/NCAR Reanalysis Project is a joint project between the National Centers for Environmental Prediction (NCEP) and the National Center for Atmospheric Research (NCAR). The goal of this project is to produce long time series for climate studies using new atmospheric analysis of historical data and current atmospheric data (Climate Data Assimilation System, CDAS). The reanalysis data consist of very long homogeneous time series with nearly global cover-age, although historical data are less reliable because of the lack of satellite observations. The quality of the reanalysis data is high due to the use of state-of-the-art data assimila-tion based on both satellite and ground observaassimila-tions, quality control and modeling algorithms. The disadvantage is in the coarse resolution, which varies from 1.8 to 2.5◦ (
∼200 km)
depending on the parameter. The fluxes used in the oper-ational weather forecast models are incorporated with in-situ observations through the assimilation process. The val-idation and detailed description of the reanalysis of NCEP SLHF data have been discussed by Kalnay et al. (1996, 2000). For the detailed analysis of SLHF, we have taken 5 years of data from 1 January 1999–31 December 2003.
The electromagnetic data has been acquired using a sig-nal transmitted by Japanese Time Standard LF station (JJY, 40 kHz) located at the geographic coordinates (37.37◦N, 140.85◦E) in Fukushima prefecture, and retrieved at two lo-cations; the Moshiri station in Hokkaido, Japan and the sta-tion at Petropavlovsk-Kamchatski, Russia. For receiving and logging of the VLF/LF signals, JAPAL system has been used (Shvets et al., 2004). The vertical electric component was received with a rod antenna installed on the roof of labo-ratory buildings at both locations. The different nature of the diurnal dependencies of the signal at these two receiv-ing stations is connected with both the different orientation of the propagation paths to the terminator and their differ-ent propagation lengths. For the shorter path (JJY-Moshiri), we have observed stronger fluctuations during the nighttime period in comparison with the longer path (JJY-Kamchatski) possibly due to its proximity to the interference minimum as it is found from a comparison of average day-time and night-time levels. It is known that strong disturbances in VLF/LF signals occur during daytime due to additional ion-ization of the lower ionosphere by solar X-ray flares. The increase in the VLF/LF signal amplitudes is related to the increase in conductivity of the upper waveguide wall. Very strong (about 10 times over regular signal level, measured in decibels (db)) positive excursions of the signal amplitude ob-served at Moshiri during the daytime have a shape that is not typical for solar flare effects (fast growth and relatively slow decay), and seems to be unexplained in terms of waveguide propagation theory. It is likely that local disturbance also in-fluence the VLF/LF signals.
3 Results and discussion
The Tokachi earthquake (Mw=8.3) occurred on 25
Septem-ber 2003 near Hokkaido, Japan, with its epicenter located at the geographic coordinates (41.815◦N and 143.910◦E), and with a focal depth of 27 km. The epicenter is located in the same region where the earlier 1952 Tokachi-Oki earthquake
Mw=8.1 occurred (Geist et al., 2003; Hirata et al., 2003).
Figure 1 shows a map of the epicentral region with the plate boundaries and major fault lines, as well as the location of the epicenters of earthquakes that occurred within six months after the main earthquake of 25 September 2003.
Fig. 1.Map of Japan showing the location of the epicenter (star) of
earthquake (Mw=8.3) 25 September 2003. Plate boundaries, faults
and their type are also shown. The grids represent the location for which experiments were performed.
epicentral area are also observed prior and after the earth-quake event in the same time period.
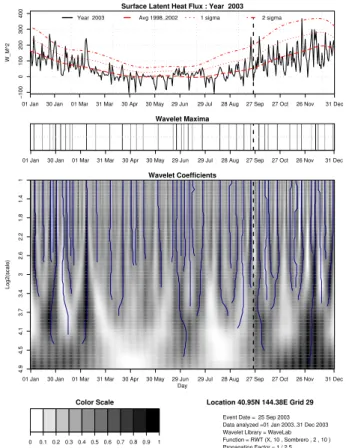
Two strong SLHF anomalies are found at the epicenter, 11 and 3 days prior to the earthquake events, respectively. The SLHF anomalies occurred 11 days prior to the event is found to extend north of the epicenter, while anomaly ob-served 3 days prior to the event extent, south of the epicenter. These anomalies are found over the continental boundary ex-tending for several hundred kilometers. Figure 2 shows the wavelet transformation and the generated maxima curves for the epicentral region of the earthquake. Prominent anoma-lies (more than two sigma) are found 3 days prior and 8 days after the earthquake, are the largest anomalies in the entire year. Figure 3 shows a second wavelet transformation and the generated maxima curves for a region 400 km north of the epicenter, closer to the Kamchatka station.
A prominent SLHF anomaly larger than 4 sigma is ob-served 10 days prior to the earthquake. Wavelet transforma-tions for the adjoining region show similar large anomalies 10 days prior to the earthquake event. Due to the high values of SLHF for this region, the spatial analysis of the continu-ity generates several maxima curves and it is not possible to assert the significance of the signal.
W_M^2
−100
0
100
200
300
400
01 Jan 30 Jan 01 Mar 31 Mar 30 Apr 30 May 29 Jun 29 Jul 28 Aug 27 Sep 27 Oct 26 Nov 31 Dec Year 2003 Avg 1998..2002 1 sigma 2 sigma
Surface Latent Heat Flux : Year 2003
01 Jan 30 Jan 01 Mar 31 Mar 30 Apr 30 May 29 Jun 29 Jul 28 Aug 27 Sep 27 Oct 26 Nov 31 Dec Wavelet Maxima
Log2(scale)
Day
4.9
4.5
4.1
3.7
3.4
3
2.6
2.2
1.8
1.4
1
01 Jan 30 Jan 01 Mar 31 Mar 30 Apr 30 May 29 Jun 29 Jul 28 Aug 27 Sep 27 Oct 26 Nov 31 Dec Wavelet Coefficients
0 0.1 0.2 0.3 0.4 0.5 0.6 0.7 0.8 0.9 1 Color Scale
Event Date = 25 Sep 2003 Data analyzed =01 Jan 2003..31 Dec 2003 Wavelet Library = WaveLab Function = RWT (X, 10 , Sombrero , 2 , 10 ) Propagation Factor = 1 / 2.5 Location 40.95N 144.38E Grid 29
Fig. 2.Wavelet transformation of SLHF data over grid 29 (epicen-tral region).
W_M^2
0
50
100
150
200
01 Jan 30 Jan 01 Mar 31 Mar 30 Apr 30 May 29 Jun 29 Jul 28 Aug 27 Sep 27 Oct 26 Nov 31 Dec Year 2003 Avg 1998..2002 1 sigma 2 sigma
Surface Latent Heat Flux : Year 2003
01 Jan 30 Jan 01 Mar 31 Mar 30 Apr 30 May 29 Jun 29 Jul 28 Aug 27 Sep 27 Oct 26 Nov 31 Dec Wavelet Maxima
Log2(scale)
Day
4.9
4.5
4.1
3.7
3.4
3
2.6
2.2
1.8
1.4
1
01 Jan 30 Jan 01 Mar 31 Mar 30 Apr 30 May 29 Jun 29 Jul 28 Aug 27 Sep 27 Oct 26 Nov 31 Dec Wavelet Coefficients
0 0.1 0.2 0.3 0.4 0.5 0.6 0.7 0.8 0.9 1 Color Scale
Event Date = 25 Sep 2003 Data analyzed =01 Jan 2003..31 Dec 2003 Wavelet Library = WaveLab Function = RWT (X, 10 , Sombrero , 2 , 10 ) Propagation Factor = 1 / 2.5 Location 48.57N 144.38E Grid 61
−100
0
100
200
09Aug03 14Aug03 19Aug03 24Aug03 29Aug03 03Sep03 08Sep03 13Sep03 18Sep03 23Sep03 28Sep03 03Oct03 Day
W_M^2 (a)
SLHF 40.95N 144.38E Grid 29
SLHF 3−day avg Avg 1998..2002 1 sigma 2 sigma
0
2000
6000
10000
14000
09Aug03 14Aug03 19Aug03 24Aug03 29Aug03 03Sep03 08Sep03 13Sep03 18Sep03 23Sep03 28Sep03 03Oct03 Day
Deviation [a,u]
(b)
Hokkaido station
Nighttime Variation 3−day Avg
0
1000
3000
5000
7000
09Aug03 14Aug03 19Aug03 24Aug03 29Aug03 03Sep03 08Sep03 13Sep03 18Sep03 23Sep03 28Sep03 03Oct03 Day
Deviation [a,u]
(c)
Kamchatka station
Nightime Variation 3−day Avg
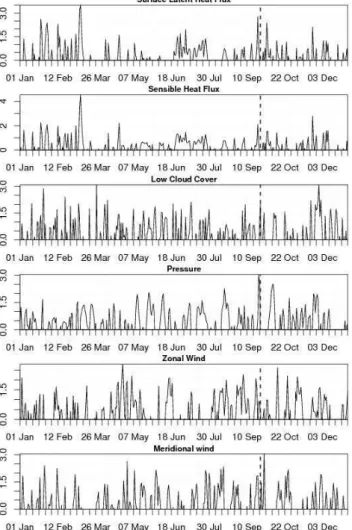
Fig. 4. (a)SLHF (solid line) for the region around 40.95◦N and
144.38◦E, its 3-day average (dot full line), the 5-year average (solid
trend line) with 1 and 2 sigma. The LF signals observed at Moshiri,
Japan (44◦N, 142◦E)(b)and Petropavlovsk-Kamchatski, Russia
(53◦N, 158◦E)(c), with their respective 3-day average for August
to October 2003.
Figure 4 illustrates a comparison of both, SLHF and iono-spheric anomalies associated with this earthquake. The first image shows the SLHF time series for the epicentral region from 9 August to 3 October 2003 over the epicentral region. The three-days average for the same time period (in dot-broken line), the 30-days average computed using the data from 1998 to 2002 (in full line), and the 1 and 2 sigma. The second and third images are generated using the nigh-time LF signals (Shvets et al., 2004). LF signals represent the observed time series from 9 August to 3 October 2003, and the three-day average observed from the Hokkaido (sec-ond panel) and Kamchatski (third panel) station, respectively. Anomalous signals are observed in all three time series prior to and after the earthquake event with very similar temporal evolutions. The SLHF time series show an extended anomaly during the period from 15–23 September, while the LF am-plitude fluctuation at both Moshiri and Kamchatski shows anomalies during the period of 18–22 September. The LF propagation characteristics are known to be influenced by the ionospheric perturbation within a certain Fresnel zone of each great-circle path. Both SLHF anomaly and ionospheric perturbations are expected to be extremely large due to the magnitude of this earthquake. The most important point from Fig. 4 is the common period from 15–23 September,
Fig. 5.Various atmospheric and EM anomalies detected prior to the Tokachi earthquake.
where several complementary anomalies in both the SLHF and ionospheric data are observed. SLHF anomalies are found to exhibit a 2/3 days delay with respect to the iono-spheric anomalies, which is likely due to different speed of SLHF and LF signals.
weather phenomena which might cause the observed anoma-lies. This plot shows that the SLHF is highly sensitive prior to the earthquake event whereas it is difficult to comment about meteorological parameters which are highly variable over the year.
4 Conclusions
This paper presents the first attempt to compare SLHF and ionospheric anomalies observed prior to a major earthquake. The observed anomalies show a complementary behavior both in terms of temporal and spatial distribution. Although it is difficult to say that the SLHF anomaly is the main driv-ing force of the ionospheric perturbations, but it is certain that changes in the lithosphere are likely to be related to the observed ionospheric perturbations. The underlying cou-pling mechanism is not yet well understood, and requires de-tailed further studies. However, the combined use of differ-ent anomalies (as proposed in this paper) could build a much more robust forecasting system from the standpoint of short-term earthquake prediction.
Acknowledgements. This research was partially supported by NASA’s office of Earth Science Enterprise under grant
NAG12-01009, NAG13-02054 and NAG13-03019, VAccess/MAGIC
projects. One of the authors (M.H.) is grateful to NiCT for their support as “R & D promotion scheme funding international joint research”. The authors are grateful to the two reviewers for their comments/suggestions that have helped us to improve the original version of the paper.
Edited by: U. Ulbrich
Reviewed by: N. Kukowski and another referee
References
Bello, G. D., Filizzola, C., Lacava, T., Marchese, F., Pergola, N., Pietrapertosa, C., Piscitelli, S., Scaffidi, I., and Tramutoli, V.: Robust satellite techniques for volcanic and seismic hazards monitoring, Annali di Geofisica, 47, 167–177, 2004.
Cervone, G., Kafatos, M., Napoletani, D., and Singh, R. P.: Wavelet maxima curves of surface latent heat flux associated with two recent Greek earthquakes, Nat. Hazards Earth Syst. Sci., 4, 359– 374, 2004,
SRef-ID: 1684-9981/nhess/2004-4-359.
Cervone, G., Kafatos, M., Singh, R. P., and Yu, C.: Wavelet maxima curves of surface latent heat flux associated with Indian earth-quakes, Nat. Hazards Earth Syst. Sci., 5, 87–99, 2005,
SRef-ID: 1684-9981/nhess/2005-5-87.
Dey, S. and Singh, R. P.: Surface latent heat flux as an earthquake precursor, Nat. Hazards Earth Syst. Sci., 3, 749–755, 2003,
SRef-ID: 1684-9981/nhess/2003-3-749.
Enomoto, Y. and Hashimoto, H.: Anomalous electric signals de-tected before recent earthquakes in Japan near Tsukuba, in: Electromagnetic Phenomena Related to Earthquake Prediction, edited by: Hayakawa, M. and Fujinawa, Y., The University of Electro-Communications, Chofu, Tokyo, Japan, Terra Sci. Pub. Comp., Tokyo, 261–269, 1994.
Fujinawa, Y. and Takahashi, K.: Anomalous VLF subsurface electric field changes preceding earthquakes, in: Electromag-netic Phenomena Related to Earthquake Prediction, edited by: Hayakawa, M. and Fujinawa, Y., The University of Electro-Communications, Chofu, Tokyo, Japan, Terra Sci. Pub. Comp., Tokyo, 131–147, 1994.
Geist, E., Hirata, K., Satake, K., Tanioka, Y., and Yamaki, S.: Rec-onciling source areas determine from aftershock and tsunami
data: TheMw=8.1 1952 Tokachi-Oki earthquake along the Kuril
subduction zone, Seismological Res. Lett., 78, 221, 2003. Glowacka, E. and Nava, F. A.: Major earthquakes in Mexicali
Val-ley, Mexico, and fluid extraction at Cerro Prieto geothermal field, Bulletin of the Seismological Society of America, 86, 93–105, 1996.
Gokhberg, M. B., Gufeld, I. L., Rozhnoy, A., Marenko, V., Yampol-sky, V., and Pono-marev, E.: Study of seismic influence on the ionosphere by super long wave probing of the earth-ionosphere waveguide, Phys. Earth Planet. Inter., 57, 64–67, 1989.
Hayakawa, M.: Atmospheric and Ionospheric Electromagnetic Phe-nomena Associated with Earthquakes, TERRAPUB, Tokyo, p. 996, 1999.
Hayakawa, M.: NASDA’s Earthquake Remote Sensing Frontier Re-search: Seismo-electromagnetic Phenomena in the Lithosphere, Atmosphere and Ionosphere, Final Report, Univ. of Electro-Comms., p. 228, 2001.
Hayakawa, M. and Molchanov, O. A.: Seismo Electromagnet-ics: Lithosphere-Atmosphere-Ionosphere Coupling, TERRA-PUB, Tokyo, p. 477, 2002.
Hayakawa, M., Molchanov, O. A., Ondoh, T., and Kawai, E.: The precursory signature for Kobe earthquake on subionospheric VLF propagation, J. Comm. Res. Lab., 43, 169–180, 1996. Hayakawa, M., Molchanov, O. A., and NASDA/UEC Team:
Achievements of NASDA’s Earthquake Remote Sensing Frontier Project, Terr. Atmos. Oceanic Sci., 15, 311–328, 2004.
Hirata, K., Geist, E., Satake, K., Tanioka, Y., and Yamaki, S.: Slip
distribution of the 1952 Tokachi-Oki earthquake (Mw=8.1) along
the kuril trench deduced from tsunami waveform inversion, J. Geophys. Res., 108, 6–15, 2003.
Kalnay, E., Kanamitsu, M., Kistler, R., Collins, W., Deaven, D., Gandin, L., Iredell, M., Saha, S., White, G., Woollen, J., Zhu, Y., Chelliah, M., Ebisuzaki, W., Higgins, W., Janowiak, J., Mo, K. C., Ropelewski, C., Wang, J., Leetmaa, A., Reynolds, R., Jenne, R., and Joseph, D.: The NCEP/NCAR 40-year reanalysis project, Bulletin American Meteorological Society, 77, 437–471, 1996.
Kalnay, E., Kanamitsu, M., Kistler, R., Collins, W., Deaven, D., Gandin, L., Iredell, M., Saha, S., White, G., Woollen, J., Zhu, Y., Chelliah, M., Ebisuzaki, W., Higgins, W., Janowiak, J., Mo, K. C., Ropelewski, C., Wang, J., Leetmaa, A., Reynolds, R., Jenne, R., and Joseph, D.: The NCEP/NCAR 50-year reanalysis project, Bulletin American Meteorological Society, 77, 437–471, 2000.
Liu, J., Chuo, Y., Shan, S., Tsai, Y., Chen, Y., Pulinets, S., and Yu, S.: Pre-earthquake ionospheric anomalies registered by contin-uous GPS TEC measurements, Ann. Geophys., 2, 1585–1593, 2004.
Madden, T. and Mackie, R.: What electrical measurements can say about changes in fault systems, Proceedings of the National Academy of Sciences, 93, 3776–3780, 1996.
Kamchatka (Russia), Geophys. Res. Abstr., 6, 2004.
Molchanov, O. A., Hayakawa, M., and Miyaki, K.: VLF/LF sound-ing of the lower ionosphere to study the role of atmospheric oscil-lations in the lithosphere-ionosphere coupling, Adv. Polar Upper Atmos. Res., 15, 146–158, 2001.
Ouzounov, D. and Freund, F.: Mid-infrared emission prior to strong earthquakes analyzed by remote sensing data, Adv. Space Res., 33, 268–273, 2004.
Parrot, M.: The micro-satelitte DEMETER, J. Geodyn., 33, 535– 541, 2002.
Pilipenko, V. S., Shalimov, S., Uyeda, H., and Tanaka, H.: Possi-ble mechanism of the over-horizon reception of FM radio waves during earthquake preparation period, Proc. Japan Academy, 77, 125–130, 2001.
Pulinets, S. A. and Boyarchuk, K. A.: Ionospheric Precursors of Earthquakes, Springer Verlag, Berlin, 2004.
Qiang, Z.: Thermal infrared anomoly precursor of impending earth-quakes, Pure and Applied Geophysics, 149, 159–170, 1997. Shebalin, P., Keilis-Borok, V., Zaliapin, I., Uyeda, S., Nagao, T.,
and Tsybin, N.: Advance short-term prediction of the large
Tokachi-Oki earthquake, 25 September 2003,m=8.1 a case
his-tory, Earth Planets Space, 56, 715–724, 2004.
Shvets, A. V., Hayakawa, M., and Maekawa, S.: Results of
subionospheric radio LF monitoring prior to the Tokachi (m=8,
Hokkaido, 25 September 2003) earthquake, Nat. Hazards Earth Syst. Sci., 4, 647–653, 2004,
SRef-ID: 1684-9981/nhess/2004-4-647.
Singh, R. P., Bhoi, S., Sahoo, A. K., Raj, U., and Ravindran, S.: Surface manifestations after the Gujarat earthquake, Current Sci-ence, 81, 164–166, 2001a.
Singh, R. P., Sahoo, A. K., Bhoi, S., Kumar, M. G., and Bhuiyan, C. S.: Ground deformation of the Gujarat earthquake of 26 Jan-uary 2001, Journal Geological Society of India, 58, 209–214, 2001b.
Tramutoli, V., Bello, G. D., Pergola, N., and Piscitelli, S.: Robust satellite techniques for remote sensing of seismically active ar-eas, Annali di Geofisica, 44, 295–312, 2001.
Tronin, A., Hayakawa, M., and Molchanov, O.: Thermal IR satellite data application for earthquake research in Japan and China, J. Geodyn., 33, 519–534, 2002.
Vallianatos, F. and Tzanis, A.: On the nature, scaling and spectral properties of pre-seismic ULF signals, Nat. Hazards Earth Syst. Sci., 3, 237–242, 2003,