© Author(s) 2010. This work is distributed under the Creative Commons Attribution 3.0 License.
Chemistry
and Physics
MAX-DOAS measurements in southern China: retrieval of aerosol
extinctions and validation using ground-based in-situ data
X. Li1,2, T. Brauers2, M. Shao1, R. M. Garland3, T. Wagner4, T. Deutschmann5, and A. Wahner2 1College of Environmental Sciences and Engineering, Peking University, Beijing, China
2Institute for Chemistry and Dynamics of the Geosphere (ICG-2), Forschungszentrum J¨ulich, Germany 3Biogeochemistry Department, Max Planck Institute for Chemistry, Mainz, Germany
4Satellite Group, Max Planck Institute for Chemistry, Mainz, Germany
5Institute for Environmental Physics, Universit¨at Heidelberg, Heidelberg, Germany Received: 25 July 2008 – Published in Atmos. Chem. Phys. Discuss.: 29 September 2008 Revised: 12 January 2010 – Accepted: 8 February 2010 – Published: 1 March 2010
Abstract. We performed MAX-DOAS measurements dur-ing the PRiDe-PRD2006 campaign in the Pearl River Delta region 50 km north of Guangzhou, China, for 4 weeks in June 2006. We used an instrument sampling at 7 different eleva-tion angles between 3◦and 90◦. During 9 cloud-free days, differential slant column densities (DSCDs) of O4(O2dimer) absorptions between 351 nm and 389 nm were evaluated for 6 elevation angles. Here, we show that radiative transfer modeling of the DSCDS can be used to retrieve the aerosol extinction and the height of the boundary layer. A compar-ison of the aerosol extinction with simultaneously recorded, ground based nephelometer data shows excellent agreement.
1 Introduction
Differential Optical Absorption Spectroscopy (DOAS) is a powerful technique for the measurement of (see Platt and Stutz, 2008, and references therein). Multi-AXis Dif-ferential Optical Absorption Spectroscopy (MAX-DOAS) is a relatively new technique, which was recently devel-oped (H¨onninger et al., 2004) and was first used to re-trieve bromine oxide in the troposphere (H¨onninger and Platt, 2002). The MAX-DOAS technique was successfully used by different groups in order to measure NO2(e.g. Leigh et al., 2007; Pikelnaya et al., 2007), HCHO (e.g. Inomata et al., 2008), CHOCHO (e.g. Sinreich et al., 2007), and other uv or vis light absorbing molecules. Moreover, Wagner et al. (2004) developed a technique to use the O4 absorption to
Correspondence to: T. Brauers
retrieve aerosol extinctions (cf. Wittrock et al., 2004; Friess et al., 2006; Irie et al., 2008; Lee et al., 2009).
The general idea of MAX-DOAS is to record spectra of scattered sunlight at different elevation angles,α(i.e. the an-gle between the viewing direction of the telescope and the horizontal direction). For an individual measurement at el-evation angleα, the measured optical density refers to the slant column density (SCD), which is the concentrationC(s) of a species integrated along the pathss where the photons traveled
SCDα=
Z
C(s)ds=1 σlog
I
0 Iα
(1) Here σ is the absorption cross section, I0 is the reference spectrum, andIα is the measured spectrum. Since the SCD strongly depends on the observation geometry and meteo-rological conditions, it is usually converted to vertical col-umn density (VCD). The conversion from SCD to VCD is achieved by the air mass factor (AMF), i.e. the averaged light path enhancement for solar light traveling through the at-mosphere compared to a straight vertical path (cf. Platt and Stutz, 2008).
For measurements focusing on the species in the tro-posphere, differential slant column densities (DSCDs) are widely used (e.g. Irie et al., 2008; Pikelnaya et al., 2007). The DSCD is the difference between the SCDs at α6=90◦
andα=90◦.
DSCDα=SCDα−SCD90◦= 1 σlog
I
90◦ Iα
stratosphere are nearly identical. Thus, the contribution of trace gas absorption in the stratosphere nearly vanishes.
MAX-DOAS instruments can be very simple and easy to operate. They require a (small) telescope that can be directed to several directions in the sky, including the zenith. The sec-ond component is a spectrograph with a typical DOAS reso-lution of 0.1 nm to 1 nm. However, despite the simplicity of the experimental setup, the evaluation of MAX-DOAS mea-surements from measured spectra to aerosol and trace gas concentrations or profiles is a demanding task. This evalua-tion requires the use of radiative transfer modeling (RTM) especially for conditions when aerosol loads are high and multiple scattering occurs.
RTMs calculate the photon flux at a certain location (lon-gitude, latitude, altitude) in the atmosphere depending on viewing direction, the solar position (zenith and azimuth angle) and a number of parameters describing absorption and scattering of photons on their way through the atmo-sphere. Besides clouds, the major influence on the photon paths has the distribution of aerosol in the troposphere es-pecially in polluted areas. In this study we concentrate on the effect of aerosols and investigate only measurements un-der mostly cloud free conditions. Over the last years, differ-ent radiative transfer models have been developed (see Wag-ner et al., 2007, and references therein). We used McAr-tim (Deutschmann, 2009), which is a backward Monte-Carlo model.
RTMs were reviewed by Hendrick et al. (2006) and Wag-ner et al. (2007). Different RTMs differ in the way of simu-lating photon transverse process in the atmosphere, the treat-ment of the Earth’s sphericity, the way of considering aerosol scattering, the inclusion of the photo-enhancement of short lifetime species, etc. Intercomparison activities demonstrate an agreement within 10% of simulated SCD and AMF of species like NO2and HCHO (Hendrick et al., 2006; Wagner et al., 2007). McArtim was compared intensively to Tracy-II, one of the participants in the comparison by Wagner et al. (2007) and was found to agree excellently (Deutschmann, 2009). The advantage of McArtim over Tracy-II is the im-proved computational speed and the increased number of output parameters.
The concept of aerosol retrieval from the oxygen dimer absorption was introduced by Wagner et al. (2004). The O4 concentration is proportional to the square of O2 concentra-tion, and it mainly depends on the temperature and pressure profile. Since most of the O4 resides in the lower part of the troposphere, the O4DSCD is sensitive to changes in the photon paths, mainly at low altitudes. Aerosol particles lead to a variation of photon paths and thus a variation in the O4DSCDs. Therefore, the O4DSCD can be used as an indi-cator of the aerosol load in the atmosphere. For conditions of low aerosol load or the existence of clouds, the probability of multiple scattering increases, which will lead to the simulta-neous increase of the O4DSCDs at all elevation angles. Un-der conditions of high aerosol load, the distance from which
photons can reach the telescope will strongly decrease due to the high aerosol extinction. This will cause a strong reduc-tion of O4DSCDs especially those measured at low elevation angles. The high aerosol extinction also shortens the pene-tration depth of the incident sunlight, which is reflected by the decrease of the amplitude of O4DSCDs diurnal varia-tion. A detailed sensitivity study on various parameters was performed by Wagner et al. (2004).
In this paper we use the oxygen dimer absorptions in the near uv to explore the aerosol layer at a semi-urban location in southern China. We have developed an automated method to retrieve the aerosol extinction and the height of the bound-ary layer from the measured O4DSCDs. The determination of the aerosol extinction was compared to ground-based, in-situ measurements by a nephelometer. In a forthcoming pa-per we will explore the trace gas absorptions.
2 Experimental
2.1 The MAX-DOAS instrument
The instrument is a Mini-MAX-DOAS (Fa. Hoffmann, Rauenberg, Germany). It containes a miniature crossed Czerny-Tuner spectrometer unit USB2000 (Ocean Optics Inc.) with a spectral resolution of≈0.7 nm full width at half maximum (FWHM). The spectral range of 292 nm to 443 nm is mapped onto a one-dimensional CCD-detector with 2048 pixels. The spectrometer unit was cooled to a stable temper-ature of +19◦C in order to minimize changes in optical prop-erties of the spectrometer and to reduce detector dark current. The scattered sunlight was collected and focused by a quartz lens and was led into the spectrometer unit by a quartz fibre bundle. A stepper motor enabled the adjustment of the view-ing direction to a desired elevation angle. All functions were controlled by a laptop via USB connection.
The instrument was operated by a fully automated mea-surement program (MiniMax, Udo Friess, University of Hei-delberg). The program employed routines to adapt the in-tegration time of the measurements to the light conditions in order to achieve a constant signal level (i.e. 80% of the saturation of the CCD-detector), to store the spectra and to control the movements of the telescope. The instrument slit function was determined by measuring the emission line of a mercury lamp at 334 nm. Scattered sunlight spectra were acquired sequentially at elevation angles of 90◦(i.e. zenith),
30◦, 20◦, 15◦, 10◦, 5◦, and 3◦. One measurement cycle took
10 min to 15 min. The dark current and offset spectra were recorded every night.
2.2 The DOAS analysis
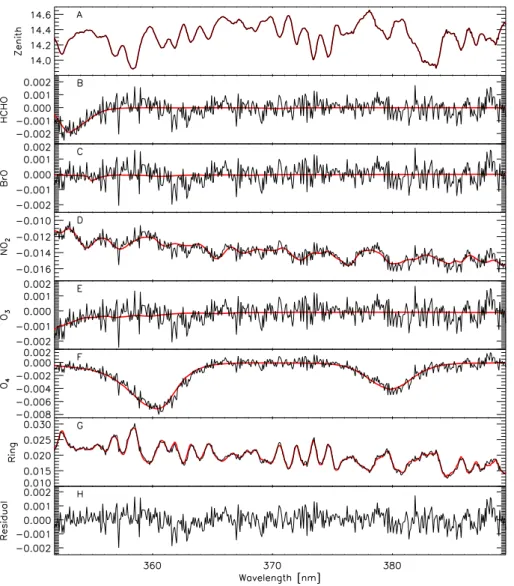
Fig. 1. Evaluation of a single spectrum (α=3◦) recorded in the wavelength range 352 nm to 390 nm used for the O4determination on 19 July 2006 at 10:59. (A) Overlay of spectrum at 3◦with fitted zenith spectrum. (B), (C), (D), (E), (F) Fitted HCHO, BrO, NO2, O3, and O4reference spectrum overlayed to the residual including the absorption.
1962), a third order polynomial and a second order offset polynomial were fitted together to the logarithm of the mea-sured spectrum, which was already corrected for dark current and offset. During the fit, the measurement spectrum was al-lowed to shift and squeeze with respect to the FRS, the Ring spectrum and the absorption cross sections. The fitting pro-cedure was conducted using the script mode of the DOASIS software (Kraus and Geyer, 2001).
Figure 1 illustrates one example of the DOAS fit recorded on 19 July 2006 at 10:59 at a solar zenith angle of 23◦and an elevation angle of 3◦. For each measurement cycle, the corre-sponding zenith spectrum (α=90◦) was taken as FRS for the spectra at off-axis elevation angles. This largely eliminates the stratospheric contributions to the DSCDs. However, the O4DSCD is only marginally affected by stratospheric ab-sorptions since O4 mainly resides in the troposphere. The
Ring spectrum was calculated from each measured spectrum (Bussemer, 1993). For the fit of the absorbing trace gases, we used high resolution absorption cross sections which were convolved by the instrument slit function to match the resolu-tion of the instrument (except for the O4spectrum, which was interpolated). These references include HCHO (Meller and Moortgat, 2000), BrO (Wilmouth et al., 1999), NO2(Voigt et al., 2002), O3at 280 K (Voigt et al., 2001), and O4 (Green-blatt et al., 1990) with manual adjustments of the wavelength axis (R. Sinreich, personal communication).
spectrum (Kurucz et al., 1984), convoluted with the instru-ment’s slit function.
2.3 Setup of the instruments at the Guangzhou Back-garden supersite
The MAX-DOAS observations were performed in the frame-work of the “Program of Regional Integrated Experiments of Air Quality over the Pearl River Delta” (PRIDE-PRD2006; Hofzumahaus et al., 2009; Zhang et al., 2010). The intensive campaign took place from 3 July 2006 to 31 July 2006 in the Pearl River delta area in southern China. Our measurements were conducted in Backgarden (BG) supersite (23.50◦N, 113.03◦E). The Mini-MAX-DOAS device was installed on
the top of a 10 m high hotel building, pointing to the east. The measurements were accompanied by a comprehensive suite of atmospheric measurements. In this study we used the data of a nephelometer and a photoacoustic spectrometer, which are described in a separate paper (Garland et al., 2008) and therefore only a brief description follows.
The total aerosol particle scattering coefficients and hemi-spheric backscattering coefficients at three different wave-lengths (λ=450 nm, 550 nm, and 700 nm) were measured with an integrating nephelometer (Model 3563, TSI). The aerosol particle absorption coefficient at 532 nm was deter-mined with a photoacoustic spectrometer (PAS; Desert Re-search Institute), which provides highly sensitive absorp-tion measurements without interference by scattering signals (Arnott et al., 1999). The optical data were averaged for two minutes. The main aerosol inlet used for both instruments in this study was equipped with a PM10 inlet and a diffu-sion dryer with silica gel/molecular sieve cartridges (average sampling relative humidity 33%). The uncertainty (accuracy and precision) of the nephelometer and the PAS data are less than±10% (Garland et al., 2008).
3 Radiative transfer modelling and the retrieval of the aerosol extinction
The modeling of the O4DSCDs was performed by a back-ward Monte-Carlo approach with the treatment of multi-ple scattering in a fully spherical geometry, i.e. McArtim (Deutschmann, 2009). In this model, a photon emerges from a detector in an arbitrary line of sight direction and is tracked along the path in backward direction until the photon leaves the top of the atmosphere or is absorbed. The various events which may happen to the photon at various altitudes are de-fined by suitable probability distributions. Random numbers decide on the occurrence of events. At each scatter event a weight is calculated from the product of two terms. The first factor is the probability that the sunlight reaches the scatter event, the second is the phase function of the scatter event evaluated at the angle between the Sun direction and the di-rection of the sampled trajectory from the scatter event to the
detector. For each trajectory an estimate of the normalized sun radiance is obtained by adding the weights of all scatter orders. A large number of random photon paths are gener-ated, thus reproducing the light contributing to the simulated measurement.
The McArtim model requires a number of input param-eters like altitude, solar zenith and azimuth angles, pres-sure, temperature, concentration of absorbing trace gases, and aerosol optical parameters for each layer in the atmo-sphere. The layers can be prescribed by the users. In the model runs we calculated the O4 altitude profile from the square of the O2profile of the US standard atmosphere. We also used the temperature, pressure, and trace gas profiles from the US standard atmosphere. However, these parame-ters are of minor importance for the O4 columns evaluated here. The major influence comes from the aerosol optical parameters and the aerosol altitude profile.
For the aerosol optical properties, we selected a constant single scattering albedo (SSA) and a constant asymmetry pa-rameter (g, under the Henyey-Greenstein approximation) of 0.85 and 0.68, respectively. These were deduced from the nephelometer and PAS measurements and they refer to the average in the time frame between 06:00 and 19:00 (local time) for all days. We also set the surface albedo constant to 7%, a value also used by Irie et al. (2008). The sensi-tivity on the albedo is small: doubling the albedo changes the modeled O4DSCDs by less than 5%. The sensitivities on the single scattering albedo and the asymmetry parameter are larger: 10% changes in SSA andgmodify the modeled O4DSCDs by 10% and 17%, respectively. We used 0.3◦for the field of view of the telescope which influence is small. Even at±0.1◦the results change by less than 1%.
For the aerosol profile, we assumed two layers, i.e. the at-mospheric boundary layer and the free troposphere, which can be described with a limited set of parameters. Since our measurements were conducted at six independent values of the elevation angle only, it is required that the profiles are parameterized with less than six parameters. Over source re-gions, it is assumed that the well mixed boundary layer fills with particles, which are emitted or photochemically formed, while in the layer aloft the aerosol content quickly decreases with height. Observations in Asia (e.g. Sasano, 1996; Ans-mann et al., 2005; Chiang et al., 2007) obtained these kinds of profiles.
Thus, the extinction profileE(z)was taken as two layers in the range from 0 km to 15 km
E(z)=
τ·F /H z≤H
β·exp(−z/ξ ) z > H (3)
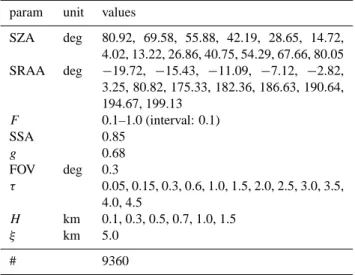
Table 1. Parameters for Lookup table (LUT) generation. SZA: solar zenith angle. SRAA: solar relative azimuth angle.F: fraction of the total extinction residing in the boundary layer. SSA: single scattering albedo. g: asymmetry parameter. FOV: field of view of the telescope.τ: aerosol optical depth (see Eq. 3).H: height of the boundary layer. ξ: scaling height of aerosol extinction in the free troposphere. #: number of McArtim runs for the setup of the LUT.
param unit values
SZA deg 80.92, 69.58, 55.88, 42.19, 28.65, 14.72, 4.02, 13.22, 26.86, 40.75, 54.29, 67.66, 80.05 SRAA deg −19.72, −15.43, −11.09, −7.12, −2.82, 3.25, 80.82, 175.33, 182.36, 186.63, 190.64, 194.67, 199.13
F 0.1–1.0 (interval: 0.1)
SSA 0.85
g 0.68
FOV deg 0.3
τ 0.05, 0.15, 0.3, 0.6, 1.0, 1.5, 2.0, 2.5, 3.0, 3.5, 4.0, 4.5
H km 0.1, 0.3, 0.5, 0.7, 1.0, 1.5 ξ km 5.0
# 9360
height for the aerosol in the free troposphere. For the lat-ter we used a constant value of 5 km. The results presented here are not sensitive toξsince most of the aerosol extinction resides in the boundary layer. In order forτ being the inte-grated optical depth,E(z)must obey the boundary condition
Z 15km
0km
E(z)dz=τ (4)
which leads to a conditional equation forβ. β= (1−F )·τ
ξ·(e−H /ξ−e−15km/ξ) (5) We also introduce the extinction at ground level E0=τ· F /H that can be compared to local, ground based measure-ments.
With this input, the McArtim program calculates the set of O4DSCD for the six elevation angles Rα within 15 min on a typical state-of-the-art PC when 200 000 photon paths are simulated atλ=360 nm, i.e. the wavelength of the major O4absorption. In order to optimize the input parameters of McArtim (τ,F, andH) we minimize
χ2(τ,F,H )=
30◦
X
α=3◦
M
α−Rα(τ,F,H ) σ (Mα)
2
(6)
whereRα indicates the modeled data andMα the measured data. The weighing is done by the statistical error of the mea-sured data,σ (Mα). The iterativeχ2minimization requires several hours to days for a single data point when the RTM is
Fig. 2. Range of solar zenith angles and azimuth angles during the entire campaign. The blue symbols refer to the values of each single recorded spectrum, the red refer to the values used in the RTM calculation (see Table 1).
called in every iterative step. We therefore created a look-up table (LUT) that is used as input for the fitting procedure.
The LUT was based on a set of solar zenith angles, SZA, and relative azimuth angles, SRAA (see Table 1). These were not selected independently, since during the 4 week period they cover only a small band within the range of the possible values (Fig. 2). We also used single values for scattering albedo (SSA), asymmetry parameter (g), surface albedo, and scaling height (ξ) for the entire campaign. The range of the three free parameters were chosen to cover a wide range of possible situations in the LUTs for subsequent fitting. The number of required McArtim runs was 9360 corresponding to approximately 100 days of CPU time. However, this could be distributed to≈30 PCs during off-time hours.
The LUT provides O4DSCDs,Lα, as a function of the el-evation angleα(3◦, 5◦, 10◦, 15◦, 20◦, and 30◦) and of the pa-rametersτ,F, andH. For one measured cycle of O4DSCDs, Mα, we fitted the linearly interpolated valuesLα(τ,F,H )of the LUT (as a approximation for theRα(τ,F,H )in Eq. 6). In order to reduce the atmospheric variations as well as mea-surement noise of a single observation, the profile retrieval was applied to measured O4DSCDs averaged over one hour. The minimization procedure was conducted automatically using the Levenberg-Marquardt algorithm (mpfit1, realized in IDL). The errors of the retrieved parameters were derived from the fitting procedure.
4 Results and discussion
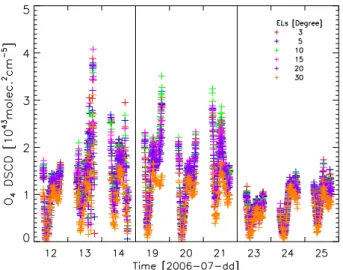
Fig. 3. Differential slant column densities of O4measured on cloud free days during the PRiDe PRD2006 campaign. Low values on 23–25 July 2006 refer to high aerosol loads close to the surface.
were characterized by clouds, we selected 9 virtually cloud-free days for this study on aerosols (Fig. 3). We see the influence of the elevation angle, the diurnal variation of the O4DSCD with the solar zenith angle and the effect of aerosols. Wagner et al. (2004) showed that aerosol par-ticles close to the surface would reduce the difference of O4DSCDs between the different elevation angles as well as the magnitude of the O4DSCDs, providing a qualitative way to identify high aerosol load conditions. For example, the strong decrease of O4DSCDs in the last 3 days reflects the increase of aerosol load, also observed by in-situ measure-ments.
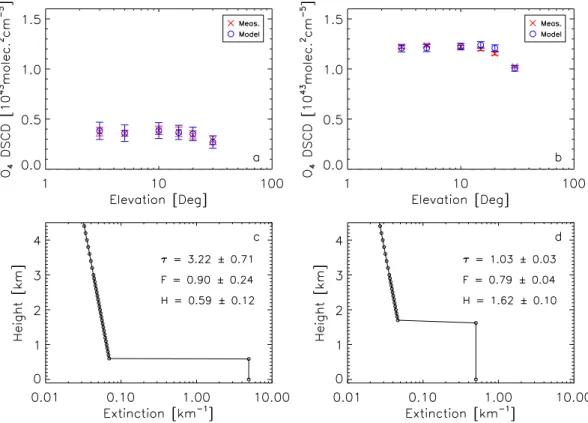
Figure 4 demonstrates two examples of the aerosol re-trieval on 24 July 2006. The left column (Fig. 4a, c) shows the result for the time interval from 07:00–08:00. The best fit is reached whenτ,F, andHare 3.22, 0.90, and 0.59 km, respectively. The right column (Fig. 4b, d) corresponds to 15:00–16:00 and a best fit atτ, F, andH are 1.03, 0.79, and 1.62 km, respectively. Based onτ,F, andH (their sta-tistical 1-σ errors are given in Fig. 4c, d) we can calculated the aerosol extinction at the ground (E0) as 4.91±1.96 km−1 and 0.50±0.04 km−1 for the two cases. Firstly, when the aerosol load is high and aerosols are concentrated in a shal-low layer near the ground, the O4DSCDs at all elevation an-gles will decrease. The two times lower values of O4DSCDs in Fig. 4a compared to those in Fig. 4b reflects the differ-ence of the aerosol distribution between the two time inter-vals. Secondly, as far as the error ofE0 is concerned, the larger error reflects the high aerosol extinction nearby, which leads to the low intensity of light received by the instrument and thus the large measurement error since the S/N ratio is reduced. Consequently, a larger error ofE0 can always be expected for early morning hours when the aerosol load was
high. The O4DSCDs is dominated by the aerosol distribu-tion near the ground-based instrument; the contribudistribu-tion from aerosols in upper layers is of minor importance. These re-sults demonstrate the existence of high aerosol extinction in the layer near the ground.
In the retrieval processes, the aerosols in the lowest layer (i.e. 0–H) are assumed to be distributed homogeneously (see Eq. 3). Therefore, the retrieved aerosol extinction in this layerE0 can be compared to the simultaneous in-situ, ground-based nephelometer measurements. The nephelome-ter detects the aerosol total scatnephelome-tering (TS) which is the major part of the extinction of ambient aerosols in most cases. The total aerosol scattering at the O4absorption at the wavelength of the MAX-DOAS measurment is calculated by extrapola-tion. A second order polynomial was fitted to the measured total aerosol scattering at three different wavelengths and ex-trapolated to 360 nm (Eck et al., 1999). The comparison of E0againstTSwill help us to validate the retrieval under the assumption of constant aerosol in the lowest layer.
Figure 5 illustrates the time series of the converted neph-elometer readingTSandE0derived from the MAX-DOAS. The absolute values as well as the diurnal variations of aerosol extinction are very similar. Large differences be-tweenTSandE0mainly occur during morning hours. These can be attributed to several reasons:
– The nephelometer only records the scattered light from the aerosol, which is the larger part of the light loss in most cases. However, the simultaneous in-situ photoa-coustic spectrometer measurements demonstrated that aerosol absorption during morning hours was high dur-ing most of the days.
– An overestimation of the SSA will cause an overesti-mation of aerosol extinction by MAX-DOAS O4 obser-vations. The SSA been used for the RTM was a con-stant value of 0.85. However, the measured SSA during the period when the discrepancies existed was usually lower than 0.85. Sensitivity tests showed that the de-crease of SSA by 5 % will lead to a dede-crease of mod-eled O4DSCDs by≈5%. In order to achieve the best fit between modeled and measured O4DSCDs, the re-trieval procedure will increase the aerosol extinction to compensate for the higher value of SSA.
– The MAX-DOAS instrument was scanning towards east direction, thus more forward scattering is relevant for the measurements during sunrise. In order to access this effect we looked at the sensitivity on SSA andgin the morning and at noon. In the early morning (06:30), the sensitivities (δ(DSCD)/DSCD)/(δ(SSA)/SSA) and (δ(DSCD)/DSCD)/(δ(g)/g) are 2 and 3, respectively, compared to 1 and 1.5 around noon.
Fig. 4. Two examples for the retrieval of the aerosol extinction with different aerosol loads. Upper row: comparison of measured and modeled O4DSCDs. Lower row: retrieved profiles. The parameters indicate the optimized estimators and their 1-σ fitting errors. Left: 24 July 2006, 07:00–08:00, SZA=70◦. Right: 24 July 2006, 15:00–16:00, SZA=41◦.
MAX-DOAS and nephelometer. However, we selected the virtually cloud free days. In addition the high aerosol load reduced the visibility. Therefore, the sam-pling area of the MAX-DOAS was small and most likely not influenced by isolated local sources.
– The largest influence on the comparison between E0 andTS, however, may be the influence of humidity, e.g. the existence of fog in morning hours. The aerosol sam-pled by the nephelometer were first dried to≈35% rel-ative humidity. Therefore, the nephelometer is insen-sitive to changes in ambient relative humidity and the resulting impacts on the aerosol scattering. This is cer-tainly not the case for MAX-DOAS observations, which were performed outside at ambient humidities between 55% and 99%. The higher values occurred in the morn-ing hours. On the one side, the asymmetry parameter gand the single scattering albedo SSA of fog particles can be different from the values selected for the RTM calculation. On the other side, the aerosol growth with humidity. We corrected the aerosol scatteringTS using an empirical hygroscopic growth factorF based on the relative humidityrh.
TS(corr)=TS×F (rh)=TS×(1+a (rh)b) (7)
Here, the empirical factors were set to a=2.06 and b=3.6 as described by Liu et al. (2008) for urban aerosols. Their measurements were performed at the same time (July 2006) at a downtown Guangzhou lo-cation about 60 km south east from our site. The cor-rected data are also presented in Fig. 5. The agreement is strongly improved, e.g. on 23 and 24 July where the values ofTSare increased by a factor of 2 by the correc-tion. After the correction an almost perfect agreement is reached.
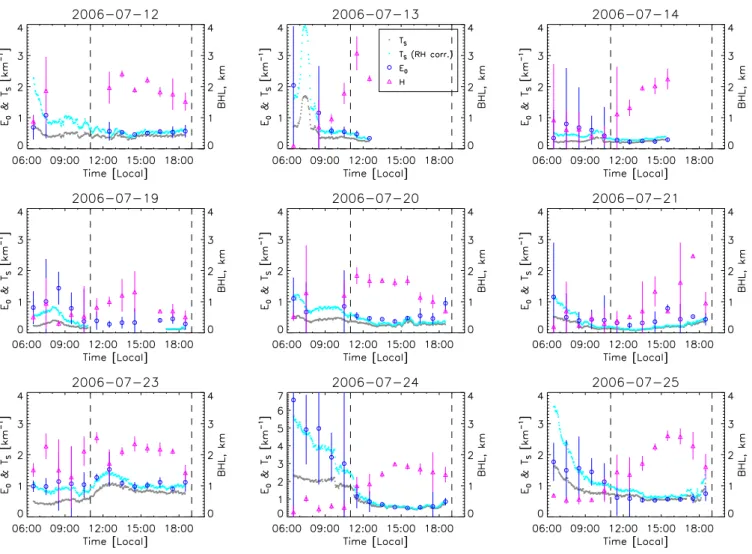
Fig. 5. Aerosol extinctionE0 and aerosol layer heightH derived from MAX-DOAS measurements for 9 days during the PRD 2006 campaign. Also shown are the simultaneously recorded nephelometer readings, original and humidity corrected data. The dashed line indicates 11:00 the margin for data considered in Fig. 6b.
of both measurements. Considering the fact that the MAX-DOAS measures the aerosol extinction averaged over a dis-tance while the nephelometer detects the aerosol scattering in the air mass near the instrument, the results of the lin-ear regression demonstrate a good agreement between the measurement results of these two instruments. As described above, the major discrepancies betweenE0andTSare found during morning hours.
We retrieved aerosol extinctions for all days plotted in Fig. 5. The variation of aerosol vertical distributions can be clearly identified: In the early morning hours (06:00–08:00), aerosols from fog and local emission processes were con-centrated in a surface layer of approximately 800 m. With the sun rising and growing convection the height of the low-est layer,H, increased and aerosols in this layer dispersed to upper layers. Due to this mixing process, the aerosol extinc-tion in the lowest layer started to decrease. The highest value ofH accompanied the lowest value of the extinction in the
afternoon (16:00–17:00). The decrease ofH and the accu-mulation of aerosols in the lowest layer started again around sunset (18:00–19:00).
Fig. 6. Correlation and regression analysis of MAX-DOAS aerosol versus nephelometer data. (a) all data recorded during 9 days, (b) restricted to time interval 11:00 to 19:00. The dashed line corre-sponds to 1:1, the solid line correcorre-sponds to a linear fit (see text for details and retrieved slopes and intercepts).
5 Conclusions
In this study, the first MAX-DOAS measurements were per-formed in southern China. During a period of one month we encountered 9 days with no or marginal cloud cover. Un-der these conditions, we retrieved aerosol extinctions from the absorption features of the oxygen dimer, O4, in the UV. The retrieval of the aerosol extinction and the aerosol bound-ary layer height was based on multi-parameter lookup-tables, which were created by the radiative transfer model McAr-tim. We minimized the difference between the measured and modeled O4 differential slant column as a function of the viewing geometry, i.e. the elevation angle of the MAX-DOAS telescope.
Our lookup-table had 3 free parameters (the total aerosol extinctionτ, the fraction of aerosol in the surface layerF, and the aerosol layer height H). Even at only 6 different elevation angles the fit of 3 free parameters was found to be meaningful for most conditions. This was shown by the good correlation with locally measured aerosol extinction, and the retrieval of reasonable aerosol/boundary layer heights be-tween 500 m and 2 km.
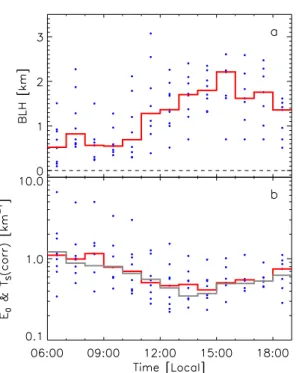
Fig. 7. Average diurnal profiles of aerosol layer heightH and the aerosol extinctionE0. The blue dots correspond to the single mea-surement presented in Fig. 5, the red line to median within the 1-h time interval. (a) Aerosol layer heightH. (b) Aerosol extinctionE0 and the nephelometer data (grey line) averaged over 1-h intervals.
2002CB410801, and the National High Technology Research and Development Program of China (863 Program) 2006AA06A301.
Edited by: M. van Roozendael
References
Ansmann, A., Engelmann, R., Althausen, D., Wandinger, U., Hu, M., Zhang, Y., and He, Q.: High aerosol load over the Pearl River Delta, China, observed with Raman lidar and Sun photometer, Geophys. Res. Lett., 32, L13815, doi:10.1029/2005GL023094, 2005.
Arnott, W. P., Moosmuller, H., Rogers, C. F., Jin, T. F., and Bruch, R.: Photoacoustic spectrometer for measuring light absorption by aerosol: instrument description, Atmos. Environ., 33, 2845– 2852, doi:10.1016/S1352-2310(98)00361-6, 1999.
Bussemer, M.: Der Ring-Effekt: Ursachen und Einfluss auf die spektroskopische Messung stratosph¨aischer Spurenstoffe, Mas-ter’s thesis, Universit¨at Heidelberg, Germany, 1993.
Chiang, C.-W., Chen, W.-N., Liang, W.-A., Das, S. K., and Nee, J.-B.: Optical properties of tropospheric aerosols based on mea-surements of lidar, sun-photometer, and visibility at Chung-Li (25 N, 121 E), Atmos. Environ., 41, 4128–4137, doi:10.1016/j. atmosenv.2007.01.019, 2007.
Deutschmann, T.: Atmospheric Radiative Transfer Modelling with Monte Carlo Methods, Master’s thesis, Universit¨at Heidelberg, Germany, http://rtm.iup.uni-heidelberg.de/McArtim/, 2009. Eck, T., Holben, B. N., Reid, J. S., Dubovik, O., Smirnov, A.,
O’Neill, N., Slutsker, I., and Kinne, S.: Wavelength dependence of the optical depth of biomass burning, urban, and desert dust aerosols, J. Geophys. Res., 104, 31333–31349, 1999.
Friess, U., Monks, P. S., Remedios, J. J., Rozanov, A., Sinreich, R., Wagner, T., and Platt, U.: MAX-DOAS O4 measurements: A new technique to derive information on atmospheric aerosols: 2. Modeling studies, J. Geophys. Res.-Atmos., 111, D14203, doi: 10.1029/2005JD006618, 2006.
Garland, R. M., Yang, H., Schmid, O., Rose, D., Nowak, A., Achtert, P., Wiedensohler, A., Takegawa, N., Kita, K., Miyazaki, Y., Kondo, Y., Hu, M., Shao, M., Zeng, L. M., Zhang, Y. H., An-dreae, M. O., and P¨oschl, U.: Aerosol optical properties in a rural environment near the mega-city Guangzhou, China: implications for regional air pollution, radiative forcing and remote sensing, Atmos. Chem. Phys., 8, 5161–5186, 2008,
http://www.atmos-chem-phys.net/8/5161/2008/.
Grainger, J. F. and Ring, J.: Anomalous Fraunhofer Line Profiles, Nature, 193, 762, doi:10.1038/193762a0, 1962.
Greenblatt, G. D., Orlando, J. J., Burkholder, J. B., and Ravis-hankara, A. R.: Absorption-Measurements of Oxygen between 330 nm and 1140 nm, J. Geophys. Res.-Atmos., 95, 18577– 18582, 1990.
Hendrick, F., Van Roozendael, M., Kylling, A., Petritoli, A., Rozanov, A., Sanghavi, S., Schofield, R., von Friedeburg, C., Wagner, T., Wittrock, F., Fonteyn, D., and De Mazi`ere, M.: Inter-comparison exercise between different radiative transfer models used for the interpretation of ground-based zenith-sky and multi-axis DOAS observations, Atmos. Chem. Phys., 6, 93–108, 2006, http://www.atmos-chem-phys.net/6/93/2006/.
Hofzumahaus, A., Rohrer, F., Lu, K., Bohn, B., Brauers, T., Chang, C.-C., Fuchs, H., Holland, F., Kita, K., Kondo, Y., Li, X., Lou, S.,
Shao, M., Zeng, L., Wahner, A., and Zhang, Y.: Amplified Trace Gas Removal in the Troposphere, Science, 324, 1702–1704, doi: 10.1126/science.1164566, 2009.
H¨onninger, G. and Platt, U.: Observations of BrO and its verti-cal distribution during surface ozone depletion at Alert, Atmos. Environ., 36, 2481–2489, doi:10.1016/S1352-2310(02)00104-8, 2002.
H¨onninger, G., von Friedeburg, C., and Platt, U.: Multi axis dif-ferential optical absorption spectroscopy (MAX-DOAS), Atmos. Chem. Phys., 4, 231–254, 2004,
http://www.atmos-chem-phys.net/4/231/2004/.
Inomata, S., Tanimoto, H., Kameyama, S., Tsunogai, U., Irie, H., Kanaya, Y., and Wang, Z.: Technical Note: Determination of formaldehyde mixing ratios in air with PTR-MS: laboratory ex-periments and field measurements, Atmos. Chem. Phys., 8, 273– 284, 2008, http://www.atmos-chem-phys.net/8/273/2008/. Irie, H., Kanaya, Y., Akimoto, H., Iwabuchi, H., Shimizu, A., and
Aoki, K.: First retrieval of tropospheric aerosol profiles using MAX-DOAS and comparison with lidar and sky radiometer mea-surements, Atmos. Chem. Phys., 8, 341–350, 2008,
http://www.atmos-chem-phys.net/8/341/2008/.
Kraus, S. and Geyer, A.: DOASIS Jscript programming description, Institut f¨ur Umweltphysik, Universit¨at, Heidelberg, 2001. Kurucz, R. L., Furenlid, I., J., and Testerman, L.: Solar Flux Atlas
from 296 to 1300 nm, Technical report, National Solar Observa-tory, 1984.
Lee, H., Irie, H., Kim, Y. J., Noh, Y., Lee, C., Kim, Y., and Chun, K. J.: Retrieval of Aerosol Extinction in the Lower Troposphere Based on UV MAX-DOAS Measurements, Aerosol Sci. Tech-nol., 43, 502–509, doi:10.1080/02786820902769691, 2009. Leigh, R. J., Corlett, G. K., Frieß, U., and Monks, P. S.: Spatially
resolved measurements of nitrogen dioxide in an urban environ-ment using concurrent multi-axis differential optical absorption spectroscopy, Atmos. Chem. Phys., 7, 4751–4762, 2007, http://www.atmos-chem-phys.net/7/4751/2007/.
Liu, X., Cheng, Y., Zhang, Y., Jung, J., Sugimoto, N., Chang, S.-Y., Kim, Y. J., Fan, S., and Zeng, L.: Influences of relative hu-midity and particle chemical composition on aerosol scattering properties during the 2006 PRD campaign, Atmos. Environ., 42, 1525–1536, doi:10.1016/j.atmosenv.2007.10.077, 2008. Meller, R. and Moortgat, G. K.: Temperature dependence of the
ab-sorption cross sections of formaldehyde between 223 and 323 K in the wavelength range 225–375 nm, J. Geophys. Res.-Atmos., 105, 7089–7101, 2000.
Pikelnaya, O., Hurlock, S. C., Trick, S., and Stutz, J.: Intercom-parison of multiaxis and long-path differential optical absorp-tion spectroscopy measurements in the marine boundary layer, J. Geophys. Res., 112, D10S01, doi:10.1029/2006JD007727, 2007.
Platt, U. and Stutz, J.: Differential Optical Absorption Spec-troscopy: Principles and Applications, Springer, Berlin, Heidel-berg, Germany, 2008.
Platt, U., Marquard, L., Wagner, T., and Perner, D.: Corrections for zenith scattered light DOAS, Geophys. Res. Lett., 24, 1759– 1762, 1997.
Sinreich, R., Volkamer, R., Filsinger, F., Frieß, U., Kern, C., Platt, U., Sebasti´an, O., and Wagner, T.: MAX-DOAS detection of gly-oxal during ICARTT 2004, Atmos. Chem. Phys., 7, 1293–1303, 2007, http://www.atmos-chem-phys.net/7/1293/2007/.
Voigt, S., Orphal, J., Bogumil, K., and Burrows, J. P.: The temper-ature dependence (203–293 K) of the absorption cross sections of O-3 in the 230–850 nm region measured by Fourier-transform spectroscopy, J. Photochem. Photobiol. A, 143, 1–9, 2001. Voigt, S., Orphal, J., and Burrows, J. P.: The temperature and
pressure dependence of the absorption cross-sections of NO2 in the 250–800 nm region measured by Fourier-transform spec-troscopy, J. Photochem. Photobiol. A, 149, 1–7, 2002.
Wagner, T., Dix, B., von Friedeburg, C., Friess, U., Sanghavi, S., Sinreich, R., and Platt, U.: MAX-DOAS O4 measurements: A new technique to derive information on atmospheric aerosols – Principles and information content, J. Geophys. Res., 109, D22205, doi:10.1029/2004JD004904, 2004.
Wagner, T., Burrows, J. P., Deutschmann, T., Dix, B., von Friede-burg, C., Frieß, U., Hendrick, F., Heue, K.-P., Irie, H., Iwabuchi, H., Kanaya, Y., Keller, J., McLinden, C. A., Oetjen, H., Palazzi, E., Petritoli, A., Platt, U., Postylyakov, O., Pukite, J., Richter, A., van Roozendael, M., Rozanov, A., Rozanov, V., Sinreich, R., Sanghavi, S., and Wittrock, F.: Comparison of box-air-mass-factors and radiances for Multiple-Axis Differential Opti-cal Absorption Spectroscopy (MAX-DOAS) geometries Opti- calcu-lated from different UV/visible radiative transfer models, Atmos. Chem. Phys., 7, 1809–1833, 2007,
http://www.atmos-chem-phys.net/7/1809/2007/.
Wilmouth, D. M., Hanisco, T. F., Donahue, N. M., and Ander-son, J. G.: Fourier transform ultraviolet spectroscopy of the A(2)Pi(3/2)<−X(2)Pi(3/2) transition of BrO, J. Phys. Chem. A, 103, 8935–8945, 1999.
Wittrock, F., Oetjen, H., Richter, A., Fietkau, S., Medeke, T., Rozanov, A., and Burrows, J. P.: MAX-DOAS measurements of atmospheric trace gases in Ny- ˚Alesund – Radiative transfer studies and their application, Atmos. Chem. Phys., 4, 955–966, 2004, http://www.atmos-chem-phys.net/4/955/2004/.