www.hydrol-earth-syst-sci.net/17/4789/2013/ doi:10.5194/hess-17-4789-2013
© Author(s) 2013. CC Attribution 3.0 License.
Hydrology and
Earth System
Sciences
Assessing the hydrologic restoration of an urbanized area via an
integrated distributed hydrological model
D. H. Trinh1and T. F. M. Chui2
1Department of Civil and Environmental Engineering, National University of Singapore, Singapore, Singapore 2Department of Civil Engineering, The University of Hong Kong, Hong Kong, China
Correspondence to: T. F. M. Chui ([email protected])
Received: 5 December 2012 – Published in Hydrol. Earth Syst. Sci. Discuss.: 4 April 2013 Revised: 24 August 2013 – Accepted: 1 November 2013 – Published: 4 December 2013
Abstract. Green structures (e.g. green roof and bio-retention systems) are adopted to mitigate the hydrological impacts of urbanization. However, our current understanding of urban-ization impacts are often process-specific (e.g. peak flow or storm recession), and our characterizations of green struc-tures are often on a local scale. This study uses an integrated distributed hydrological model, Mike SHE, to evaluate the urbanization impacts on both overall water balance and wa-ter regime, and also the effectiveness of green structures at a catchment level. Three simulations are carried out for a highly urbanized catchment in the tropics, representing pre-urbanized, urbanized and restored conditions. Urbanization transforms vegetated areas into impervious surfaces, result-ing in 20 and 66 % reductions in infiltration and base flow respectively, and 60 to 100 % increase in peak outlet dis-charge. Green roofs delay the peak outlet discharge by 2 h and reduce the magnitude by 50 %. Bio-retention systems mitigate the peak discharge by 50 % and also enhance in-filtration by 30 %. The combination of green roofs and bio-retention systems even reduces the peak discharge to the pre-urbanized level. The simulation results obtained are indepen-dent of field data, enabling a generic model for understanding hydrological changes during the different phases of urban-ization. This will benefit catchment-level planning of green structures in other urban areas.
1 Introduction
Nevertheless, they mostly focus on the changes in particular components or processes, and examine the impacts on either water balance or water regime. There is thus an incentive to develop an integrated understanding on the overall changes in both water balance and water regime.
For environmental benefits and water resources manage-ment, there has been rising interest to mitigate the hydrolog-ical impacts of urbanization and to restore pre-urbanized hy-drological conditions. One approach is to implement small-scale hydrologic control throughout a catchment. Examples of such hydrologic controls, known as “green structures” or “low-impact development practices”, include green roofs and bio-retention systems. Even though there are many variants of green structures, green roofs and bio-retention systems are representative of most kinds of green structures as they comprise the main hydrologic restoration mechanisms of sur-face runoff delay and infiltration enhancement. Green roofs collect and retain rainwater falling onto buildings for a cer-tain period of time (from hours to days) (Oberndorfer et al., 2007), thereby reducing and delaying water discharge to the drainage system. Studies have found that green roofs retain 40–80 % of precipitation (Hutchinson et al., 2003; Palla et al., 2012; VanWoert et al., 2005) and reduce 60–80 % of peak discharge (Bliss et al., 2009; Mentens et al., 2006; Palla et al., 2012; Villarreal et al., 2004). They also tend to retain a higher fraction of precipitation in small storms than in large ones (Carter and Rasmussen, 2006). On the other hand, bio-retention systems not only retain stormwater (Xiao and Pher-son, 2011) but also enhance infiltration (Davis, 2008; James and Dymond, 2012). Evaluating the effectiveness of bio-retention systems, Holman-Dodds et al. (2003) concluded that they do not reduce runoff significantly on a site with low infiltration capacity; while Chang et al. (2009) emphasized that they are more effective when sited close to the water-shed outlet. More quantitatively, Davis (2008) showed that with a 2 % bio-retention system over 0.24 ha area, peak flow reduced by 44 to 63 %. However, most of the above studies are in plot-scale or small catchments, only evaluating the lo-cal impacts of an individual green structure.
The objective of this study is to assess the catchment-scale impact of urbanization on both water balance and water regime using an integrated distributed hydrological model, Mike SHE (System Hydrologique European). The model in-cluded all the main hydrological components (e.g. canopy interception, evapotranspiration, overland flow, river routing and groundwater) and detailed the spatial variations within a catchment. With the use of the integrated distributed hy-drological model, the feasibility of restoring the hyhy-drological condition is examined through the implementation of green roofs and bio-retention systems on a catchment scale.
2 Methodology
2.1 The integrated distributed hydrological model
Urbanization and green structures affect the interactions of various hydrological processes such as canopy interception, plant evapotranspiration, water and soil evaporation, infil-tration, overland flow, and groundwater flow. Thus, an inte-grated hydrological model that accounts for all the above pro-cesses is needed to assess the hydrological impacts of urban-ization and green structures. Compared to distributed mod-els, lumped models have two main limitations. Firstly, the do-main response is only evaluated at the outlet and sub-dodo-main response is not considered. Furthermore, each characteristic of a catchment, despite its spatial variation, is lumped into one single parameter which may not truly represent the ac-tual spatial distribution within the catchment. This research is interested in sub-domain response and also requires the con-siderations of the heterogeneous land uses including green structures in an urbanized catchment. Therefore, despite the high demand in input data and long computation time, a fully distributed model is more suitable for this study.
In particular, Mike SHE, a comprehensive deterministic, distributed, and physically based modelling system, is se-lected for this research. Mike SHE couples river routing modelling (Mike 11), overland flow and groundwater mod-elling, giving a complex integrated hydrological analysis of surface and subsurface water systems. It simulates all ma-jor processes in the land phase of the hydrological cycle, in-cluding precipitation, interception, infiltration, evapotranspi-ration, subsurface flow in unsaturated and saturated zones, overland flow and flow in the channel and river. Figure 1 shows the main components of Mike SHE and their govern-ing equations. The Saint Venant equation is solved numeri-cally in two dimensions for overland flow and in one dimen-sion for channel flow. The one-dimendimen-sional Richards equa-tion (or simplified gravity equaequa-tion) is solved for the pressure head (or moisture) variation in the unsaturated zone. The hor-izontal movement of water in unsaturated zone is considered negligible. Saturated groundwater flow is simulated using the three-dimensional Boussinesq equation.
2.2 Green roofs and bio-retention systems – conceptual understanding and model implementation
2.2.1 Green roof
Fig. 1. Components of the integrated distributed hydrological model.
it has also been shown to benefit stormwater management (Bengtsson et al., 2005; Mentens et al., 2006; VanWoert et al., 2005). Rainfall needs to percolate and infiltrate through the vegetation and soil layers, thereby delaying runoff dis-charge as well as improving water runoff quality (Hathaway et al., 2008; Palla et al., 2010).
The key hydrological impact of a green roof during a storm event is the delay in runoff discharge. In Mike SHE, this de-lay in runoff discharge is simulated by dede-laying the rainfall in each individual green roof by 3 h. The duration of delay is based on previously published studies; Moran et al. (2004) reported a delay time of 3 h and Rowe et al. (2003) found peak flow was delayed by 2 to 4.5 h. Other important hydro-logical processes, e.g. infiltration, are simulated as part of the integrated model as explained in Sect. 2.1. However, the de-tailed flow processes within the different layers of a green roof, such as water storage and evapotranspiration, are not simulated given its high computational demand and small impact on predicting the overall discharge delay of a green roof. In terms of water storage, previous studies show that there is only a small amount of retention during large rainfall events (Carter and Rasmussen, 2006; VanWoert et al., 2005). The current model assumes no retention, which is conser-vative but acceptable as tropical rainfall is of high intensity and large rainfall events that potentially cause flooding prob-lems are of interests. For evapotranspiration, we performed a measurement on a plot-scale green roof in Singapore and the results show that evapotranspiration accounts for 5 % of total water balance. So, it is considered as insignificant and there-fore also neglected in the green roof modelling. In addition, this study aims to develop a general idea on the effective-ness of catchment-scale green roof implementation without focusing on the detailed behaviour of each individual green roof. Therefore, simplifications made at individual green roof
Fig. 2. Location of the Marina catchment within Singapore.
level would not affect the overall catchment-scale hydrolog-ical behaviours.
2.2.2 Bio-retention system
A bio-retention system is a shallow planted depression, and consists of ponding area, filter media, transition layer and drainage layer. It is one of the best stormwater manage-ment practices that provides both conveyance function and stormwater treatment. Stormwater runoff is filtrated through and treated by vegetation and soil within the bio-retention area. The filtrated water is either collected by a drainage sys-tem or allowed to infiltrate into the ground. To enhance in-filtration into the system, it often employs filter media with a hydraulic conductivity of one to two orders of magnitude (i.e. 10 to 100 times) higher than that of the surrounding soil profile. In addition, the system allows ponding which provides further flow retention. In the integrated hydrolog-ical model, the bio-retention systems allow stormwater to infiltrate directly into the surrounding soil profile (i.e. no subsoil drainage). The bio-retention systems are modelled as homogenous soils with a high hydraulic conductivity of 10−5m s−1, extending 1 m below the ground. The systems
are also equipped with 20 cm of detention ponding. All the hydrological processes, e.g. evapotranspiration and infiltra-tion, are also considered in the integrated model.
2.3 Marina-like catchment – a case study in Singapore
The biophysical and hydrological environment of Singapore has altered dramatically due to rapid urbanization and indus-trialization (Lu et al., 2005). The Marina catchment (Fig. 2), the most urbanized part of Singapore, has typical character-istics of a highly urbanized catchment in the tropical area. It has a catchment area of 160.8 km2, currently consists of different land uses and soil conditions, and includes the dif-ferent components of hydrological and vegetation system (e.g. plant, river, reservoirs, mixture of permeable and im-permeable surfaces). Adopting the main characteristics of the Marina catchment, an integrated distributed hydrological model of a Marina-like catchment is built to evaluate the im-pact of urbanization on water balances and regimes. In other words, this objective of this study is not to reproduce the ex-act situations of the Marina catchment, but rather to demon-strate the generic influences of urbanization on hydrological conditions. The model is further developed and applied to evaluate the effectiveness of catchment-scale green structures in mitigating the hydrological impacts of urbanization.
To address the issues raised in the objective, several sim-ulations are performed. Firstly, to evaluate the effect of ur-banization in Singapore, a pre-urbanized scenario in which all the hydrological conditions are at natural state is set up. It is then compared with an urbanized scenario in which all the hydrological factors are urbanized. Secondly, to evaluate the effectiveness of green structures in minimizing the impact of urbanization, another set of scenarios is set up to reflect the different strategies in installing the green structures in an urbanized environment. The results are then compared with those without the green structures to conclude their effective-ness. The simulation of each scenario is one year in duration, and is further elaborated below:
– The first scenario (pre-urbanized) represents the con-dition before urbanization in which the entire land sur-face is covered by plants and the rivers are in natural conditions.
– The second scenario (urbanized) represents the cur-rent situation in which the land surface coverage has changed drastically due to urbanization and is a com-bination of permeable and impermeable surfaces and buildings; rivers are also concrete-lined.
– The third scenario represents hypothetical situations in which green roofs and/or bio-retention systems are in-stalled at strategic locations to mitigate the hydrolog-ical impacts of urbanization. This scenario is further divided into three different strategies:
– Strategy 1: restored by green roofs (Green roof ). All the buildings in the catchment are covered with green roofs, which account for 14 % of the catchment area.
– Strategy 2: restored by bio-retention systems (Bio-retention). Five (5) % of the catchment area is converted from impervious surfaces in the urbanized scenario to bio-retention systems in this strategy. The bio-retention systems are lo-cated near the streams and are in areas where the groundwater table is at least 1.5 m below the ground.
– Strategy 3: restored by both green roofs and bio-retentions (Hybrid). The hybrid is a combination of green roofs and bio-retention strategy. To focus on the impacts resulting from the change from veg-etated to impervious surface and the implementation of green structures, other factors such as climate, soil and topography are assumed not to change among the scenarios. Each sce-nario is run for one year under the same climate condition. The digital elevation model (DEM) SRTM (Shuttle Radar Topography Mission) (i.e. topography) in 2005 is obtained from the US Geological Survey with 30 m resolution (USGS, 2010) and are applied to all three scenarios. The surface mesh consists of 290 cells in east–west direction and 310 cells in north–south direction; each element is rectangular with a di-mension of 60×60 m. The vertical discretization is chosen to match with the soil profile description and the required res-olution of the simulation. In addition, the Richards equation is used to accurately simulate the infiltration process in the unsaturated zone. Therefore, 45 subsurface layers are used with a vertical discretization of 20 cm for the first 1 m depth, 50 cm for the following 5 m depth, and then 100 cm for the rest of the domain. Together with the surface mesh, the total domain has 4 055 500 elements. Each of the main hydrologic components has its own time step. River routing is the most dynamic process and is highly responsive to rainfall and to-pographical condition, followed by overland flow, and finally unsaturated and groundwater flow. In addition, to simulate the flow exchanges between the components, their time steps have to be even multiples of each other. For river routing, a time step of 1 minute is used. For overland flow, unsatu-rated and groundwater components, time steps of 0.25, 0.5 and 12 h are used respectively. This study examines the rapid response of peak outlet discharge (on timescales of minutes), as well as the long-term groundwater response (on timescales of days and months). Thus, the above time steps are chosen as compromises. When the time steps taken are finer than the data input, the model then linearly interpolates the data for the simulated time step.
2.3.1 Surface and subsurface parameters
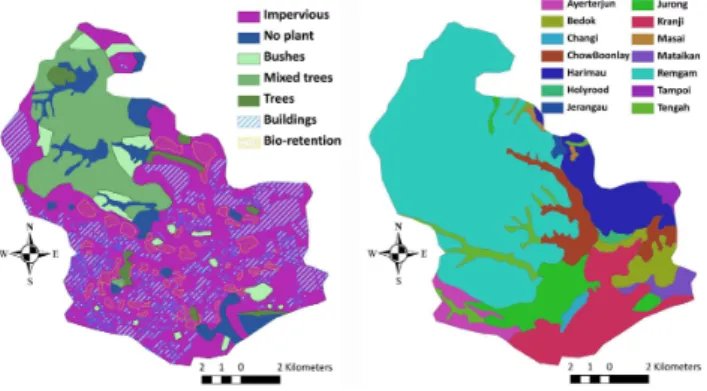
Fig. 3. Land cover (left) and soil distribution (right) of the Marina-like catchment 740 (Land use: 66 % impervious, including 14 % building and 5 % potential bio-retention area; 9 % 741 no plants; 25 % plants, including 5 % bushes, 18 % mixed trees and 2 % trees).
leaf area indices (LAI) and roof depths (RD) (Table 1). The tree heights in Singapore vary from 4 to 20 m (NPark, 2011). Based on the study of Štofko (2010) on the relationship be-tween tree height and root depth, the corresponding average root depth should be approximately 5 m. A recent survey in Singapore also shows that the root of vegetation can be more than 3 m (Ngo et al., 2013).
For soil properties, top soil (i.e. soil from surface up to 1 m depth) information is extracted from Singapore soil map (Fig. 3), digitized from the soil of the Republic of Singa-pore (Wells, 1977; Ives, 1977). Below 1 m depth, the soil is assumed to be loamy sand. Using the soil information from Table 2, together with the hydraulic parameters of standard soil texture from the United State Department of Agriculture, Van Genuchten parameters are estimated to define moisture retention and unsaturated hydraulic conductivity.
Regarding surface properties, detention storage is used to limit the amount of water that can flow over the ground surface; the depth of ponded water must exceed the deten-tion depth before water is routed overland. For the Marina-like catchment, detention depth is generally set as 0.01 mm as the catchment is mostly covered by impervious surface. The detention depth for reservoirs is the maximum reservoir level, while the detention depth is set as 20 cm for areas with bio-retention systems based on Singapore’s National Wa-ter Agency guideline for bio-retention system design (PUB, 2011). In Mike SHE, there is no explicit option to directly specify the partitioning of rainfall into direct runoff, infiltra-tion and groundwater recharge as the model simulates the infiltration and subsurface water movement according to the different soil properties and rainfall conditions. However, one can specify the fraction of ponded water that drains to the drainage system. For this case study, 30 % of the ponded water drains directly to the river network and the remain-ing 70 % infiltrates. Surface roughness, defined by Mannremain-ing number (M) (inverse of the conventional Manning coeffi-cientn), is 25 and 80 for surface covered with plant and open
space, respectively. The values are equivalent to the Manning coefficient of 0.04 and 0.0125, which are typical values for vegetated and concreted surface (Chow, 1959).
For geological properties, hydraulic parameters for the saturated zone are assumed to be loamy sand, a typical soil type in Singapore, for the entire catchment with a horizontal hydraulic conductivity of 1.22×10⁻⁵ [m s−1] and a
verti-cal hydraulic conductivity equivalent to 10 % of the horizon-tal hydraulic conductivity. Specific yield and specific stor-age is 0.2 [-] (Freeze and Cherry, 1979) and 9.82×10⁻⁴m−1
(Younger, 1993), respectively.
2.3.2 Initial condition
The initial condition of the integrated hydrological model is the combination of the initial conditions of different com-ponents such as ponding depth, soil moisture content and groundwater table. Ponding depth of reservoirs is assumed to be at the reservoir water levels, and is set at 0 m in the rest of the domain. To obtain an initial groundwater condition, a 10 yr simulation is carried out. As the groundwater table in Singapore is only a few metres below the ground surface (Rezaur et al., 2003), the initial groundwater table for the 10 yr simulation is set at 1.5 m below the ground. The climate condition of the year 2005 is repeated 10 times for this 10 yr simulation. The groundwater table, reaching dynamic equi-librium after 10 yr, is then used as the initial condition of the remaining simulations. The initial condition sensitivity anal-ysis of the results to the initial condition is also carried out. It is shown that within a reasonable range of initial conditions, the results converge to the same solutions. Initial soil mois-ture is set to achieve equilibrium pressure corresponding to the groundwater table from the 10 yr simulation. In addition, for each 1 yr scenario simulation, another 5 yr of stabilization simulation is carried out to obtain dynamic equilibrium con-ditions of all the hydrological components, which are then used as the initial conditions for that particular scenario.
2.3.3 Boundary conditions
For the top boundary, precipitation is the only in-flux and evapotranspiration is the only out-flux. Rainfall and potential evapotranspiration are assumed to be uniformly distributed in the entire catchment. Hourly rainfall data from the year 2005 are obtained from the Kent Ridge campus of the National University of Singapore (NUS), located at the southwestern edge of the catchment. Evapotranspiration is calculated from Penman–Monteith method (Eq. 1) using hourly weather data (e.g. atmospheric pressure, air temperature, relative humid-ity, wind speed, and incoming radiation) from NUS for the year 2005.
λE=1 (Hnet
−G)+ρaircp e0z−ez/ra
1+γ (1+rc/ra)
Table 1. Vegetation characteristics.
Vegetation Type Land Use Vegetation Parameter Leaf Area Index (-) Root Depth (-)
Impervious Residential, Business centre, Industry, Institution, Commercial, Military area, Airfield, Port, Infrastructure
0 0
No plant Reserve site, Cemetery 0 0
Bushes Agriculture 3 2000
Mixed trees Open space, Recreation 5 4000
Trees Park 6 5000
Table 2. Soil texture and properties.
Soil Type Depth (cm) Soil Texture (%) K (m s−1) Soil Type Depth (cm) Soil Texture (%) K (m s−1)
Sand Silt Clay Sand Silt Clay
REMGAM 0–8 78 2 20 1.76×10⁻⁵ TAMPOI 0–6 81.2 2.1 16.7 1.94×10⁻⁵ 8–34 61 1 38 3.97×10⁻⁶ 6–13 72.5 1 26.5 3.70×10⁻⁶ 34–68 57 3 40 4.04×10⁻⁶ 13–44 69.6 0 30.4 2.69×10⁻⁶ 68–160 55 2 43 3.13×10⁻⁶ 44–100 61.7 0 38.3 2.69×10⁻⁶
JERANGAU 0–5 35.7 6.1 58.2 1.42×10⁻⁶ BEDOK 0–10 Clay Loam 9.47×10⁻⁷ 15–30 38 4 58 1.55×10⁻⁶ 10–100 Silt Clay 1.11×10⁻⁶ 30–82 30 4 66 1.25×10⁻⁶
CHOWBOONLAY 0–10 Silt 5.06×10 −6
82+ 28 3 69 1.26×10⁻⁶ 10–100 Silt Clay 1.11×10⁻⁶
AYERTERJUN 0–7 24 47 29 7.11×10
−6 CHANGI 0–100 Sand 7.44×10⁻⁵
7–24 23 44 33 1.53×10⁻⁶ HOLYROOD 0–100 Loam Sand 1.22×10⁻⁵ 24–60 13 33 54 1.58×10⁻⁶ JURONG 0–100 Silt Clay 1.11×10⁻⁶ 60–135 9 29 62 1.78×10⁻⁶ KRANJI 0–100 Silt Clay 1.11×10⁻⁶
HARIMAU 0–14 77.8 4 18.2 1.68×10
−5 MATAIKAN 0–100 Sand Clay Loam 1.53×10⁻⁶
14–28 73.5 4.1 22.4 5.74×10⁻⁶ MASAI 0–100 Clay 1.71×10⁻⁶ 28–35 69.8 3.1 27.1 3.41×10⁻⁶ TENGAH 0–100 Loam Sand 1.22×10⁻⁵ 53–94 57.8 1.2 41 2.16×10⁻⁶
whereλ is the latent heat of vaporization (MJ kg−1); E is
the hourly potential evapotranspiration (mm h−1); 1is the
slope of the saturation vapour pressure–temperature curve (kPa◦C−1);H
netis the net radiation (MJ m−2h−1);Gis the
heat flux density to the ground (MJ m−2h−1), which is
as-sumed to be negligible in this study; ρair is the air density
(kg m−3); c
p is the specific heat at the constant pressure
(MJ kg−1◦C−1);e0
z is the saturation vapour pressure of air
at heightz(kPa); ez is the water vapour pressure of air at
heightz(kPa);γ (kPa◦C−1) is the psychometric constant;r
c
is the plant resistance (s m−1); andr
a is the diffusion
resis-tance (s m−1).
For the boundary conditions on the sides, since the model domain is the entire Marina-like catchment, there are no fluxes across the inland boundary. The boundary bordering the sea is assumed to have a fixed head of 0 m correspond-ing to the mean sea level. This boundary is independent from tidal fluctuation due to the existence of the Marina Barrage.
Reservoirs in the catchment are set as internal boundary con-ditions with head-controlled flux. The exchange fluxes de-pend on the head difference between the groundwater table and the reservoir water depth with a leakage coefficient of 10−3s−1. The bottom boundary of the domain is bed rock
and thus has no flux. Due to the lack of detailed geology data, the bedrock is assumed to be at a constant depth of 30 m be-low the ground. This assumption will not affect the shalbe-low groundwater movement in the shallow subsurface environ-ment (i.e. in the top few metres), which is the focus of this study.
2.3.4 River routing
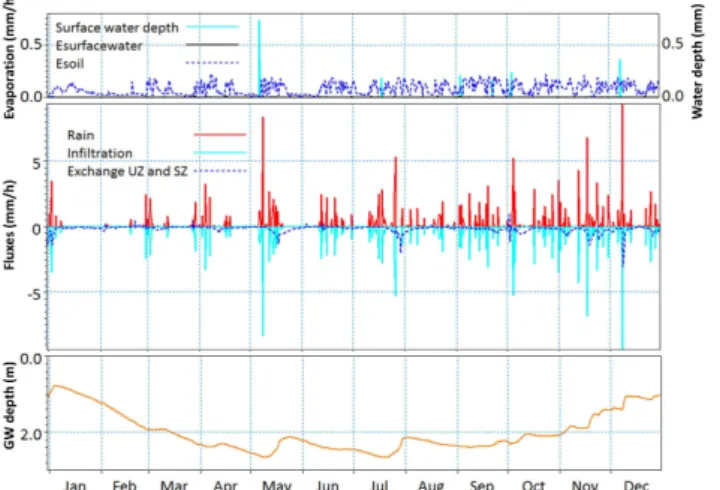
Fig. 4. Water balance at observation point (indicated in Fig. 2) in catchment equipped with bio-retention systems (Esoil: evaporation from soil; Esurfacewater: evaporation from surface water (under-neath by the dotted blue line); exchange UZ and SZ: exchange be-tween unsaturated and saturated zone; GW depth: groundwater ta-ble depth).
the main river flow from north to south of the catchment (i.e. Kallang River) that has the addition of the trickle chan-nel (also known as a dry weather flow chanchan-nel that is con-structed along the centre and lowest part of a channel to carry low flows). The channel width is estimated based on remote sensing data and the channel elevation is estimated from DEM data. Inflow boundary at the upstream is set at a constant discharge value of 0 m3s−1. Downstream, water
level is at a constant elevation of 11 m which is approxi-mately the level of the Marina reservoir (the most southern and downstream reservoir).M is 25 and 80 for earthen and concrete river banks, respectively. The fluxes exchanged be-tween groundwater and surface water in the channel are es-timated using a leakage coefficient of 10−5. For the
stabi-lization of the model, initial water depth and discharge are at 0.1 m and 0 m3s−1, respectively.
3 Results
3.1 Impacts on overall water balance
To determine the impacts on water balance, the different hy-drological components and their temporal variations at the observation point (indicated in Fig. 2) are examined (Fig. 4). The selected location is near the main river and in the mid-stream of the catchment, which is highly urbanized. The re-sults, extracted from the bio-retention scenario, indicate that the hydrologic processes are temporally dynamic due to the changes in rainfall. For example, in the beginning of January, during the event with a rainfall intensity of 3.5 mm h−1, the
infiltration rate is slightly less than 3.5 mm h−1. The top soil
is saturated, producing a downward flux from the unsaturated
Fig. 5. Water balance aggregated over one year for different scenar-ios.
to the saturated zone at the rate of 2 mm h−1. Due to the
se-ries of rainfall events, groundwater table rises by 0.2 m. Dur-ing the relatively dry period of mid-January to mid-February, there are no downward fluxes from the unsaturated to the sat-urated zone. As the top soil dries out gradually, the moisture in the unsaturated zone is not enough to support the evapora-tion process; water is therefore taken from the saturated zone, leading to a gradual drawdown in the groundwater table.
The only influx to the catchment is rainfall, and it either turns into outfluxes (e.g. base flow, direct runoff flow and evapotranspiration) or increases the storage within the sys-tem (e.g. canopy storage, surface water storage and subsur-face water storage). Figure 5 presents the distribution of rain-fall into the different components aggregated over one year for the different scenarios. Canopy storage is not shown in the figure as it is negligible compared to other components. The surface and subsurface storage changes in all the scenar-ios are also insignificant (less than 0.5 % of total water bal-ance). This is because these storage changes in the model are changes of storage from one year to the next. As the simula-tions are repeated for 5 yr with the same climatic input, the model should reach a dynamic steady state (dynamic equi-librium condition) and the storage changes in the reporting year, which is the last year of the simulation run, should be minimal.
Fig. 6. Peak discharges at catchment outlet under different scenar-ios.
systems in either the bio-retention or hybrid scenarios due to the enhancing infiltration function of bio-retention systems.
3.2 Impacts on eminent water resources issues
3.2.1 Flash floods
To study the impact of urbanization and the strategies in averting flash floods, river discharge is first analysed. Ur-banization increases the peak outlet discharge significantly (Fig. 6). During rainfall events of small intensity (e.g. 13 and 28 December) and average intensity (e.g. 17, 19 July and 26 December), peak outlet discharge increases by more than 100 %. For rainfall events with high intensity (26 July and 8 December), the percentage increase is smaller (about 60 %). However, the magnitudes of peak discharge for small-and average-intensity rainfall are small. Thus, the high per-centage increase in fact does not have significant impact on the catchment. On the other hand, although the percentage increase of high-intensity rainfall is smaller, it has significant impact as the magnitude of peak discharge is relatively high. The highest peak outlet discharge in the urbanized scenario is 550 m3s−1, leading to potential flash floods in the low-lying
areas.
Besides assessing the impact of urbanization, the effec-tiveness of each strategy in reducing the flood risk is also examined. Overall, all the restoration strategies reduce the peak discharge. In average-intensity rainfall events, the green roof scenario or the bio-retention scenario reduces the peak discharge by 25 %. The hybrid scenario can fully reduce the peak flow to the pre-urbanized level. For example, the rainfall event on 19 July produces a peak outlet discharge
Fig. 7. Delay of peak discharges for different sections (i.e. down-stream, midstream and upstream) of the main river of catchment.
of 60 m3s−1in the pre-urbanized scenario; this amount
in-creases to 125 m3s−1in the urbanized scenario. The
instal-lation of either green roofs or bio-retention systems brings the peak discharge from 125 m3s−1down to 90 m3s−1. For
the case in which both green roofs and bio-retention systems are installed, the peak discharge is the same as in the pre-urbanized scenario. In the case of high-intensity rainfall, fo-cusing on the highest rainfall event in the simulation year, on 8 December, a rainfall depth of 136 mm in 5 h results in an outlet peak discharge of 550 m3s−1 under urbanized
conditions. Installation of either green roofs or bio-retention systems decreases the peak discharge to 450 m3s−1, and the
installation of both structures decreases the peak discharge to 330 m3s−1, which is even lower than the peak discharge
of 350 m3s−1in the pre-urbanized scenario. This is due to
the combined effect of green structures: the delay of rain-fall by green roofs and the enhancement of infiltration by bio-retention systems. To conclude, the large-scale restora-tion strategy restores the pre-urbanized condirestora-tion effectively in terms of outlet discharge, reducing the potential flooding problems.
Fig. 8. Infiltration rate at observation point (indicated in Fig. 2) in catchment.
Besides comparing the peak time downstream, one can also examine the change of delay along the channel from upstream to midstream and subsequently downstream. Fo-cusing on only the hybrid scenario, the relative heights of the two peaks vary between upstream, midstream and down-stream due to the merging of secondary rivers which are at different locations from green structures. Furthermore, there is a slight increase in the delay of the peak from upstream to downstream due to the propagation of waves along the river. Overall, examining the peak timing and its propaga-tion through the river network demonstrates the importance of a catchment-level planning of green structures (in terms of locations as well as the percentage of surface coverage) in mitigating floods.
3.2.2 Groundwater replenishment
The main source of groundwater replenishment in this catch-ment is from surface water infiltrating into the ground. Ur-banization not only increases the peak river discharge but also decreases the infiltration rate, preventing surface wa-ter from going into the ground and recharging subsurface storage. As mentioned in the water balance section, green roofs do not significantly change the water budget or enhance infiltration rate. This section therefore focuses on compar-ing the infiltration rates in the urbanized, pre-urbanized and retention scenarios to evaluate the effectiveness of bio-retention systems in enhancing infiltration. For plot scale, the infiltration rates at one particular location where land use has changed from pervious to impervious and then to bio-retention system is compared (Fig. 8). The infiltration rate is highest in the bio-retention scenario and is equal to the rain-fall rate. As a result, there can be local groundwater mounds in which the groundwater table is about 1 to 2 m higher than the surrounding environment. However, this should not affect the main underground infrastructure in Singapore (e.g. the underground transport system which is approximately 30 m below the ground). Other infrastructures (e.g. pipes) within the shallow subsurface environment are also often below the
Fig. 9. Average infiltration rate of entire catchment under different scenarios.
groundwater table and are designed for submerged condition. The impervious concrete surfaces in an urbanized catchment such as buildings, roads and pavements prevent infiltration. The infiltration rate of the entire catchment in 2005 is re-duced by 20 % in the urbanized scenario as compared to the purbanized scenario, while the bio-retention scenario re-stores 10 %. The actual infiltration rate under different sce-narios (Fig. 9) varies temporally depending on the rainfall intensity as well as the time interval between two consecu-tive rainfall events. There is significantly less infiltration in the urbanized scenario during high intensity rainfall events such as those on 9 May, 12 November and 17 November. The decrease can be as high as 40 to 50 %, compared to only 10 to 15 % in average rainfall events such as those from 14 to 18 May or from 31 October to 5 November. Bio-retention systems restore 20 to 30 % and 5 to 10 % of the pre-urbanized infiltration during high and average rainfall events respec-tively. For all the small rainfall events (e.g. 11 and 20 May and 15 November), the infiltration rate of the bio-retention scenario is higher than that in the pre-urbanized scenario. Most of the small rainfall events occur closely in time. In the pre-urbanized condition, the soil is fully saturated after sev-eral events. Water can no longer infiltrate and contributes to surface runoff. However, more water can infiltrate in the bio-retention systems because the detention ponding provides ad-ditional time for water to infiltrate into the ground.
3.3 Model sensitivity analysis
3.3.1 Rainfall resolution and simulation time step
To examine the influence of rainfall resolution and simula-tion time step on peak outlet discharge, two addisimula-tional simu-lations are carried out: (1) original rainfall data interval (1 h) but coarser simulation time steps (5 min for river routing, 0.5 h for overland flow, 1 h for unsaturated flow, and 12 h on groundwater flow); (2) rainfall data of smaller interval (5 min) with the original simulation steps.
simulations are extracted and compared with those from the original simulation. The results show that the increase in sim-ulation step sizes does not affect the time and the magni-tude of the peak discharges. The more detailed rainfall in-put increases the peak discharges at most by 20 m3s−1, and
changes the time of occurrence by at most 1 h.
3.3.2 Soil hydraulic conductivity of bio-retention system
Two simulations using bio-retention systems with soil hy-draulic conductivity of 5×10⁻⁵m s−1 (180 mm h−1) and
10−4m s−1 (360 mm h−1), which are higher than the
orig-inal value of 10−5m s−1 (36 mm h−1), are carried out. In
terms of outlet discharge, the results show that the difference among the scenarios is insignificant. In terms of infiltration rate and groundwater recharge, results from a bio-retention system at the centre of the catchment are extracted. Particu-larly, the groundwater table, infiltration rate and groundwater recharge across the system 12 h after the largest rainfall event in the simulated year are further explained as an example. This event has a rainfall depth of 130 mm and an intensity of 26 mm h−1. The infiltration rates of the different scenarios
are the same, as the rainfall intensity is lower than the soil hydraulic conductivities of the bio-retention systems. There is more recharge to the saturated zone at that particular mo-ment leading to a higher groundwater table in the scenario with higher soil hydraulic conductivity. However, the total recharges of all scenarios reach the same values eventually. The temporal difference in groundwater recharge is because rain water requires different duration to travel through the unsaturated zone to reach the saturated zone depending on the soil hydraulic conductivity of the bio-retention system.
3.3.3 Soil hydraulic conductivity of native soil
To assess the influence of soil hydraulic conductivity on rain-fall partitioning to recharge and runoff, different scenarios with a soil hydraulic conductivity that is one order of magni-tude lower are simulated.
For the aggregated water balance over one year, the rain-fall partitioning still follows the same patterns as the origi-nal simulation. For example, when compared with the pre-urbanized scenario, there is still close to a 10 % increase of direct runoff and 10 % decrease in evapotranspiration in the urbanized and hybrid scenarios. There is also more base flow in the hybrid scenario when compared to the urbanized one due to the green structures.
In terms of peak outlet discharge, the low hydraulic con-ductivity leads to an increase of peak discharge by 50 m3s−1
in the pre-urbanized scenario. Similarly, the decrease in hy-draulic conductivity also results in a higher peak discharge in the hybrid scenario. However, the amount of increase, 100 m3s−1, is higher than the pre-urbanized one. This is
be-cause the low hydraulic conductivity of the native soil not only reduces rainfall infiltration but also limits the
exfiltra-tion of the bio-retenexfiltra-tion system. The change in hydraulic conductivity however does not significantly affect the peaks in the urbanized scenario due to the low percentage of per-vious area. Although the absolute values of peak discharges change with the hydraulic conductivity, the relative differ-ences among the scenarios are still the same. In other words, there is still a drastic increase of peak discharge in the urban-ized scenario and a partial recovery in the hybrid one.
4 Discussion
The following key points underpin the analysis of the hy-drological characteristics of the different scenarios. Firstly, evapotranspiration accounts for a relatively high percentage of water budgets in all scenarios. It therefore should not be neglected; otherwise this might lead to overestimations of the other components. Secondly, groundwater plays an impor-tant role and should be taken into consideration, especially when the hydrological changes in shallow groundwater sys-tems are examined. The exchange between groundwater and surface water depends on the difference in groundwater level and surface water level, as well as the soil moisture content in the unsaturated zone. In shallow groundwater systems, it is even possible to have groundwater exfiltration during heavy rainfall in low-lying areas. Thirdly, different designs of green structures (e.g. green roofs versus bio-retention systems) pro-vide different hydrological functions and their relative loca-tions within the catchment also yield different outcomes at the catchment outlet. Therefore, it is possible to integrate dif-ferent green structures at optimized locations to achieve spe-cific targets such as reducing flash floods, enhancing ground-water replenishment, or restoring the pre-urbanized hydro-graph at the catchment outlet. Last but not least, the sensitiv-ity analysis on rainfall data resolution, simulation time step, and soil hydraulic conductivities of the bio-retention system and native soils leads to certain changes in the modelling results. However, the changes are not significant enough to affect the main conclusions of this study.
5 Summary and conclusions
1. In terms of the hydrological impacts of transforming 66 % of the vegetated area into impervious surface and changing the vegetation type in the remaining area dur-ing urbanization, the followdur-ing is observed:
– Infiltration on average reduces by 20 %, which is proportional to the increase of impervious sur-face. There is thus less subsurface water recharge and less subsurface water storage. The actual re-duction in each rainfall event varies with rain-fall intensity and time interval from the previous rainfall event.
– Base flow decreases by 66 % and surface runoff increases by 20 %, leading to a higher poten-tial of flash floods. The peak outlet discharge increases by 100 % during low- and average-intensity rainfall and by 60 % in high-average-intensity rainfall. Although the percentage increase is lower, the increase of discharge during high-intensity rainfall is more impactful due to the rel-atively high pre-urbanized value.
2. To mitigate the hydrological impacts of urbanization, three catchment-scale green structure strategies are ex-plored:
– The first strategy is to install green roofs in all the buildings, accounting for 14 % of the catchment area. The green roofs retain rainfall for 3 h but exert minimal changes in water balance or infil-tration. They do however reduce the peak outlet discharge by 30 to 50 % and delay the peak by 2 h, and thus can mitigate flash floods in urban areas.
– The second strategy is to set up bio-retention sys-tems in 5 % of the catchment area. Bio-retention systems are modelled as 1 m-deep soils with rela-tively high hydraulic conductivity of 10−5m s−1.
On average, infiltration for the catchment in-creases by 10 %. The actual increase in each event depends on the rainfall condition and can be as high as 30 % during rainfall with high in-tensity. Base flow increases and surface runoff decreases, and this second strategy can therefore also mitigate flash floods.
– The third strategy is to implement a combina-tion of the previous two strategies (i.e. installing 14 % green roofs and 5 % bio-retention). It pro-vides the functions of both types of structures (e.g. improving water balance, enhancing infil-tration rate, delaying peak outlet discharge), and manages to reduce the peak outlet discharge down to, and in some cases even lower than, the pre-urbanized value.
3. Assessing the hydrologic restoration of an urbanized area via the case study, further conclusions can be made:
– Evapotranspiration is one of the important pro-cesses and should not be neglected as it accounts for a relatively high percentage of the water bud-get.
– Groundwater plays an important role, especially in shallow groundwater systems, as it has direct dynamic effects on the infiltration rate and the water exchange between groundwater and sur-face water.
– It is feasible to re-shape the outlet hydrograph via large-scale hydrological controls through-out a catchment, but it is important to perform catchment-scale planning for the desired inte-grated spatial and temporal effects.
The simulation results obtained are independent of field data, enabling a generic model for understanding hydrological changes during the different phases of urbanization. The re-sults and conclusions drawn are thus beneficial and applica-ble to catchment-level water resource planning and manage-ment in many urban areas worldwide, especially those in the tropical region.
Supplementary material related to this article is
available online at http://www.hydrol-earth-syst-sci.net/ 17/4789/2013/hess-17-4789-2013-supplement.pdf.
Acknowledgements. The research was supported by Academic
Research Fund (AcRF) Tier 1 from the Singapore Ministry of Education (MOE) (FRC grant R-302-000-007-112).
Edited by: A. Shamseldin
References
Antrop, M.: Landscape change and the urbanization process in Europe, Landsc. Urban Plann., 67, 9–26, doi:10.1016/s0169-2046(03)00026-4, 2004.
Barron, O. V., Barr, A. D., and Donn, M. J.: Effect of urbanisation on the water balance of a catchment with shallow groundwater, J. Hydrol., 485, 162–0176, doi:10.1016/j.jhydrol.2012.04.027, 2013.
Bengtsson, L., Grahn, L., and Olsson, J.: Hydrological function of a thin extensive green roof in southern Sweden, Nord. Hydrol., 36, 259–268, 2005.
Bliss, D. J., Neufeld, R. D., and Ries, R. J.: Stormwater runoff mitigation using a green roof, Environ. Eng. Sci., 26, 407–417, doi:10.1089/ees.2007.0186, 2009.
Carter, T. L. and Rasmussen, T. C.: Hydrological behavior of veg-etated roofs, JAWRA J. Am. Water Resour. Assoc., 42, 1261– 1274, doi:10.1111/j.1752-1688.2006.tb05299.x, 2006.
Chang, C. L., Lo, S. L., and Huang, S. M.: Optimal strategies for best management practice placement in a synthetic watershed, Environ. Monit. Assess., 153, 359–364, doi:10.1007/s10661-008-0362-y, 2009.
Chow, V. T.: Open-Channel Hydraulics, McGraw-Hill, 1959. Collin, M. L. and Melloul, A. J.: Assessing groundwater
vulnera-bility to pollution to promote sustainable urban and rural devel-opment, J. Cleaner Product., 11, 727–736, doi:10.1016/s0959-6526(02)00131-2, 2003.
Czemiel Berndtsson, J.: Green roof performance towards manage-ment of runoff water quantity and quality: A review., Ecol. Eng., 36, 351–360, doi:10.1016/j.ecoleng.2009.12.014, 2010. Davis, A.: Field performance of bioretention: Hydrology
im-pacts, J. Hydrol. Eng., 13, 90–95, doi:10.1061/(ASCE)1084-0699(2008)13:2(90), 2008.
DeFries, R. and Eshleman, K. N.: Land-use change and hydrologic processes: a major focus for the future, Hydrol. Process., 18, 2183–2186, doi:10.1002/hyp.5584, 2004.
Dietz, M. E. and Clausen, J. C.: Stormwater runoff and ex-port changes with development in a traditional and low impact subdivision, J. Environ. Manage., 87, 560–566, doi:10.1016/j.jenvman.2007.03.026, 2008.
Dow, C. L. and DeWalle, D. R.: Trends in evaporation and Bowen ratio on urbanizing watersheds in eastern United States, Water Resour. Res., 36, 1835–1843, 2000.
Du, J., Qian, L., Rui, H., Zuo, T., Zheng, D., Xu, Y., and Xu, C. Y.: Assessing the effects of urbanization on annual runoff and flood events using an integrated hydrological modeling system for Qinhuai River basin, China, J. Hydrol., 464–465, 127–139, doi:10.1016/j.jhydrol.2012.06.057, 2012.
Elliott, A., Trowsdale, S., and Wadhwa, S.: Effect of aggregation of on-site stormwater control devices in an urban catchment model, J. Hydrol. Eng., 14, 975–983, doi:10.1061/(ASCE)HE.1943-5584.0000064, 2009.
Endreny, T. A.: Evaporation, in: Water Encyclopedia, John Wiley & Sons, Inc, 2005.
Freeze, R. A. and Cherry, J. A.: Groundwater, Englewood Cliffs, New Jersey, Prentice Hall, 1979.
Göbel, P., Stubbe, H., Weinert, M., Zimmermann, J., Fach, S., Dierkes, C., Kories, H., Messer, J., Mertsch, V., Geiger, W. F., and Coldewey, W. G.: Near-natural stormwater management and its effects on the water budget and groundwater surface in urban areas taking account of the hydrogeological conditions, J. Hy-drol., 299, 267–283, doi:10.1016/j.jhydrol.2004.08.013, 2004. Haase, D.: Effects of urbanisation on the water balance – A
long-term trajectory, Environ. Impact Assess. Rev., 29, 211–219, doi:10.1016/j.eiar.2009.01.002, 2009.
Hathaway, A., Hunt, W. F., and Jennings, G.: A field study of green roof hydrologic and water quality performance, Trans. ASABE, 51, 37–43, 2008.
Holman-Dodds, J. K., Bradley, A. A., and Potter, K. W.: Evalua-tion of hydrologic benefits of infiltraEvalua-tion based urban stormwater
management, J. Am. Water Resour. Assoc. (JAWRA), 39, 205– 215, doi:10.1111/j.1752-1688.2003.tb01572.x, 2003.
Hutchinson, D., Abrams, P., Retzlaff, R., and Liptan, T.: Stormwater monitoring two ecorrofs in Portland, Oregon, USA, in: Greening Rooftops for Sustainable Communites, Chicago, 2003.
Ives, D. W.: Soil of the Republic of Singapore, in: New Zealand Soil Bureau Scientific Report, Soil Bureau, Lower Hutt, New Zealand, 1977.
James, M. and Dymond, R.: Bioretention hydrologic performance in an urban stormwater network, J. Hydrol. Eng., 17, 431–436, doi:10.1061/(ASCE)HE.1943-5584.0000448, 2012.
Klöcking, B. and Haberlandt, U.: Impact of land use changes on wa-ter dynamics—-a case study in temperate meso and macroscale river basins, Phys. Chem. Earth, Parts A/B/C, 27, 619–629, doi:10.1016/s1474-7065(02)00046-3, 2002.
Konrad, C. P. and Booth, D. B.: Hydrologic changes in urban streams and their ecological significance, in: American Fisheries Society Symposium, Alaska, 157–177, 2005.
Lerner, D. N.: Groundwater recharge in urban areas, in: Hydrolog-ical Processes and Water Management in Urban Areas, IAHS, 1990.
Lu, X. X., Wong, P. P., and Chou, L. M.: Singapore’s Biophysical Environment, Singapore, The McGraw Hill, 2005.
Mentens, J., Raes, D., and Hermy, M.: Green roofs as a tool for solving the rainwater runoff problem in the ur-banized 21st century?, Landsc. Urban Plann., 77, 217–226, doi:10.1016/j.landurbplan.2005.02.010, 2006.
Moran, A., Hunt, B., and Jennings, G.: A north Carolina field study to evaluate greenroof runoff quantity, runoff quality, and plant growth, in: 2nd Greening Rooftops for Sustainable Communities Conference, Portland, 446–460, 2004.
Ngo, K. M., Turner, B. L., Muller-Landau, H. C., Davies, S. J., Lar-javaara, M., Nik Hassan, N. F. b., and Lum, S.: Carbon stocks in primary and secondary tropical forests in Singapore, Forest Ecol. Manage., 296, 81–89, doi:10.1016/j.foreco.2013.02.004, 2013. NPark: Greenery provision for roadside, N. P. Board (N. P. Board),
Singapore, 2011.
Oberndorfer, E., Lundholm, J., Bass, B., Coffman, R. R., Doshi, H., Dunnett, N., Gaffin, S., KÖHler, M., Liu, K. K. Y., and Rowe, B.: Green roofs as urban ecosystems: Ecological structures, func-tions, and services, BioScience, 57, 823–833, 2007.
Ott, B. and Uhlenbrook, S.: Quantifying the impact of land-use changes at the event and seasonal time scale using a process-oriented catchment model, Hydrol. Earth Syst. Sci., 8, 62–78, doi:10.5194/hess-8-62-2004, 2004.
Palla, A., Gnecco, I., and Lanza, L. G.: Hydrologic restoration in the urban environment using green roofs, Water, 2, 140–154, 2010. Palla, A., Gnecco, I., and Lanza, L. G.: Compared performance of a
conceptual and a mechanistic hydrologic models of a green roof, Hydrol. Process., 26, 73–84, doi:10.1002/hyp.8112, 2012. PUB: ABC waters master plan for the central catchment, in: ABC
Waters Master Plan, Public Utility Board (Water), Singapore, 2007.
PUB: Design guidelines Public Utilities Board, Singapore, 2011. Rezaur, R. B., Rahardjo, H., Leong, E. C., and Lee„ T. T.:
Hydro-logic behavior of residual soil slopes in Singapore, J. Hydrol. Eng., 8, 133–144, 2003.
hydrological approach, Hydrol. Process., 15, 1441–1457, doi:10.1002/hyp.218, 2001.
Rowe, D., Rugh, C., VanWoert, N., Monterusso, M., and Russell, D.: Green roof slope, substrate depth, and vegetation influence runoff, in: 1st North American Green Roof Conference: Green-ing Rooftops for Sustainalbe Communities, Chicago, 354–362, 2003.
Sanders, R. A.: Urban vegetation impacts on the hydrology of Dayton, Ohio, Urban Ecol., 9, 361–376, doi:10.1016/0304-4009(86)90009-4, 1986.
Schoonover, J. E., Lockaby, B. G., and Helms, B. S.: Impacts of land cover on stream hydrology in the West Georgia Piedmont, USA, J. Environ. Qual., 35, 2123–2131, 2006.
Štofko, P.: Relationships between the parameters of aboveground parts and the parameters of root plates in Norway spruce with respect to soil drainage, J. FOR. SCI, 56, 353–360, 2010. URA: Singapore Master Plan in 2003 Urban Redevelopment
Au-thority Singapore, 2003.
USGS: USGS Global Visualization Viewer USGS Global Visual-ization Viewer Virginia, 2010.
VanWoert, N. D., Rowe, D. B., Andresen, J. A., Rugh, C. L., Fer-nandez, R. T., and Xiao, L.: Green roof stormwater retention: Effects of roof surface, slope and media depth, J. Environ. Qual., 34, 1036–1044, doi:10.2134/jeq2004.0364, 2005.
Villarreal, E. L., Semadeni-Davies, A., and Bengtsson, L.: Inner city stormwater control using a combination of best management practices, Ecol. Eng., 22, 279–298, doi:10.1016/j.ecoleng.2004.06.007, 2004.
Wang, Y., Choi, W., and Deal, B. M.: Long-term impacts of land-use change on non-point source pollutant loads for the St. Louis Metropolitan Area, USA, Environ. Manage., 35, 194–205, 2005. Wells, N.: The role of soils in the utilisation of sewage sludge in Singapore, in: New Zealand Soil Bureau Scientific Report, Soil Bureau, Lower Hutt, New Zealand, 1977.
Xiao, Q. and McPherson, E. G.: Performance of engineered soil and trees in a parking lot bioswale, Urban Water J., 8, 241–253, doi:10.1080/1573062x.2011.596213, 2011.