EXPERIMENTAL AND NUMERICAL INVESTIGATION OF FLOW
AROUND A SPHERE WITH DIMPLES FOR VARIOUS
FLOW REGIMES
by
Jasmina B. BOGDANOVI]-JOVANOVI]*, ivojin M. STAMENKOVI],
and Miloš M. KOCI]
Faculty of Mechanical Engineering, University of Ni{, Ni{, Serbia
Original scientific paper DOI: 10.2298/TSCI120412115B
Flow over a sphere is a typical bluff-body flow with many engineering applications. However, it has not been studied in depth, as compared to flow over a circular cyl-inder, because of the difficulties in the experimental set-up as well as in the compu-tational approach for studying flow over a sphere. The main challenges are to un-derstand the flow hydrodynamics and to clarify the flow pattern around a dimpled sphere because the flow pattern complying with the dimple structure on its surface is very complicated. In this paper experimental and numerical investigations of the fluid flow around a sphere with dimples, are represented. The sphere with dimples is placed in a quadratic cross-section duct (measuring section) and numerical sim-ulation results are obtained by solving RANS equations. Furthermore, experimen-tal measurements are carried out using a laser-Doppler anemometer. Experimenexperimen-tal and numerical results of flow velocity fields were compared for three different flow regimes (Re = 8·103, 2·104, and 4·104). Numerical investigation was performed for wide range of Reynolds numbers (Re = 270·106). The final purpose of this paper is experimental and numerical determination of velocity field, separation point, pres-sure and drag coefficient, the length of reverse flow region in the wake and RANS turbulent model which gives the best results for engineering practice.
Key words: sphere with dimples, laser-Doppler anemometry, numerical simulation
Introduction
Lowering the drag associated with a bluff body such as a sphere is of both fundamental and practical importance. For example, when designing a golf ball, dimples are created on its surface to lower the Reynolds number, at which the drag crisis occurs, enabling it to travel a lon-ger distance compared to its smooth surface counterpart. It is now known that the standardized dimple design has not been optimized to give the golf ball the best aerodynamic performance. This appears to be partially due to the fact that turbulence has not been carefully considered in the classical design.
In this paper it is investigated experimentally how the surface roughness affects the drag on a sphere. It is examined how pressure and velocity varies around a sphere with a rough
merical data can be found in existing literatures and papers [1-6]). The flow pattern around a sphere, particularly in the wake region, varies with the Reynolds number. For 103< Re < 105, the vortex loop shedding becomes nearly a continuous process, [7]. Experimental investigation and flow visualization, [8, 9], shows that the far wake region continues to grow in size and produces a wave-like motion. As we approach the critical Reynolds number, Recr»3.5·105, the boundary layer around the sphere transits from laminar to turbulent, leading to the increased momentum near the boundary and the delay in flow separation as showed by Cengelet al.[10]. The wake re-gion becomes narrower, resulting in a sudden reduction in the drag coefficient [11]. Although several studies have been experimentally and numerically conducted for understanding the characteristics of flow over a sphere, there have been only a few works on control of flow over a sphere using passive and active devices [12-16]. As for passive devices, Achenbach [12] and Bearmanet al. [13] applied surface roughness and dimples on the sphere, respectively. It is well known that the relation between the Reynolds number and the drag coefficient of a sphere have the sub-critical, the critical and the super-critical region. In the sub-critical region, the drag coef-ficient shows constant value. In the critical region, the drag coefcoef-ficient decreases suddenly and reaches a minimum value. In the super-critical region, the drag coefficient gradually increases after suddenly decrease. Also, it is known that the critical region is influenced by the surface structures which are the roughness and the dimple,etc. The turbulence transition on flow is pro-moted by these surface structures, as a result, the critical region shifts to the lower Reynolds number. If an optimum surface structure for reducing the drag is clarified, the flow resistance will be able to be controlled effectively.
Achenbach [12] and Bearmanet al. [13] studies achieved maximum drag reduction of nearly 50% in the sub-critical region, but the drag-reduction pattern by dimples was essentially different from that by surface roughness. That is, maximum drag reduction by dimples is main-tained over a broad range of Reynolds numbers in the sub-critical region, whereas surface roughness produces maximum drag reduction only in a very narrow range of the Reynolds num-bers. However, the relation between the drag and the flow pattern around a sphere with surface structures has many uncertainly parts because the flow around a sphere with surface structures is complex.
To the best of our knowledge, however, the detailed mechanism responsible for drag reduction by dimples or surface roughness has not been clearly presented yet, although it is be-lieved to be associated with triggering the boundary-layer instability. This is mainly due to the measurement difficulty near the sphere surface.
Experimental set-up and measurements
Velocity measurements around a sphere with dimples have been carried out in the wa-ter tunnel, using LDA.
The LDA, is probably the most effective and widest applied non-intrusive method in experimental investigations of flows and flow dynamics. It represents an optical, state of the art method commonly with high measurement accuracy. As a result of fundamental developments and the developments of hardware and software, the LDA method has been established to be a very efficient and high accuracy optical technique for flow measurements, especially for inves-tigations of complex turbulent flows. The special properties of the gas laser, which provides monochromatic, coherent, linearly polarized light wave of low-divergence beam (Gaussian dis-tribution), make the LDA appropriate and highly accurate method for flow velocity measure-ments [19, 20]. The LDA measurement error is
ex-tensively analyzed by Zhang [21]. As the measurement is performed through a flat glass fringe distortion effect is ignored and the measurement er-ror caused by velocity bias effect have maximum value of 1.5%. The measuring interval was set to 60 seconds, or/and 2000 particles.
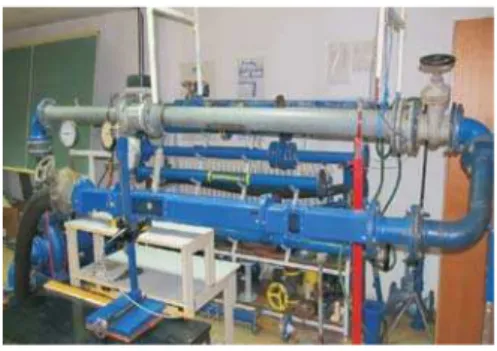
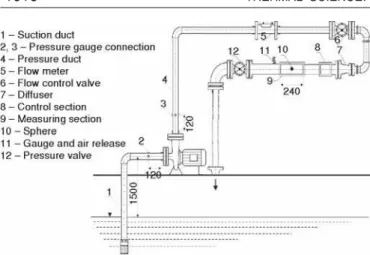
The test set-up with open water circulation loop, made for this and similar purposes in the Labo-ratory of Hydraulic and Pneumatic Research of the Faculty of Mechanical Engineering, University of Nis, Serbia, is shown in fig. 1. In fig. 2 is shown the test set-up schema with its essential parts.
For the water velocity measurements the backscatter DANTEC laser-doppler system, (flowlite LDA) was used with BSA F60 signal processor in coincidence mode. Basic operating parameters of LDA system are: the measuring volume is 0.05´0.05´0.43 mm (dx=dy= 0.05 mm,dz= 0.43 mm), the distance between the laser beams at the transmitting lens is 38.4 mm, Gaussian beam diameterdo= 2.2 mm (beam “waist”), and the focal length of the laser beams is 160 mm. LDA system is connected directly to the signal processor, which transmits information to the computer, where special software processes data in real time. Measured velocity values at any point of flow domain are obtained either by direct software process of the signal or as a product of Doppler frequency (fd) and calibration constant of LDA system (c).
Normal impurities in the water provide sufficient concentration of particles and there is no need for additional seeding.
The measuring section of the experimental set-up is placed in the quadratic ducta= 92.5 mm, and its length is 240 mm. The total length of the quadratic section is equal to 18a, and at the entrance of the section flow straighter is placed in order to obtain uniform velocity distri-bution. Measuring of the incoming flow velocity profile and turbulence intensity is carried out in the front window (fig. 2). The measured free stream turbulence intensity is in the range from 3 to 5%.
The diameter of the sphere with dimples (D) is 38 mm. Dimples are arc type shaped, where the width of dimple isd= 3.5 mm, the depth of dimple ish= 0.4 mm, and the distance be-tween dimples isb= 0.4 mm (fig. 3).
The desired discharge is ob-tained adjusting the pump speed by using a variable-fre-quency drive. For the purpose of this investigation, the experi-mental setup has been operat-ing in the range ofU0= 0.2 m/s to 1.2 m/s, obtaining Reynolds number from 8·103to 4·104.
Numerical simulations
Numerical simulations of the flow around a sphere with dimples have been carried out using ANSYS CFX software, in a procedure beginning with creating a geometrical model of the measuring section, generating a discretization mesh and defining all necessary pre-processing parameters, such as boundary conditions, turbulent models, fluid properties and other physical parameters. The software used for numerical simulation is based on finite volume method, en-abling the division of numerical domain into the sub-regions or control volumes. The discretized governing equations are iteratively solved over each control volumes. As a result, an approximation of each value of each variable at specific points through the domain can be ob-tained, enabling the insight into the fluid flow behavior through the entire numerical domain.
The generated discretization mesh is non-uniforme, created of approximately 750000 nodes and 1700000 elements, which are composed of: tetrahedral and prismatic control vol-umes, taking into account the structure of the mesh, especially in the area around the sphere with dimples.
Grid sensitive quantities such as the drag and lift coefficients are checked and com-pared with literature [22, 23] in order to ensure that the results are grid-independent. The grid density near the solid wall for a given Reynolds number should be fine enough to resolve the smaller scale eddies that arise via shear layer instabilities. Here, the grid Reynolds number of
y+ = 1 is used for the very first grid point from the wall to have the best prediction of the flow field (fig. 4).
Figure 3. Sphere geometry
Once the fluid domain has been meshed, the governing equations (in integral form) are applied to each discrete control volume and used to construct a set of non-linear algebraic equa-tions for the discrete dependent variables. Calculation procedure stores discrete values of the variables at the cell centers, however values of the variables are required at the cell faces for the convection terms in the equations and these must be interpolated from the cell centre values. This is accomplished using an high resolution scheme, where the advective flux is evaluated us-ing the values from the upwind node, based on the boundedness principles used by Barthet al.
[24]. Numerical simulations convergence criteria were that root mean square values of the equa-tion residuals are lower than 10–5. The velocity field around the sphere with dimples is obtained solving RANS equations. In order to select the most adequate turbulence model, the different flow regimes (8·103 < Re < 4·104), has been numerically simulated with different turbulence models – (k-e,k-w, shear stress transport (SST) and baselinek-wmodel BSL). It is well known that RANS models yield prediction of useful accuracy in attached flows and they fail to accu-rately capture the complex flow structures in regimes substantially different from the thin shear and attached boundary layers. Striving to obtain results that are more precise for the separation point and flow field in the wake reverse flow the detached eddy simulation (DES)i. e. hybrid RANS-LES approach is used. DES models were developed to combine the fine tuned RANS methodology in the attached boundary layers with the power of LES in the shear layers and sep-arated flow regions at realistic Reynolds numbers [25, 26]. Further on in the text will be more of numerically obtained results and comparison with experimental ones.
Numerous numerical results are post-processed and data from point values to complex animated sequences are obtained. The visualization and results analysis was carried out in order to obtain: quantitative numerical data of discrete values, vector plots, streamlines, visualization of the variation of scalar variables, animation of flow parameter variation for transient numeri-cal simulations, different charts showing graphinumeri-cal plots of variables,etc.
Analysis of experimental and numerical results
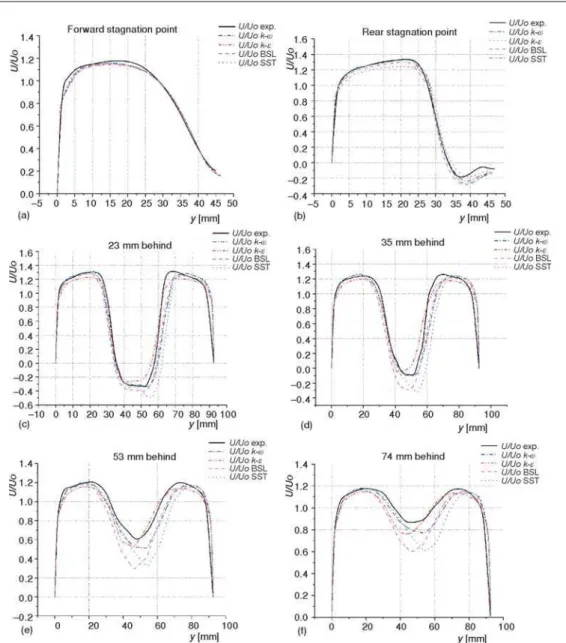
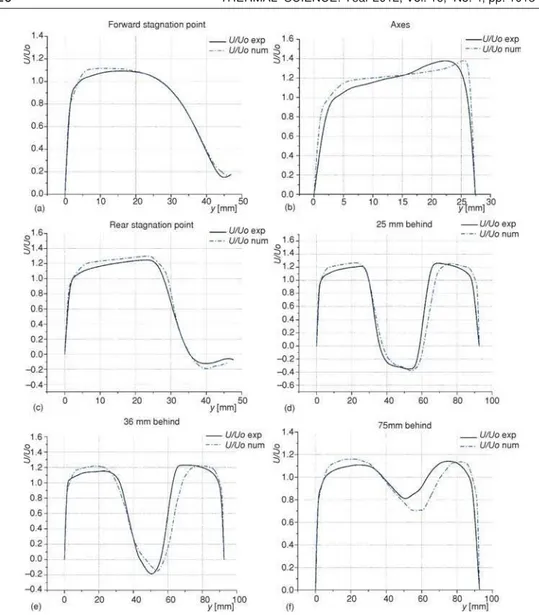
Comparison of experimentally and numerically obtained dimensionless velocity pro-files around the sphere with dimples for several different cross-sections and different turbulence models are presented in fig. 5.
Four different turbulence models have been tested and validated against experimental data. For Re = 20000 numerical simulations for different turbulence models were carried out in order to observe which one obtains the best profile coincidence. For various cross-section com-pared, it was concluded that the best results are obtained withk-wturbulence model (fig. 5).
Thek-eturbulence model is proven to be unsuitable for flows with boundary layer sep-aration and flows over curved surfaces. On the other hand SST and BSL turbulence models, which showed very good agreement in the case of smooth sphere [27], for the flow around the sphere with dimples, results in lower velocities, especially in the area of vortex shedding. There-fore, numerical simulations for other flow regimes were performed usingk-wturbulence model.
For Re = 8·103comparison of numerically end experimentally obtained velocity pro-files around the sphere with dimples are shown in fig. 6.
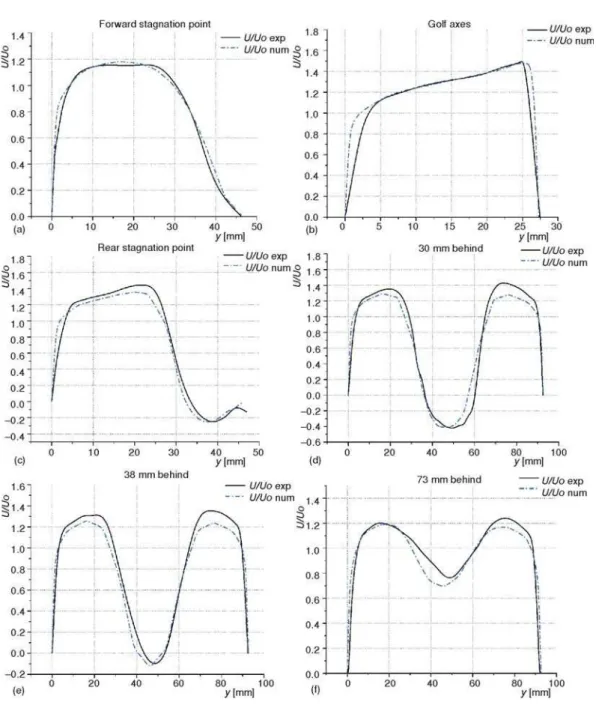
For Re = 4·104comparison of numerically end experimentally obtained velocity pro-files around the sphere with dimples are shown in fig. 7.
The comparison in fig. 7, as it was the case in fig. 6 as well, shows satisfying agree-ment between experiagree-mentally and numerically obtained results for axial velocities. The major difference in results, for both flow regimes, appears in the areas near the duct wall and behind the sphere as well, which indicates the necessity to apply unsteady simulations (URANS, DES or LES) in order to adequately resolve shedding mechanisms and wake frequencies.
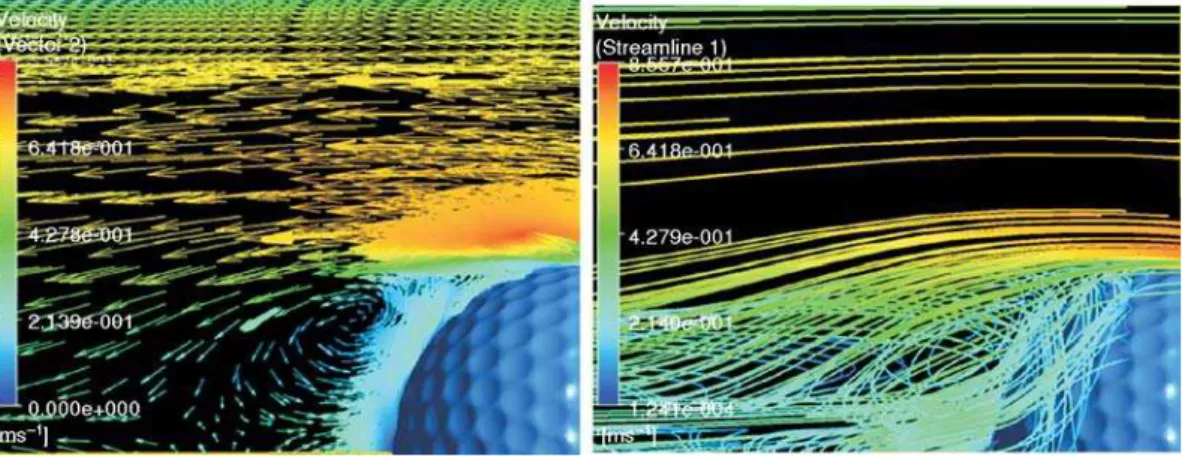
Velocity vectors and streamlines are shown in figs. 8, 9, and 10, for all three measured flow regimes, Re = 8·103, Re = 2·104, and Re = 4·104. This visualization can lead to certain con-clusions about position of flow separation point. By means of diagram for wall shear and pres-sure gradient on the studied sphere with dimples, obtained by numerical simulations, the separa-tion point is estimated for all numerically investigated flow regimes.
The position of separation point, defined as an angle measured from the forward stag-nation point (fs) is given in tab. 1, for various flow regimes. The results show slightly larger sep-aration angles compared to the smooth sphere, as expected, but the trend is very similar in func-tion of the Reynolds number [28].
Table 1. Flow separation angle
Re 270 4·103 8·103 2·104 4·104 105 5·105 106
fs 117 100 ± 1 92 ± 1 92 ± 1 94 ± 1 104 ± 2 118 ± 2 120 ± 2 Figure 7. Comparison of experimentally and numerically obtained velocity profiles
Figure 10. Velocity vectors and streamlines for Re = 4·104 (for color image see journal web site)
Figure 9. Velocity vectors and streamlines for Re = 2·104
(for color image see journal web site)
the length of this zone is defined as point where the averaged velocity obtained for the 2000 par-ticles is equal to zero. It is the minimal length of re-circulation zone measured from the sphere axes. The other approach is to find the measuring cross-section containing all positive flow ve-locity values for particles, and such obtain re-circulation zone has increased length then previ-ous one.
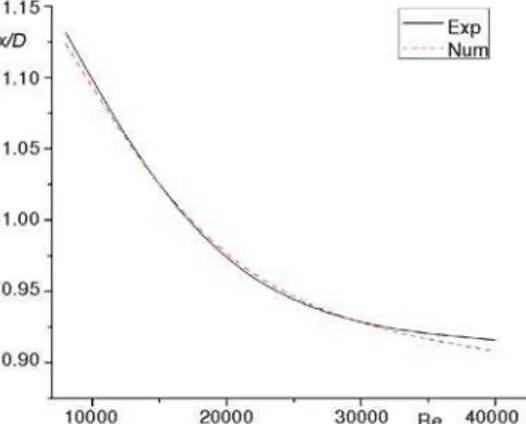
The relative length of re-circulation zone (x/D), according to the defined criterion, was also obtained using numerical simulations for all three investigated flow regimes, and these re-sults were compared in the diagram (fig. 11) showing excellent agreement. It is noticeable re-duction of relative length of re-circulation zone (x/D) with Reynolds number increase, and for 8·103
£Re£4·104,x/D= 1.12-0.92.
Numerical simulation was carried out for larger Re numbers as well, up to 106, showing decreasing of re-circulation zone length. For largest investigated Reynolds number, Re = 106, the length of re-circulation zone reduces to ap-proximately 31 mm, measured from the sphere axes,i. e. x/D= 0.815, as shown in fig. 12.
Measured and numerically obtained water ve-locity along the sphere with dimples (using RANS and DES numerical simulations), in the mid-sec-tion of the tunnel from the forward to the rear stag-nation point, and for the flow regime Re = 2·104, is shown in fig.13.
The vortices on dimpled surfaces are created inside the concave cavities. The flow separates at the leading edge of the dimple and the sepa-rated shear layer is drawn into the dimple cavity where it reattaches downstream. As the Rey-nolds number increases, the re-circulation zone gains in strength and extends further down-stream in the dimple before re-attachment. The vortices created near the dimples causes a signif-icant pressure distribution and velocity gradi-ents, and as a consequence, it is expected that the strong velocity and pressure fluctuations take place. We consider therefore the velocity distribu-tion from the forward to the rear stagnadistribu-tion point at the sphere surface may serve as a good test case for DES and RANS model and also for the investigation on the relationship between the Figure 11. Relative length of recirculation
zone (x/D) obtained numerically (- - -) and experimentally (____)
large-scale vortical structure and the contribution of the velocity-pressure correlation in the bal-ance of turbulence characteristics,e. g. the turbulent kinetic energy and the Reynolds stress. The obtained results show a similar trends but the numerical values in some sections have a very large deviation. For this reason our future research will be devoted to analyzing this problem.
The pressure coefficient distribution is shown in fig. 14, for RANS and DES numerical sim-ulations for three flow regimes around the sphere with dimples. In the fig. 14 is also presented the pressure coefficient for smooth sphere diameter 40 mm, obtained by DES numerical simula-tions [29].
The computations of the coefficient of pressure are in good agreement with the experi-mental results from Aokiet al. [18]. The value and angular position of the minimum inCpis ac-curately captured by DES and RANS model. The magnitude of the minimum pressure value is over predicted with RANS model and more accurate results are obtained with DES model. The pressure coefficients at the separation region and the recovery region is slightly lower in the case of RANS model which confirms that
DES simulations gives better predic-tion of flow in this zone. In our previ-ous work [27, 29] the DES model was tested for the flow over smooth sphere and this results shows the ex-cellent agreement with experimental and numerical results presented in numerous papers.
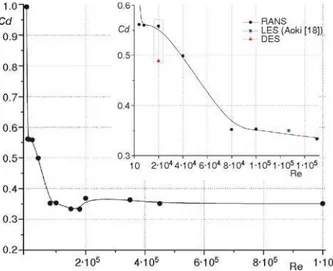
Figure 15 shows the variations of the drag coefficient owing passive control with dimples as a function of the Reynolds number. It is shown in Achenbach [12] that, with surface roughness, the drag coefficient de-creases sharply and then inde-creases rapidly with increasing Reynolds number, showing a local minimum at Figure 13. Velocity from the forward to the rear stagnation point, Re = 2·104
Figure 14. Pressure coefficient,Cp
small errors in the pressure field will produce large errors in the predicted drag coefficient. There are several important decisions that has to be made before a numerical simulation can be performed. Choice of mesh density, mesh distribution, discretization scheme and turbulence model are all important factors for the accuracy of the result. Usually the high mesh density gives better prediction of the drag but unfortunately, high mesh density demands large computer resources, and high-order numerical schemes and complex turbulence models can cause numer-ical instability problems. Results presented at the fig. 15 shows that DES model gives slightly less value of drag coefficient, which more coincides with the experimental results obtained by Aokiet al. [18]. The only problem with DES simulations is the time required to carry out simula-tions for one flow regime, and in this case, the time required for one simulation is approximately 72 hours.
Conclusions
The following conclusions have been drawn from the work presented here:
· The geometry of dimple has significant effects on aerodynamic properties of the sphere with dimples.
· The relative length of re-circulation zone reduces, from x/D = 1.4, for Re = 270, to approximatelyx/D= 0.815 for Re = 106, where distancexis measured from the sphere axes. The reduction of relative length with Reynolds number enlargement has approximately logarithmic character.
· Due to complex dimple geometry, the critical region of a dimpled sphere shifts toward a lower Reynolds number compared to that of a smooth ball. Therefore, the dimpled sphere faces relatively lower drag at low speeds.
· The reducing of drag for the analyzed geometry of dimples is about 30% and for the wide range of Reynolds number, this coefficient remains almost constant.
· When the flow along the surface of a sphere enters a dimple, a small separation bubble is formed in the concave cavities. The consequence of the bubbles formation is the acceleration of the flow between the dimples on the surface of the sphere and the boundary layer undergoes a transition from laminar to turbulent. This transition leads to a delay of the separation of flow from the sphere surface causing a substantial reduction in the drag force. · In future work, special attention must be paid to the numerical simulations and experimental
study of flow in the vicinity of the dimples in order to clarify the detailed mechanism responsible for drag reduction by dimples or surface roughness.
Acknowledgments
References
[1] Shepherd, C. B., Lapple, C. E., Flow Pattern and Pressure Drop in Cyclone Dust Collectors, Industrial & Engineering Chemistry,32(1940), 9, pp. 1246-1248.
[2] Torobin, L. B., Gauvin, W. H., Fundamental Aspects of Solids-Gas Flow, Part II: the Sphere Wake in Steady Laminar Fluids,The Canadian Journal of Chemical Engineering, 37(1959), 5, pp. 167-176 [3] Clift, R., Gauvin, W. H., The Motion of Particles in Turbulent Gas Streams,Proceedings,Chemeca ’70: A
Conference Convened by the Australian National Committee of the Institution of Chemical Engineers and the Australian Academy of Science, Melbourne and Sydney, Australia, 1970, Vol. 1, pp. 14-28
[4] Clift, R., Gauvin, W. H., Motion of Entrained Particles in Gas Streams,The Canadian Journal of Chemical Engineering, 49(1971), 4, pp. 439-448
[5] Achenbach, E., Experiments on the Flow Past Spheres at Very High Reynolds Numbers,Journal of Fluid Mechanics, 54(1972), 3, pp. 565-575
[6] Schlichting, H., Boundary Layer Theory, McGraw-Hill, New York, USA, 1979 [7] Lamb, H., Hydrodynamics, 6thed., Dover Publications, New York, USA, 1945
[8] Baki}, V., Peri}, M., Visualization of Flow Around Sphere for Reynolds Numbers between 22000 and 400000,Thermophysics and Aeromechanics, 12(2005), 3, pp. 307-315
[9] Baki}, V., Schmid, M., Stankovi},B., Experimental Investigation of Turbulent Structures of Flow Around a Sphere,Thermal Science, 10(2006), 2, pp. 97-112
[10] Cengel, Y. A., Cimbala, J. M., Fluid Mechanics: Fundamentals and Applications, McGraw-Hill Science, New York, USA, 2006
[11] Schlichting, H., Calculation of Smooth, Incompressible Flow for a Given Planar Blade Cascade, Verein Deutscher Ingenieure –VDI Zeitschrift, 447(1955), 35, pp. 269-280
[12] Achenbach, E., The Effect of Surface Roughness and Tunnel Blockage on the Flow Past Spheres,Journal of Fluid Mechanics, 65(1974), 1, pp.113-125
[13] Bearman, P. W., Harvey, J. K., Golf ball Aerodynamics, Aeronautical Quarterly, 27(1976), May, pp. 112-122
[14] Kim, H. J., Durbin, P. A., Observations of the Frequencies in a Sphere Wake and of Drag Increase by Acoustic Excitation,Physics of Fluids, 31(1988), 11, pp. 3260-3265
[15] Suryanarayana, G. K., Meier, G. A., Effect of Ventilation on the Flow Field Around a Sphere,Experiments in Fluids, 19(1995), 2, pp. 78-88
[16] Suryanarayana, G. K., Prabhu, A., Effect of Natural Ventilation on the Boundary-Layer Separation and Near-Wake Vortex Shedding Characteristics of a Sphere,Experiments in Fluids, 29 (2000), 6, pp. 582-591
[17] Ting, L. L., Effects of Dimple Size and Depth on Golf Ball Aerodynamic Performance,Proceedings,4th
ASME-JSME Joint Fluids Engineering Conference FEDSM’03, Honolulu, Hi., USA, 2003, pp. 514-529 [18] Aoki, K.,et al., Aerodynamic Characteristic and Flow Pattern on Dimples Structure of a Sphere, Flucome
Proceedings, 10thInternational Conference on Fluid Control, Measurements and Visualization, Moscow,
Russia, 2009
[19] Durst, F., Melling, A., Whitelaw, J. H., Principles and Practice of Laser-Doppler Anemometry, Academic Press Inc., London, New York, USA, 1981
[20] Jovanovic, J.,et al., The Effect of Polymers on the Dynamics of Turbulence in a Drag Reduced Flow,
Thermal Science, 9(2005), 1, pp. 13-41
[21] Zhang, Z., LDA Application Methods: Laser Doppler Anemometry for Fluid Dynamics, Heidelberg, Springer, Berlin, 2010
Nomenclature
Cd – drag coefficient (4F)(0.5rU D02 2p), [–]
Cp – pressure coefficient (po–p)/(0.5rU02), – [–]
D – diameter of the sphere with dimples, –D= 38 mm
U – flow velocity, [ms–1]
Uo – free stream velocity, [ms–1]
Re – Reynolds number (UoD/n), [–]
x/D – relative length of re-circulation zone, [–]
x – longitudinal co-ordinate
y – transversal co-ordinate
[26] Strelets, M., Detached Eddy Simulation of Massively Separated Flows, 39thAIAA Aerospace Sciences
Meeting and Exhibit, 2001, AIAA-2001-0879
[27] Bogdanovic-Jovanovic J., Stamenkovic Z., Bogdanovic B., Numerical and Experimental Results of Fluid Velocity Field around a Smooth Sphere Using Different Turbulence Models,Proceedings,International Conference, Mechanical Engineering in XXI Century, 2010, Nis, Serbia, pp. 103-106
[28] Constantinescu, G., Squires, D., LES and DES Investigations of Turbulent Flow over a Sphere (2000), AIAA 2000-0540, pp. 1-11
[29] Bogdanovic-Jovanovic J., Stamenkovic Z., Bogdanovic B., Influence of Duct Cross-Section on the Flow Characteristics around a Smooth Sphere,Proceedings, Third Serbian (28thYu) Congress on Theoretical
and Applied Mechanics, Vlasina Lake, Serbia, 2011, Section B, pp. 222-235