CPD
9, 3825–3870, 2013Greenland accumulation links to
atmospheric circulation
N. Merz et al.
Title Page
Abstract Introduction
Conclusions References
Tables Figures
◭ ◮
◭ ◮
Back Close
Full Screen / Esc
Printer-friendly Version Interactive Discussion
Discussion
P
a
per
|
D
iscussion
P
a
per
|
Discussion
P
a
per
|
Discuss
ion
P
a
per
Clim. Past Discuss., 9, 3825–3870, 2013 www.clim-past-discuss.net/9/3825/2013/ doi:10.5194/cpd-9-3825-2013
© Author(s) 2013. CC Attribution 3.0 License.
Open Access
Climate of the Past
Discussions
Geoscientiic Geoscientiic
Geoscientiic Geoscientiic
This discussion paper is/has been under review for the journal Climate of the Past (CP). Please refer to the corresponding final paper in CP if available.
Greenland accumulation and its
connection to the large-scale atmospheric
circulation in ERA-Interim and
paleo-climate simulations
N. Merz1,2, C. C. Raible1,2, H. Fischer1,2, V. Varma3, M. Prange3, and
T. F. Stocker1,2
1
Climate and Environmental Physics, University of Bern, Bern, Switzerland 2
Oeschger Centre for Climate Change Research, University of Bern, Bern, Switzerland 3
MARUM – Center for Marine Environmental Sciences and Faculty of Geosciences, University of Bremen, Bremen, Germany
Received: 13 June 2013 – Accepted: 25 June 2013 – Published: 9 July 2013
Correspondence to: N. Merz ([email protected])
CPD
9, 3825–3870, 2013Greenland accumulation links to
atmospheric circulation
N. Merz et al.
Title Page
Abstract Introduction
Conclusions References
Tables Figures
◭ ◮
◭ ◮
Back Close
Full Screen / Esc
Printer-friendly Version Interactive Discussion
Discussion
P
a
per
|
D
iscussion
P
a
per
|
Discussion
P
a
per
|
Discuss
ion
P
a
per
|
Abstract
Accumulation and aerosol chemistry records from Greenland ice cores offer the poten-tial to reconstruct variability in Northern Hemisphere atmospheric circulation over the last millennia. However, an important prerequisite for a reconstruction is the stable re-lationship between local accumulation at the ice core site with the respective circulation
5
pattern throughout the reconstruction period. We address this stability issue by using a comprehensive climate model and performing time-slice simulations for the present, the pre-industrial, the early Holocene and the last glacial maximum (LGM). The rela-tionships between accumulation, precipitation and atmospheric circulation are investi-gated on on various time-scales. The analysis shows that the relationship between
lo-10
cal accumulation on the Greenland ice sheet and the large-scale circulation undergoes a significant seasonal cycle. As the weights of the individual seasons change, annual mean accumulation variability is not necessarily related to the same atmospheric cir-culation patterns during the different climate states. Within a season, local Greenland accumulation variability is indeed linked to a consistent circulation pattern, which is
15
observed for all studied climate periods, even for the LGM, however these circulation patterns are specific for different regions on the Greenland ice sheet. The simulated impact of orbital forcing and changes in the ice-sheet topography on accumulation ex-hibits strong spatial variability emphasizing that accumulation records from different ice core sites cannot be expected to look alike since they include a distinct local signature.
20
Accumulation changes between different climate periods are dominated by changes in the amount of snowfall and are driven by both thermodynamic and dynamic factors. The thermodynamic impact determines the strength of the hydrological cycle, and warmer temperatures are generally accompanied by an increase in Greenland precipitation. Dynamical drivers of accumulation changes are the large-scale circulation and the
lo-25
cal orography having a distinct influence on the local flow characteristic and hence the amount of precipitation deposited in any Greenland region.
CPD
9, 3825–3870, 2013Greenland accumulation links to
atmospheric circulation
N. Merz et al.
Title Page
Abstract Introduction
Conclusions References
Tables Figures
◭ ◮
◭ ◮
Back Close
Full Screen / Esc
Printer-friendly Version Interactive Discussion
Discussion
P
a
per
|
D
iscussion
P
a
per
|
Discussion
P
a
per
|
Discuss
ion
P
a
per
1 Introduction
Understanding the mass balance of the Greenland Ice Sheet (GrIS) is central to pre-dicting future global sea level changes. Snow accumulation (defined here as snow precipitation minus sublimation) has been identified as the most important variable for the mass balance of the ice sheet (McConnell et al., 2000a,b). Accurate records of
ac-5
cumulation are therefore fundamental to investigate spatial and temporal variations in the mass balance and elevation changes of the polar ice sheets. Greenland ice cores provide high-resolution (annually resolved) ground-based point estimates of accumula-tion and offer the possibility to retrieve the relationship between climate and accumula-tion variability (e.g., Banta and McConnell, 2007). Accumulaaccumula-tion rates in ice cores are
10
usually calculated by determining annual layers using multiple parameters (e.g., dust, sea-salt, nitrate andδ18O) measured in continuous sample cuts and correcting layer
thickness for glaciological thinning (Anklin et al., 1998; Mosley-Thompson et al., 2001). Local ice core accumulation variability is largely attributed to changes in atmospheric circulation rather than to thermodynamic control (Kapsner et al., 1995; Crüger et al.,
15
2004; Hutterli et al., 2007). Based on this, a number of studies identify specific fea-tures of the atmospheric circulation, which have an imprint on Greenland accumulation variability: Rogers et al. (2004) showed that increased cyclone activity in the proximity of the accumulation location causes anomalous high accumulation and that cyclone frequency variations are significantly related to the primary modes of Greenland
accu-20
mulation.
In some studies, the reverse approach is used to reconstruct features of atmospheric circulation from Greenland accumulation variability: Appenzeller et al. (1998b,a) recon-structed the North Atlantic Oscillation (NAO) for several centuries from the NASA-U ice core. However, the agreement among various pre-instrumental NAO reconstructions
25
CPD
9, 3825–3870, 2013Greenland accumulation links to
atmospheric circulation
N. Merz et al.
Title Page
Abstract Introduction
Conclusions References
Tables Figures
◭ ◮
◭ ◮
Back Close
Full Screen / Esc
Printer-friendly Version Interactive Discussion
Discussion
P
a
per
|
D
iscussion
P
a
per
|
Discussion
P
a
per
|
Discuss
ion
P
a
per
|
on the proxy records (Lehner et al., 2012). To avoid the uncertainties arising from the instabilities in atmospheric modes, Hutterli et al. (2005) have linked inter-annual accu-mulation variability in different Greenland regions to distinct large-scale atmospheric patterns based on ERA40 reanalysis data. The significant relationship found offers the potential to reconstruct the occurrence of these circulation patterns from ice core
5
derived accumulation records in the according regions. However, an important prereq-uisite for such reconstructions is the stability of the connection between local accu-mulation rate at the ice core site and the respective circulation pattern throughout the time of reconstruction. As seen for the NAO reconstruction (Lehner et al., 2012) this requirement is not necessarily fulfilled.
10
In this study we address this stability issue and use a state-of-art climate model as a testbed to revisit the relationship between local accumulation and these atmospheric circulation patterns, similar to Hutterli et al. (2005). We perform time-slice simulations for the present-day, the pre-industrial, the early Holocene and the last glacial maximum (LGM) to cover a variety of past climate states. Besides the stability issue, which is of
15
great value for the proxy interpretation, we use the model to investigate the influence of orbital forcing and moderate changes in the Greenland ice sheet topography on the GrIS mean accumulation. The sensitivity to topographic changes is studied with a set of simulations which implement reconstructed ice sheet topographies from Peltier (2004) for the early Holocene. Moreover, we study in detail the relationship of local GrIS
20
accumulation and atmospheric circulation variability as we observe distinct seasonal features, which have not been depicted in the studies using annual mean accumulation. The manuscript is structured as follows: Sect. 2 describes the observational data, the model and the experiments and includes a short description of the statistical analysis tools. In Sect. 3 we present the model results regarding Greenland accumulation during
25
different climate states and investigate the influence of the external forcing on total and local GrIS accumulation. Section 4 is focusing on the relationship between local GrIS accumulation/precipitation and the prevailing atmospheric circulation patterns on various time-scales (daily to annually). Moreover, tests on the stability of the deducted
CPD
9, 3825–3870, 2013Greenland accumulation links to
atmospheric circulation
N. Merz et al.
Title Page
Abstract Introduction
Conclusions References
Tables Figures
◭ ◮
◭ ◮
Back Close
Full Screen / Esc
Printer-friendly Version Interactive Discussion
Discussion
P
a
per
|
D
iscussion
P
a
per
|
Discussion
P
a
per
|
Discuss
ion
P
a
per
atmospheric circulation patterns in the different time-slice simulations are presented. All results are discussed in Sect. 5 and the conclusions are presented in Sect. 6.
2 Data and method
2.1 Reanalysis data
The atmospheric reanalysis dataset used in this study is the ERA-Interim (ERAi)
prod-5
uct from the European Centre for Medium-Range Weather Forecasts (ECMWF) (Dee et al., 2011). ERAi data is originally calculated with T255 (∼80 km) resolution and
avail-able on the regular 1◦×1◦grid. We use both monthly and daily mean data for the period of 1979–2011. Note that the daily mean surface flux fields, i.e., snowfall, total precip-itation, sublimation (also referred to as snow evaporation), are calculated as the 0 to
10
36 h accumulation forecast minus the 0 to 12 h accumulation forecast to avoid known spin-up effects (Uppala et al., 2005; Dee et al., 2011). In addition to ERAi, all analyses were carried out with ERA40 data (1958–2001). However, the ERA40 results were very similar to ERAi thus only ERAi results are presented here.
2.2 Climate model
15
Besides the reanalysis data, the study is based on simulations with the Community Climate System Model (version 4, CCSM4) developed at the National Center for Atmo-spheric Research (NCAR) in a horizontal resolution of 0.9◦×1.25◦(Gent et al., 2011). The model includes components for atmosphere, ocean, land and sea ice that com-municate through a coupler. We run the CCSM4 with the atmosphere-land-only setup
20
CPD
9, 3825–3870, 2013Greenland accumulation links to
atmospheric circulation
N. Merz et al.
Title Page
Abstract Introduction
Conclusions References
Tables Figures
◭ ◮
◭ ◮
Back Close
Full Screen / Esc
Printer-friendly Version Interactive Discussion
Discussion
P
a
per
|
D
iscussion
P
a
per
|
Discussion
P
a
per
|
Discuss
ion
P
a
per
|
a data input model. The sea ice model, the Community Ice CodE version 4 (Hunke and Lipscomb, 2008), is used in its thermodynamic-only mode.
2.3 Experiments
To study the accumulation and the associated atmospheric circulation on Greenland during different recent climate states, a set of time-slice experiments is conducted
cov-5
ering four different time periods:
– A present-day (PD) simulation with perpetual 1990 AD condition which is mainly used for model evaluation by comparing with reanalysis data.
– A pre-industrial (PI) simulation with perpetual 1850 AD conditions used as refer-ence simulation for the paleo simulations since it describes the present climate
10
without perturbation by human activities.
– Four early Holocene (EH) simulations with perpetual 8 ka (8000 yr before 1950) conditions but different ice-sheet forcings (see Fig. 1 and Sect. 2.4 for more de-tails).
– A last glacial maximum (LGM) simulation with full glacial conditions including
ma-15
jor ice sheets (see Fig. 1). This simulation has previously been used and de-scribed by Hofer et al. (2012a,b).
The set of EH simulations is used to test the sensitivity of an interglacial climate to moderate changes in the ice-sheet distribution. These sensitivity experiments are also the reason why the Holocene experiments are placed within the early Holocene (8 ka)
20
instead of the classical Mid-Holocene (6 ka) setup as used in the Paleoclimate Model-ing Intercomparison Project (PMIP) protocol (Braconnot et al., 2007). DurModel-ing the early Holocene sea-level estimates show a considerable sea-level rise resulting from signifi-cant changes in the size of the ice-sheets (see e.g., Smith et al., 2011 and references therein). However, between 7 ka and present sea-level changes have been
compara-25
CPD
9, 3825–3870, 2013Greenland accumulation links to
atmospheric circulation
N. Merz et al.
Title Page
Abstract Introduction
Conclusions References
Tables Figures
◭ ◮
◭ ◮
Back Close
Full Screen / Esc
Printer-friendly Version Interactive Discussion
Discussion
P
a
per
|
D
iscussion
P
a
per
|
Discussion
P
a
per
|
Discuss
ion
P
a
per
simulations and the external forcing factors used is provided in Table 1. All simulations are conducted for 33 model years and the analysis is based on the last 30 yr of each simulation as the first 3 yr are declared as spin-up phase.
2.4 Boundary conditions
The sea-surface temperature (SST) and sea ice fields used as lower boundary
con-5
ditions in the model experiments are taken from appropriate outputs of fully-coupled CCSM3 simulations. These are conducted with the low-resolution CCSM3 (Yeager et al., 2006) model version. For our PD simulation we use output of a CCSM3 con-trol 1990 AD run (provided by Earth System Grid). For the PI simulation we use output of a control 1850 AD simulation (Merkel et al., 2010) and for the EH simulations we
10
take 33 yr output of around 8 ka from a transient Holocene simulation. This transient Holocene simulation starts at 9 ka and is similar to the CCSM3 run by Varma et al. (2012) except that no orbital acceleration is applied. For all time-slice simulations, the monthly mean SST and sea ice output of the corresponding CCSM3 simulations are used as time-varying lower boundary conditions. With this setup we account for both,
15
the different states of the ocean and sea ice cover during the different climate periods as well as for inter-annual variability in the SSTs and sea ice concentration.
The values for the Earth’s orbital parameters are calculated according to Berger (1978). The influence of the orbital forcing difference between present-day and pre-industrial is negligible. Similar as for the mid-Holocene (e.g., Braconnot et al., 2007),
20
for 8 ka the orbital parameters lead to an enhanced seasonal cycle of the incoming solar radiation (insolation) in the Northern Hemisphere (NH). The largest signal is a distinct increase (up to 40 W m−2) for the NH high latitude summer insolation. The larger tilt of the earth axis also results in an increase in annual mean insolation in the high latitudes of both hemispheres. For the LGM, the orbital forcing difference compared
25
CPD
9, 3825–3870, 2013Greenland accumulation links to
atmospheric circulation
N. Merz et al.
Title Page
Abstract Introduction
Conclusions References
Tables Figures
◭ ◮
◭ ◮
Back Close
Full Screen / Esc
Printer-friendly Version Interactive Discussion
Discussion
P
a
per
|
D
iscussion
P
a
per
|
Discussion
P
a
per
|
Discuss
ion
P
a
per
|
The greenhouse gas (GHG) concentrations are set according to the PMIP protocol. As an exception, for the EH simulations we use pre-industrial GHGs to be consistent with the respective CCSM3 Holocene simulation (Varma et al., 2012), which provides the SST and sea ice fields for these experiments. This means that the EH simulations aside from the different ice sheets are solely driven by orbital forcing with respect to PI.
5
The set of four EH simulations differ in the implemented topography and size of the global ice sheets: whereas EHPD includes the present-day mask as PD and PI do, for EH7 ka the reconstruction for 7 ka by the ICE-5G model by Peltier (2004) is implemented. Equivalent to EH7 ka we used the ICE-5G reconstructions for 8 and 9 ka for the EH8 ka and the EH9 ka simulation, respectively. To investigate the sensitivity of
10
the paleo topographies and ice sheets we declare EHPDas the reference simulation for the early Holocene against which we compare the other EH simulations.
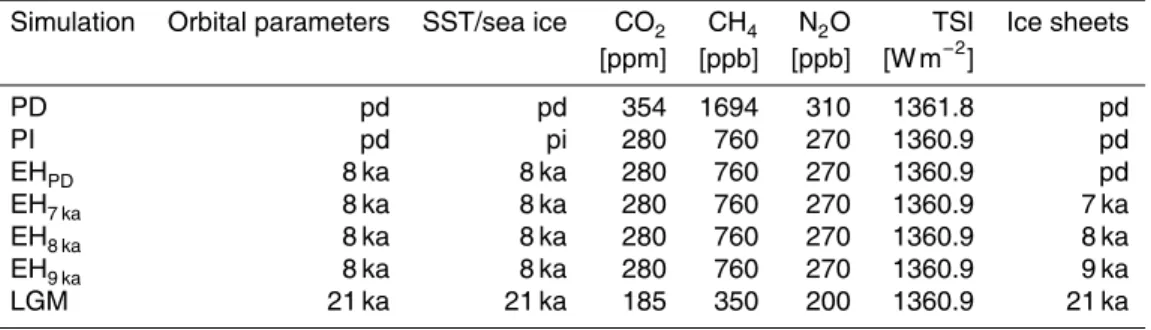
The topography changes in the NH with respect to the present-day mask can be summarized as follows: the 7 ka (Fig. 1a) topography shows some slightly lower areas in North America and Scandinavia since the post-glacial rebound effect following the
15
melting of the Laurentide and the Fennoscandian ice domes has not been completed at that time. At the same time, North Greenland is slightly higher and up to 500 m lower at the central eastern and south western coast, respectively. For 8 ka (Fig. 1b), the diff er-ences to the present mask are similar as for 7 ka but stronger. The 9 ka mask (Fig. 1c) is marked by significant remnants of the Laurentide ice sheet around the Hudson Bay. In
20
addition, 9 ka Greenland is higher than present particularly in coastal areas. The LGM simulation contains full glacial conditions with large Laurentide and Fennoscandian ice sheets (see Fig. 1d). To account for the presence of the large ice sheets, the sea level in the LGM simulation is lowered by 120 m with respect to modern levels. In contrast, the sea level changes corresponding to the included early Holocene ice sheets are not
25
implemented in the EH simulations since they are rather small (<20 m).
CPD
9, 3825–3870, 2013Greenland accumulation links to
atmospheric circulation
N. Merz et al.
Title Page
Abstract Introduction
Conclusions References
Tables Figures
◭ ◮
◭ ◮
Back Close
Full Screen / Esc
Printer-friendly Version Interactive Discussion
Discussion
P
a
per
|
D
iscussion
P
a
per
|
Discussion
P
a
per
|
Discuss
ion
P
a
per
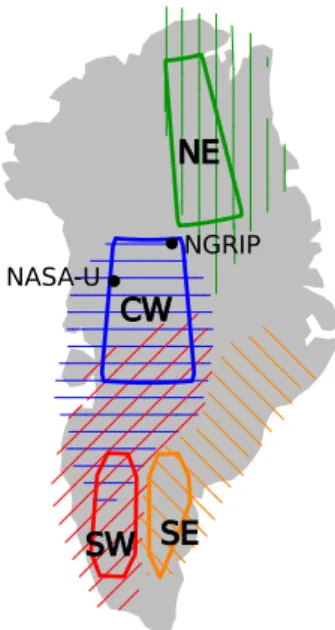
2.5 Correlation and composite analysis
We apply classical correlation and composite analyses to derive the relationship be-tween GrIS accumulation variability and the state of the large-scale circulation. Similar to Hutterli et al. (2005) we primarily look at accumulation in four different Greenland re-gions (see Fig. 2): central-western (CW; 70–75◦
N, 40–50◦
W), north-eastern (NE; 76–
5
82◦N, 30–40◦W), south-west (SW; 63–66◦N, 47–48◦W) and south-east (SE; 63–65◦N, 44◦W, 64–66◦N, 43◦W, 65–66◦N, 42◦W). The accumulation rates in these four regions are representative for larger areas of the GrIS (shaded areas in Fig. 2). For each region a series of standardized and detrended pseudo accumulation records are generated. Following that, the accumulation records are correlated with the 500 hPa geopotential
10
height (z500) field to come up with specific correlation patterns for each accumulation region. In addition, we calculate two kinds of z500 composite patterns: the plus-minus composite pattern is defined as the subtraction of the mean of all cases when accu-mulation is ≤ −1 standard deviation from the mean of all cases when accumulation
is≥1 standard deviation. Hence, the plus-minus composite pattern accounts for the
15
accumulation magnitude between a high and a low accumulation year. We apply the plus-minus composites to annual mean accumulation (which is applicable for ice core data) as well as to seasonal mean accumulation to identify possible seasonal depen-dencies. Further positive composite patterns are deduced, i.e. the mean z500 pattern of all cases when accumulation is≥1 standard deviation (expressed as anomaly from
20
the z500 climatological mean pattern). These positive composite patterns are applied to daily snowfall/precipitation time series to study the daily weather situations leading to a local precipitation/snow event in the different Greenland regions and during the diff er-ent seasons. To compensate for sub-seasonal biases within these daily accumulation time series, the annual cycle is removed beforehand. Note also that a fixed present-day
25
CPD
9, 3825–3870, 2013Greenland accumulation links to
atmospheric circulation
N. Merz et al.
Title Page
Abstract Introduction
Conclusions References
Tables Figures
◭ ◮
◭ ◮
Back Close
Full Screen / Esc
Printer-friendly Version Interactive Discussion
Discussion
P
a
per
|
D
iscussion
P
a
per
|
Discussion
P
a
per
|
Discuss
ion
P
a
per
|
3 Greenland accumulation in different climate states
3.1 Present-day accumulation
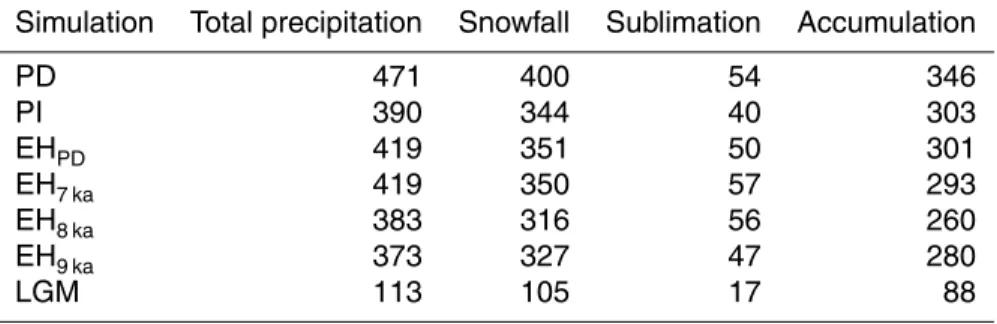
Present estimates of the GrIS accumulation are based on accumulation records from ice cores and snow pits as well as on atmospheric data from reanalysis and coastal weather stations (Bales et al., 2009). Mean accumulation rates are estimated to be
5
around 300 mm yr−1 (see Hakuba et al., 2012 and references therein). The represen-tation of GrIS accumulation in reanalysis datasets has been evaluated by Chen et al. (2011). They show that regarding both, spatial distribution and temporal variability ERAi resembles best the observations compared to other reanalyses. Accumulation gener-ally increases from northern to southern Greenland and is highest in southern coastal
10
areas (Fig. 3a), where we also find the strongest cyclonic activity (Dethloffet al., 2002). The CCSM4 simulation with present-day climate (PD) is able to realistically represent spatial accumulation variability (Fig. 3b). However, accumulation is overestimated in most areas. This overestimation is mainly attributed to a positive model bias in Green-land precipitation and to a cold summer bias leading to an overestimation of summer
15
snowfall at the expense of rain in South Greenland. The resulting mean accumulation rates for the entire GrIS are 306 mm yr−1 for ERAi and 346 mm yr−1 for PD demon-strating that ERAi is very close to the observed estimates whereas the model clearly overestimates (∼15 %) accumulation on average. Nevertheless, the spatial distribution
of accumulation (both mean and variability) in the PD model simulation mainly
resem-20
bles the observed distribution. Thus, we are sufficiently confident to use the CCSM4 model for studying GrIS accumulation during past climate states.
3.2 Accumulation during the early Holocene and the LGM
To gain a first impression of Greenland accumulation during past climate conditions, we compare the EHPDand the LGM simulations against PI, i.e. the reference for the paleo
25
simulations. The climate in EHPDis comparable to the one in the PMIP2 mid-Holocene
CPD
9, 3825–3870, 2013Greenland accumulation links to
atmospheric circulation
N. Merz et al.
Title Page
Abstract Introduction
Conclusions References
Tables Figures
◭ ◮
◭ ◮
Back Close
Full Screen / Esc
Printer-friendly Version Interactive Discussion
Discussion
P
a
per
|
D
iscussion
P
a
per
|
Discussion
P
a
per
|
Discuss
ion
P
a
per
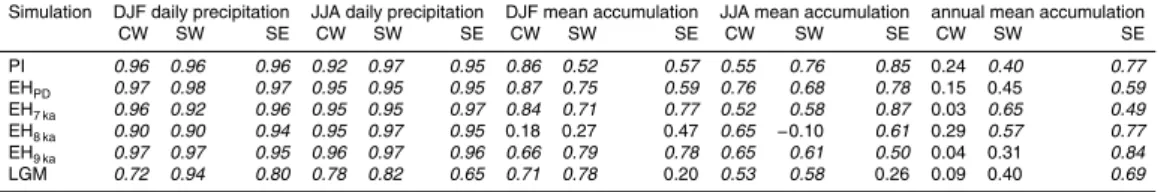
simulations (Braconnot et al., 2007) as the orbital forcing is the dominant factor. The NH EHPD climate has an enhanced seasonal cycle, i.e. warmer summers and colder winters particularly over continental areas compared with PI. In the Arctic ocean, how-ever, the summer warming leads to a warming of the Northern high latitudes all year round due to feedback mechanisms, e.g., albedo-induced warming due to decreased
5
NH sea-ice in all seasons, similar to the findings by Fischer and Jungclaus (2011). The changes in the hydrological cycle in Greenland are more diverse: during winter, snow-fall increases along the Greenland East coast due to the increased moisture availability and moderate atmospheric circulation changes, which lead to stronger flow to Green-land from the East (not shown). In summer, the EHPD exhibits a distinct increase in
10
precipitation in most of Greenland coming along with the summer warming. However, precipitation which occurs along coastal regions and particularly in South Greenland falls mostly in form of rain due to the warmer temperatures. Hence most of the pre-cipitation increase is not relevant for snow accumulation. The resulting annual mean snowfall (Fig. 4a) increases over inland Greenland along the main ridge and at the
15
East coast. Along the rest of the coastal areas we find rather a decrease in snowfall at the expense of rain. The increased temperatures also lead to stronger sublimation in these lower areas along the coast (not shown) contributing to the accumulation pattern in Fig. 4c with lower accumulation in coastal areas except for the Southeast. There, as well as for most of central Greenland, the increased snowfall leads to higher
accumula-20
tion in EHPDthan for PI. The GrIS mean values (Table 2) show that the spatially diverse accumulation changes almost compensate each other so the GrIS mean accumulation rate for EHPDstays with 300 mm yr−1at the PI level.
As described in Sect. 2.4 the orbital parameters during the LGM are not as different from the present-day setup. The dominant boundary conditions for the LGM are the low
25
CPD
9, 3825–3870, 2013Greenland accumulation links to
atmospheric circulation
N. Merz et al.
Title Page
Abstract Introduction
Conclusions References
Tables Figures
◭ ◮
◭ ◮
Back Close
Full Screen / Esc
Printer-friendly Version Interactive Discussion
Discussion
P
a
per
|
D
iscussion
P
a
per
|
Discussion
P
a
per
|
Discuss
ion
P
a
per
|
polar region resulting in a distinct slow-down of the hydrological cycle. Snowfall over GrIS is reduced in all regions (see Fig. 4b) with the strongest reduction along the main accumulation regions. The fact that due to the colder climate the sublimation rates are reduced as well (not shown), can by no means compensate the precipitation reduction. Thus the LGM-PI accumulation change (Fig. 4d) is clearly dominated by the change in
5
snowfall. In addition, the dry Greenland conditions are explained by the fact that with the presence of the extensive Laurentide ice sheet the Atlantic storm track is shifted southwards (Hofer et al., 2012a,b). Therefore, North Atlantic areas which presently experience a lot of precipitation (South Greenland, British Isles, Scandinavia), have a much drier climate during LGM. The GrIS mean values of the hydrological cycle
10
(Table 2) show a drop to approximately 30 % of the PI levels in all quantities proving that the interglacial-glacial difference in Greenland accumulation is remarkable.
3.3 Sensitivity to moderate changes in GrIS topography
To quantify the effect of the different Holocene ice sheet masks on GrIS accumulation we compare the EH simulations with paleo topographies (EH7 ka, EH8 ka and EH9 ka)
15
against EHPD to identify the pure ice sheet sensitivity with all other boundaries condi-tions held constant. Thereby, we observe in all experiments a remarkable influence of the ice sheet topography on GrIS snowfall (Fig. 5a, b, c). Dominated by these changes in snowfall, accumulation changes equivalently in all three EH simulations with paleo topographies (Fig. 5d, e, f).
20
In EH7 ka and EH8 ka the Greenland ice sheet is narrowed in the south-western and the central-eastern part whereas the rest of Greenland is several hundred meters higher than present (see Fig. 1a, b). The lowered regions experience a local warming at the surface (Fig. 6a, b), which results in a local increase of annual sublimation but does not significantly affect the accumulation anomalies. The lowering of the south-western
25
and the central-eastern flanks of GrIS displaces the steep slopes inland shifting the main precipitation (snowfall) regions in a similar way. The analysis of the vertical mo-tion over the GrIS for EH7 ka-EHPDand EH8 ka-EHPD(Fig. 6d, e) confirms this process:
CPD
9, 3825–3870, 2013Greenland accumulation links to
atmospheric circulation
N. Merz et al.
Title Page
Abstract Introduction
Conclusions References
Tables Figures
◭ ◮
◭ ◮
Back Close
Full Screen / Esc
Printer-friendly Version Interactive Discussion
Discussion
P
a
per
|
D
iscussion
P
a
per
|
Discussion
P
a
per
|
Discuss
ion
P
a
per
enhanced vertical velocities (expressed as wind divergence reduction at 850 hPa and wind divergence increase at 500 hPa) are found on the inland side, whereas close to the south-western and central-eastern coast the flattening causes downward motion anomalies. The lifting of the air masses then leads to an increase in local snowfall and vice-versa for local downward flow anomalies (compare Figs. 5a, b and 6a, b). The
5
distinct decrease in snowfall (and accumulation) in EH7 ka’s and EH8 ka’s south-western Greenland is additionally strengthened by a moderate change in the atmospheric circu-lation. Thereby both, EH7 kaand EH8 ka, exhibit a change in the annual mean circulation, which result in an enhanced flow from the East to Greenland (not shown). Similar as for EHPD-PI (Fig. 4a) this anomalous westward flow leads to increased snowfall over
10
the steep slopes of East Greenland (particularly in EH7 ka, Fig. 5a) whereas on the lee side (West Greenland) snowfall is decreased. Regarding the GrIS mean accumulation rates (Table 2), the 8 ka ice sheet setup leads to a reduction of GrIS mean snowfall and accumulation whereas EH7 ka roughly remains on the EHPDlevel.
In the EH9 ka simulation the Greenland ice sheet is about 500 m higher (Fig. 1c),
par-15
ticularly in coastal regions making the flanks of the ice sheet even steeper. Over the main ice sheet body the increased orography results in a widespread cooling of a few degrees Celsius (Fig. 6c). The snowfall and accumulation sensitivity of the topographic changes, however, also seem to be rather controlled by the atmospheric flow char-acteristics. The steepening of the ice sheet flanks results in anomalous upward flow
20
(Fig. 6f) and increased snowfall in coastal regions especially in western and south-ern Greenland (Fig. 5c). At the same time, in the adjacent inland areas of the coast the wind divergence indicates downward motion anomalies resulting in less snowfall in these regions. The resulting GrIS mean accumulation (Table 2) of EH9 ka is slightly decreased compared with EHPD since the snowfall reduction over inland Greenland
25
CPD
9, 3825–3870, 2013Greenland accumulation links to
atmospheric circulation
N. Merz et al.
Title Page
Abstract Introduction
Conclusions References
Tables Figures
◭ ◮
◭ ◮
Back Close
Full Screen / Esc
Printer-friendly Version Interactive Discussion
Discussion
P
a
per
|
D
iscussion
P
a
per
|
Discussion
P
a
per
|
Discuss
ion
P
a
per
|
4 Accumulation variability and its relationship to atmospheric circulation
4.1 Annual mean relationship
Besides changes due to various climate forcings in the mean accumulation, local ac-cumulation shows remarkable inter-annual variability. As described in Sect. 2.5, we generate pseudo accumulation records for four Greenland regions (Fig. 2) and
cal-5
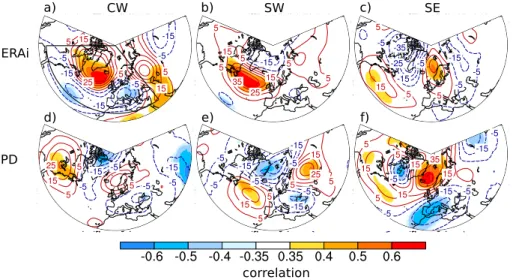
culate the correlation and plus-minus composite patterns to find links between local accumulation and atmospheric circulation variability. Hutterli et al. (2005) applied this method to ERA40 annual mean data and found distinct large-scale atmospheric cir-culation patterns for three of four of these pseudo accumulation records. For ERAi we find very similar patterns for these three regions (Fig. 7a): accumulation variability in the
10
CW region is related to an inverted NAO-pattern: positive accumulation anomalies are associated with a high-pressure blocking south of Greenland equivalent to a negative NAO-like pattern and vice-versa for negative accumulation anomalies. The blocking of South Greenland leads to an enhanced flow to central-western Greenland and thus results in stronger local snowfall and eventually in increased accumulation. The
circu-15
lation pattern associated with SW accumulation shows anomalous strong westerly flow to South Greenland due to a low pressure system over North Greenland and a high pressure situation over the North Atlantic westwards of the British Isles. For high SE accumulation another blocking-like pattern is found with a high pressure centered over the Norwegian Sea. The SE pattern further shows two low pressure anomalies over
20
the Labrador Sea and western Russia. The resulting circulation transports moist air masses to south-eastern Greenland. Note that all three (CW, SW and SE) patterns have also an imprint on the European climate due to their large-scale nature (see Hut-terli et al. (2005) for more details). For accumulation in the NE region we find a weak pattern (not shown) resembling Hutterli et al. (2005). They relate NE accumulation
25
variability rather to the local cyclone frequency than to a distinct large-scale circulation pattern.
CPD
9, 3825–3870, 2013Greenland accumulation links to
atmospheric circulation
N. Merz et al.
Title Page
Abstract Introduction
Conclusions References
Tables Figures
◭ ◮
◭ ◮
Back Close
Full Screen / Esc
Printer-friendly Version Interactive Discussion
Discussion
P
a
per
|
D
iscussion
P
a
per
|
Discussion
P
a
per
|
Discuss
ion
P
a
per
To test the stability of these patterns for earlier climate states, we apply the corre-lation and composite analysis to all model simucorre-lations. First, the model is evaluated by comparing the PD patterns (Fig. 7d, e, f) against ERAi (Fig. 7a, b, c). In order to add quantitative estimates of the consistency of these patterns we calculate the pattern correlation of the z500 plus-minus composites for the North Atlantic domain
5
(indicated by the black frame in Fig. 7a). The significance level for the pattern correla-tion is determined by applying auto-correlacorrela-tion analysis on the z500 data in the North Atlantic domain. The resulting estimate for the number of spatially independent grid points within this domain points out that pattern correlation valuesr ≥0.50 are signifi-cant at the 5 %-level according tottest statistics. The model exhibits variable ability in
10
reproducing the atmospheric patterns of ERAi: the negative NAO-like pattern for CW accumulation is only coarsely represented in PD with an insignificant high-pressure anomaly shifted eastwards compared with ERAi. The CW accumulation of the model seems rather to be linked to a low pressure system over North Greenland. The visual differences between the ERAi and PD CW-patterns are evident by a very low pattern
15
correlation (rERAi-PD=−0.18). In contrast, for SW accumulation the model resembles
the main pressure anomalies found in ERAi which is reflected in a high pattern corre-lation ofrERAi-PD=0.76. Hence, the model indeed captures the relationship between local SW accumulation and the large-scale circulation found in the reanalysis. Regard-ing the SE-pattern, the PD simulation represents to some extent the blockRegard-ing over the
20
Norwegian Sea and the low pressure anomalies over the Labrador Sea and Russia found in ERAi. However the pattern correlation shows little agreement (rERAi-PD=0.33)
owing to the fact that the model simulates a distinct low pressure anomaly over Central Europe for high SE accumulation, a signal which cannot be found in reanalysis data.
Due to the limited ability of the model in simulating the connection of local
accumula-25
CPD
9, 3825–3870, 2013Greenland accumulation links to
atmospheric circulation
N. Merz et al.
Title Page
Abstract Introduction
Conclusions References
Tables Figures
◭ ◮
◭ ◮
Back Close
Full Screen / Esc
Printer-friendly Version Interactive Discussion
Discussion
P
a
per
|
D
iscussion
P
a
per
|
Discussion
P
a
per
|
Discuss
ion
P
a
per
|
an improved capability of reproducing the link between Greenland accumulation and atmospheric circulation on shorter time-scales.
4.2 Seasonal mean relationship
Calculating the z500 correlation and plus-minus composite patterns with seasonal mean accumulation data, the relationship between accumulation variability and the
5
circulation patterns shows a remarkable seasonal cycle in both, ERAi and the model (Fig. 8). The winter (DJF) mean accumulation in the three regions is connected with similar patterns as the ERAi annual mean accumulation (compare Figs. 7a and 8a, b). As an exception the SE winter pattern differs from the annual pattern in the position of the western low-pressure anomaly, which is located south of Greenland in summer
10
but over the Labrador Sea in the annual mean. However, the rest of the winter patterns and their annual equivalents show a high similarity suggesting that winter variability is strongly recorded in the annual mean signal. All three winter patterns show a large-scale structure spanning the North Atlantic and at least partly the Europe domain. The summer (JJA) circulation patterns (Fig. 8c, d) exhibit much weaker pressure patterns,
15
which is expected since the pressure variability in the warmer summer season is gen-erally reduced compared to the winter season. Moreover, the summer patterns show little large-scale characteristics and are rather centered over Greenland. The summer CW pattern shows a weak cyclonic anomaly over North Greenland and a weak antipole South of Greenland resulting in westerly flow to Central Greenland. The SW pattern is
20
somewhat similar but shifted to the South so that the snow falls over south-western instead of central-western Greenland. Summer accumulation in the SE is associated with a wave-like pattern with high-pressure anomalies over the Great Lakes and East of Greenland and a low-pressure anomaly in between centered over the Labrador Sea. In contrast to the annual mean patterns (Fig. 7), the PD model simulation reproduces
25
the ERAi patterns fairly well on the seasonal mean scale in both the winter (compare Fig. 8a and b) and the summer (compare Fig. 8c and d) season. The pattern corre-lation between the ERAi and PD winter plus-minus composites confirms this
CPD
9, 3825–3870, 2013Greenland accumulation links to
atmospheric circulation
N. Merz et al.
Title Page
Abstract Introduction
Conclusions References
Tables Figures
◭ ◮
◭ ◮
Back Close
Full Screen / Esc
Printer-friendly Version Interactive Discussion
Discussion
P
a
per
|
D
iscussion
P
a
per
|
Discussion
P
a
per
|
Discuss
ion
P
a
per
ment exhibiting the strongest conformance for CW (rERAi-PD=0.88), followed by SW
(rERAi-PD=0.64) and SE (rERAi-PD=0.52). For the summer plus-minus composites the pattern correlation shows fairly high values for all three regions (CW:rERAi-PD=0.60,
SW:rERAi-PD=0.64, SE:rERAi-PD=0.52).
The seasonal mean analysis is also conducted for spring (MAM) and autumn (SON).
5
The resulting patterns (not shown) associated with regional accumulation variability are somewhat a transition between the summer and winter patterns. This is observed for both, ERAi and PD. Further, when applying the correlation and plus-minus composites to seasonal mean precipitation instead of accumulation data, the resulting patterns (not shown) are equivalent to the seasonal patterns (Fig. 8) diagnosed from accumulation.
10
In the next step we address the question why the model’s ability in reproducing the ERAi annual patterns is limited (see Sect. 4.1) but at the same time the model’s sea-sonal circulation patterns conform well with ERAi. The reason for this model-reanalysis disagreement is investigated by the analysis of the seasonal contributions to the annual signal. For all three regions, we find in ERAi and PD a substantial contribution of every
15
season to the annual mean accumulation, e.g., for CW accumulation in ERAi each of the four seasons delivers at least 20 % of the total yearly accumulation. Therefore the annual mean signal is interpreted as a mixture of all seasons and is (at least in present climate) not solely dominated by one season.
The same relationship between annual and seasonal signals is found for
accumula-20
tion variability in the three regions (Fig. 9). In particular in the CW and SW region, we find for ERAi almost equal contributions of all seasons to the annual variability signal. In the SE annual variability signal the winter clearly outweighs the summer signal but the contributions of spring an autumn remain substantial. Comparing ERAi and PD it be-comes apparent that the seasonal contributions in the model clearly differ from ERAi,
25
CPD
9, 3825–3870, 2013Greenland accumulation links to
atmospheric circulation
N. Merz et al.
Title Page
Abstract Introduction
Conclusions References
Tables Figures
◭ ◮
◭ ◮
Back Close
Full Screen / Esc
Printer-friendly Version Interactive Discussion
Discussion
P
a
per
|
D
iscussion
P
a
per
|
Discussion
P
a
per
|
Discuss
ion
P
a
per
|
in the PD simulation closely matches ERAi. Hence, the annual variability signal of both are comparable since they contain the same weighting of the seasons. Therefore it is no surprise that the annual mean SW pattern (Fig. 7) shows good agreement be-tween PD and ERAi whereas the CW and SE patterns in PD hardly match the ERAi equivalents. When using the ERAi seasonal contributions to the annual accumulation
5
variability from Fig. 9 as weights to add the seasonal patterns to so-called “corrected annual patterns”, we come up with a good agreement of PD and ERAi as indicated by significant pattern correlations for all three regions (rERAi-PD=0.75, 0.93 and 0.88). This confirms that the model’s problem in correctly representing the CW and SE annual plus-minus composites (Fig. 7) is mainly a problem of weighting the seasonal
contri-10
butions rather than the representation of the large-scale circulation pattern connected with local GrIS accumulation.
4.3 Recorded circulation patterns in precipitation events
To ascertain the influence of atmospheric circulation on local Greenland accumulation we extend our investigations to the daily (weather) time-scale. For this purpose we
15
identify the z500 circulation patterns associated with a local precipitation event, de-fined as a day on which precipitation is≥1 standard deviation. Thereby the resulting
circulation patterns in ERAi are the same regardless if the analysis is applied to total precipitation or solely snowfall events (for the model this comparison is not possible due to lack of daily snowfall output). For both ERAi and the PD simulation we find
sim-20
ilar circulation patterns linked with such precipitation events. As the seasonal mean patterns, the daily patterns show distinct differences between the winter and summer season (compare Fig. 10a, b with Fig. 10c, d). In general, the patterns associated with a local precipitation event are similar to the circulation patterns related to the sea-sonal mean accumulation variability (compare Fig. 10 with Fig. 8) in the corresponding
25
regions. Winter precipitation in CW is connected with a negative NAO-like situation where Southern Greenland is blocked by a strong anti-cyclone, whereas moist air from the southwest reaches the central and northern part of Greenland’s west coast. Winter
CPD
9, 3825–3870, 2013Greenland accumulation links to
atmospheric circulation
N. Merz et al.
Title Page
Abstract Introduction
Conclusions References
Tables Figures
◭ ◮
◭ ◮
Back Close
Full Screen / Esc
Printer-friendly Version Interactive Discussion
Discussion
P
a
per
|
D
iscussion
P
a
per
|
Discussion
P
a
per
|
Discuss
ion
P
a
per
precipitation events in the SW regions are similarly caused as the ones in the CW re-gion but with a negative NAO-like pattern shifted to the south, so South Greenland is not blocked anymore and the westerlies can bring moist air to SW. Daily precipitation events in SE during winter are linked with the so-called Scandinavian blocking pattern (Yiou et al., 2012) with a cyclonic system Southwest of Greenland and a blocking over
5
the Norwegian Sea. The resulting circulation transports relatively warm and moist air to SE Greenland. For the summer season (Fig. 10c, d), we find again weaker pressure patterns, which resemble the patterns found in the seasonal mean analysis. All summer patterns are spatially limited to Greenland’s vicinity and hardly include any signal in the North Atlantic domain. CW and SW precipitation results from westerly wind conditions
10
caused by a low pressure anomaly on the North and a high pressure anomaly on the South side of the precipitation region. Precipitation in the SE region is associated with the same wave-like pattern found for summer mean accumulation (Fig. 8c, d). Thereby moist air is advected from the South to the steep slopes in SE Greenland where it rains out.
15
All daily circulation patterns of the PD simulation (Fig. 10b, d) highly agree with the ERAi equivalents (Fig. 10a, c). The pattern correlation of the z500 positive com-posites for the North Atlantic domain shows very high values for all six patterns (0.81≤rERAi-PD≤0.98). The remarkable degree of consistency is explained by the fact
that the daily patterns are based on an extensive sample (over 2700 daily values)
com-20
pared to just 30 seasonal or annual mean values used in Sects. 4.1 and 4.2.
4.4 Stability during past climate states
In the previous sections we showed that local GrIS precipitation and accumulation variability on various time-scales is significantly linked to specific circulation patterns. Further, the climate model is to some extent capable of reproducing the patterns found
25
CPD
9, 3825–3870, 2013Greenland accumulation links to
atmospheric circulation
N. Merz et al.
Title Page
Abstract Introduction
Conclusions References
Tables Figures
◭ ◮
◭ ◮
Back Close
Full Screen / Esc
Printer-friendly Version Interactive Discussion
Discussion
P
a
per
|
D
iscussion
P
a
per
|
Discussion
P
a
per
|
Discuss
ion
P
a
per
|
annual, seasonal and daily accumulation/precipitation indices are compared with the patterns of the paleo climate simulations (Table 3). The stability is again quantified by the pattern correlation for the North Atlantic domain as in Sects. 4.1–4.3.
The highest agreement among the patterns from the different simulations is found for daily precipitation (see Fig. 10c, d for PD patterns). During both the winter and summer
5
season the precipitation events in the PI and all EH simulations show the same positive composite patterns as PD which is confirmed by pattern correlation values≥0.90 (see
Table 3). Daily LGM patterns are also in agreement with PD (0.65≤rPD-LGM≤0.94).
This means that although the NH atmospheric circulation during the LGM strongly differs from the present-day conditions (Hofer et al., 2012b), the relative daily weather
10
patterns (anomalies from the seasonal means), which lead to precipitation over any of the three Greenland regions largely remain the same.
The seasonal mean relationship between accumulation variability and the corre-sponding circulation patterns exhibits reasonable stability throughout the paleo simula-tions (see Table 3). In particular, the winter patterns generally show strong consistency
15
with most patterns correlation values ≥0.70. However, there are also a few
excep-tions: CW:rPD-EH
8 ka =0.18, SW: rPD-EH8 ka =0.27 and SE:rPD-LGM=0.20. The latter is likely caused by the fact that during LGM winters snowfall is strongly reduced and as a consequence accumulation variability almost vanishes. This leads to a small number of cases captured in the plus-minus composite, so the LGM winter patterns should be
20
treated with caution. Concerning the EH8 kaSW and CW winter patterns the low pattern correlation is caused by a deviating signal in far-field areas (e.g., North America and Europe). The EH8 ka patterns indeed compare well to the PD patterns over Greenland and the North Atlantic domain, so no fundamental change in the relationship of winter accumulation and atmospheric circulation is observed.
25
The summer plus-minus composite patterns demonstrate quite good consistency in all model simulations with an average pattern correlation ≥0.60. Exceptions are
the EH8 ka SW and LGM SE patterns. In the EH8 ka simulation the orography of the 8 ka mask lead to an almost complete lack of snowfall and accumulation (partly at the
CPD
9, 3825–3870, 2013Greenland accumulation links to
atmospheric circulation
N. Merz et al.
Title Page
Abstract Introduction
Conclusions References
Tables Figures
◭ ◮
◭ ◮
Back Close
Full Screen / Esc
Printer-friendly Version Interactive Discussion
Discussion
P
a
per
|
D
iscussion
P
a
per
|
Discussion
P
a
per
|
Discuss
ion
P
a
per
expense rain) in SW Greenland during the summer season. This signal is also reflected in the annual mean EH8 ka-EHPD anomaly (Fig. 5b, e). Thus, the SW accumulation variability signal and the related z500-composites are not very trustworthy. Comparing the SW plus-minus composites based on precipitation of PD and EH8 ka (not shown) the pattern correlation is 0.89 showing that there is no fundamental change in the
5
connection of SW precipitation and the circulation pattern for EH8 ka summers as also indicated by the stability of the daily patterns.
For the annual mean accumulation patterns we find limited stability throughout the model simulations (see Table 3, upper left part). In particular, the annual mean CW z500 plus-minus composite shows almost no consistency with pattern correlation
val-10
ues below 0.3 for all comparisons. However, as discussed in Sects. 4.1 and 4.2 the CW patterns in the PD simulation clearly differ from the ERAi pattern due to the overesti-mation of the summer accumulation variability (see Fig. 9). Accordingly, the model’s CW annual patterns should be treated with caution. Regarding the SW annual patterns we observe medium stability throughout the model simulations. Thereby we identify
15
good agreement around Greenland but less agreement over Europe and other more distant regions. The highest pattern correlations are found for the SE region making accumulation in this area the only annual mean signal found to be consistently linked with the same large-scale atmospheric pattern in all simulated climate states. For the CW and SW regions, however, a stable relationship between the annual accumulation
20
variability signal and the associated circulation pattern is not confirmed by the model results.
As already presented in Sect. 4.2, seasonality within the relationship of local GrIS accumulation and the atmospheric circulation is a major issue. Since the annual mean accumulation signal adds up substantial portions of all four seasonal variability signals,
25
CPD
9, 3825–3870, 2013Greenland accumulation links to
atmospheric circulation
N. Merz et al.
Title Page
Abstract Introduction
Conclusions References
Tables Figures
◭ ◮
◭ ◮
Back Close
Full Screen / Esc
Printer-friendly Version Interactive Discussion
Discussion
P
a
per
|
D
iscussion
P
a
per
|
Discussion
P
a
per
|
Discuss
ion
P
a
per
|
as discussed in Sect. 4.2. Assessing the seasonality in the model simulations shows that the seasonal contributions to the annual variability signal vary among the diff er-ent climate states (Fig. 9). Thereby the seasonal contributions exhibit sensitivity to the various forcings, so either changes in the orbital parameters or changes in the Green-land orography can have an impact on the inter-seasonal distribution of accumulation
5
variability. In most cases the seasonal variability contribution to the annual accumula-tion signal goes along with the change in the mean accumulaaccumula-tion, e.g., with a relative increase of summer accumulation at the expense of winter mean accumulation we ob-serve an equivalent shift in the variability signal. During the early Holocene the orbital forcing leads to an increase in the CW summer accumulation whereas the
accumula-10
tion in the other seasons is rather decreased. This results in a larger contribution of summer variability in the annual accumulation signal (Fig. 9a). The SE winter accumu-lation during the LGM almost completely vanishes due to the glacial shift in the storm track so the winter accumulation variability signal contribution to the annual signal is highly decreased (see Fig. 9c).
15
5 Discussion
As seen in Sect. 3 GrIS accumulation is strongly influenced by various forcing factors. Furthermore, the differences in accumulation between different climate states exhibit strong spatial variability emphasizing that accumulation records from different ice core sites likely differ due to the distinct local characteristics. This independence between
20
different regions is also valid regarding inter-annual accumulation variability as also previously shown by Hutterli et al. (2005), whose regional accumulation indices are not significantly correlated with each other (with the exception of CW and SW). Therefore, an accumulation record derived from a Greenland ice core is just representative for the local Greenland region but not for the entire ice sheet.
25
To discuss the variety of climate signals included in such an accumulation record, we calculate the pseudo accumulation record for three of the four Greenland regions
CPD
9, 3825–3870, 2013Greenland accumulation links to
atmospheric circulation
N. Merz et al.
Title Page
Abstract Introduction
Conclusions References
Tables Figures
◭ ◮
◭ ◮
Back Close
Full Screen / Esc
Printer-friendly Version Interactive Discussion
Discussion
P
a
per
|
D
iscussion
P
a
per
|
Discussion
P
a
per
|
Discuss
ion
P
a
per
(Fig. 11) using the model simulations. Note that due to the time-slice setup, the records are not continuous. Still they show the impact of different forcing factors on the local accumulation signal. Due to the spatial independence the three pseudo records only coincide with respect to some forcings (e.g., recent GHG increase or glacial conditions of LGM) but show little agreement regarding the ice-sheet sensitivity and inter-annual
5
variability.
The CW pseudo accumulation record is further compared with accumulation at NGRIP accumulation rates (Fig. 11a), which have been calculated using layer thick-nesses based on the Greenland Ice Core Chronology 2005 (GICC05) age scale (An-dersen et al., 2006), which have been transformed to accumulation rates using a simple
10
Dansgaard–Johnsen model with the ice thicknessH=3085 m ice equivalent (NGRIP members, 2004) and the model parameter h=500 m ice equivalent. A density of
0.85 kg L−1 was used for the depth where preindustrial ice is found and 0.917 kg L−1 for the early Holocene and the LGM to convert to accumulation rates in m water equiv-alent.
15
With respect to PD, the mean accumulation in all three regions in the PI simulation is reduced by about 20–30 %, which is explained by a cooler and drier climate all over the NH polar regions simulated for PI conditions. The PI-PD mean accumulation dif-ference has to be regarded as thermodynamically driven as we see no major change in the mean circulation. We expect that the mean accumulation difference is larger in
20
the simulations representing equilibrium states than in observations due to the fact that part of the response to the PI-PD GHG forcing in the real world is still not fully ac-tive. However, the NGRIP as well as the NASA-U accumulation record (Anklin et al., 1998), which originate in the CW area (see Fig. 2), exhibit an increase in accumulation from pre-industrial to the present period. This is in agreement with the simulated CW
25
accumulation response to global warming.
CPD
9, 3825–3870, 2013Greenland accumulation links to
atmospheric circulation
N. Merz et al.
Title Page
Abstract Introduction
Conclusions References
Tables Figures
◭ ◮
◭ ◮
Back Close
Full Screen / Esc
Printer-friendly Version Interactive Discussion
Discussion
P
a
per
|
D
iscussion
P
a
per
|
Discussion
P
a
per
|
Discuss
ion
P
a
per
|
summer temperatures during the early Holocene leading to an enhanced hydrological cycle and an increase in snowfall (see Fig. 4a) and consequently more accumulation, particularly in the CW and SE region. The different ice-sheet topographies in the EH sensitivity simulations also exhibit a distinct influence on the mean accumulation in all three records. This reveals that the amount of accumulation is very sensitive to changes
5
in the local orography and that already comparatively small changes in GrIS topogra-phy are clearly reflected in the accumulation signal. Since changes in topogratopogra-phy have a very local signature, they are one reason why accumulation records from different Greenland regions are not expected to conform on centennial to millennial time-scales. For example CW accumulation occurring with 7 ka topography is about 15 % higher
10
than the equivalent with present topography (compare EH7 ka and EHPD in Fig. 11a) whereas in the SW region (Fig. 11b) accumulation in EH7 ka is reduced by about 50 % reduced with respect to EHPD. CW accumulation simulated in EH7 ka, EH8 kaand EH9 ka does reasonably agree with NGRIP data for 7, 8 and 9 ka, respectively. The model re-sults suggest that the observed increase in NGRIP accumulation from 9 to 7 ka might
15
be caused by changes in the local topography.
As expected the largest difference in accumulation is recorded for changes between the interglacial and glacial climate states. In all three regions we observe an aver-age drop from PI to LGM of about 80 %, which is in agreement with the NGRIP data. As already identified by Kapsner et al. (1995) the glacial-interglacial differences
can-20
not solely be explained by thermodynamic effects. In the case of the LGM simulation, the presence of an extensive Laurentide ice sheet reveals a distinct reorganization of the atmospheric circulation. The resulting southward shift in the westerly storm tracks (Hofer et al., 2012a) leads to an amplification of the drying conditions over Greenland. The Greenland pseudo accumulation records further reveal considerable magnitude
25
of inter-annual variability. In agreement with Crüger et al. (2004) and Hutterli et al. (2005), this study confirms that the inter-annual accumulation variability can be at-tributed to dynamical features, i.e. variability in the atmospheric circulation. Following the idea of Hutterli et al. (2005) we test whether years with anomalously high
CPD
9, 3825–3870, 2013Greenland accumulation links to
atmospheric circulation
N. Merz et al.
Title Page
Abstract Introduction
Conclusions References
Tables Figures
◭ ◮
◭ ◮
Back Close
Full Screen / Esc
Printer-friendly Version Interactive Discussion
Discussion
P
a
per
|
D
iscussion
P
a
per
|
Discussion
P
a
per
|
Discuss
ion
P
a
per
lation (spikes above upper dashed lines in Fig. 11) are consistently accompanied by the same atmospheric pattern with respect to years with anomalous low accumulation (spikes below lower dashed lines in Fig. 11). However, the circulation patterns account-ing for the annual accumulation variability are not stable in all simulated climate states due to sub-seasonal effects. One caveat, however, is the fact that the model shows
5
limited ability in reproducing the circulation patterns found for the reanalysis (Fig. 7), in particular for the accumulation variability in the CW region. The expansion of the analysis to the seasonal-scale reveals that the model is actually able to reproduce the atmospheric patterns responsible for accumulation variability within the different sea-sons. Further the model agrees with ERAi regarding the daily circulation-accumulation
10
relationship on the synoptic-scale. This increases our confidence that the model cap-tures the dynamical situation leading to a precipitation event. The model’s difficulties in the representation of the annual relationship are attributed to differences in the contri-bution of the different seasons to the annual variability signal (see Sect. 4.2 for more details).
15
Independent from these model limitations we have confidence in the following ar-guments concerning the conclusion that the approach by Hutterli et al. (2005) is not necessarily valid for different climate states: the relationship between local GrIS ac-cumulation and large-scale circulation patterns exhibits a remarkable seasonal cycle in both ERAi and the model simulations. Within a season, the attributed circulation
20
patterns show good agreement in all paleo simulations. However, since the seasonal signals can add-up differently to the annual signal (Fig. 9), we do not find a stable re-lationship between annual accumulation and annual circulation patterns except for the SE region. The contributions of the seasonal to the annual variability signal generally follows the accumulation mean: if a change in seasonality due to an alteration in the
25
CPD
9, 3825–3870, 2013Greenland accumulation links to
atmospheric circulation
N. Merz et al.
Title Page
Abstract Introduction
Conclusions References
Tables Figures
◭ ◮
◭ ◮
Back Close
Full Screen / Esc
Printer-friendly Version Interactive Discussion
Discussion
P
a
per
|
D
iscussion
P
a
per
|
Discussion
P
a
per
|
Discuss
ion
P
a
per
|
time periods. This implies that the composites in the annual accumulation records (as indicated in the different time-slices in Fig. 11) have to be treated very carefully regard-ing their interpretation since they likely differ due to sub-seasonal effects. The observed seasonality further indicates that using a proxy to describe the annual mean state of the atmospheric circulation is not very meaningful.
5
6 Conclusions
In the course of this paper, the sensitivity of GrIS accumulation to various forcings, e.g., changes in orbital forcing or the ice sheet topography is presented by climate simula-tions for the present, pre-industrial, the early Holocene, and the LGM. A second focus is set on the relationship of local accumulation variability and large-scale circulation
pat-10
terns and its stability throughout the paleo simulations. The obtained key results have important implications for accumulation and other precipitation proxy records derived from Greenland ice cores: Greenland accumulation generally reacts very sensitively to all tested external forcing factors. Thereby, the accumulation changes due to any forc-ing exhibits strong spatial variability showforc-ing that accumulation records from different
15
ice core sites cannot be expected to be coherent since they include an important local characteristic.
Both, changes in the mean and year-to-year variability of accumulation are domi-nated by snowfall whereas the impact of sublimation is an order of magnitude smaller. Changes in mean accumulation between different climate periods are driven by both
20
thermodynamic and dynamic factors. Regarding the thermodynamic impact, a warming is generally accompanied by an increase in precipitation. As long as this precipitation falls in form of snow, the warming results in an accumulation increase as the increase in sublimation due to the warming cannot compensate for the additional snow mass. Dynamic drivers of accumulation changes are either changes in the large-scale
circu-25
lation or in the local orography having a distinct imprint on the amount of precipitation deposited in any GrIS region. The variety of processes affecting precipitation and
![Fig. 1. Paleo topographies implemented in the model simulations: Deviation from present-day mask [m] for (a) 7 ka, (b) 8 ka, (c) 9 ka and (d) LGM (21 ka)](https://thumb-eu.123doks.com/thumbv2/123dok_br/16379183.191763/36.918.100.603.124.460/fig-paleo-topographies-implemented-model-simulations-deviation-present.webp)
![Fig. 3. Annual mean accumulation [mm yr − 1 ] over the Greenland ice sheet for (a) ERAi and (b) PD simulation.](https://thumb-eu.123doks.com/thumbv2/123dok_br/16379183.191763/38.918.183.524.121.478/fig-annual-mean-accumulation-greenland-sheet-erai-simulation.webp)
![Fig. 4. Annual mean (a, b) snowfall and (c, d) accumulation [mm yr −1 ] for EH PD -PI and LGM-PI.](https://thumb-eu.123doks.com/thumbv2/123dok_br/16379183.191763/39.918.183.521.70.529/fig-annual-mean-snowfall-accumulation-eh-pd-lgm.webp)
![Fig. 5. Early Holocene ice sheet sensitivity of annual mean (a, b, c) snowfall and (d, e, f) accumulation [mm yr −1 ] for the simulations with 7, 8 and 9 ka ice sheet topography](https://thumb-eu.123doks.com/thumbv2/123dok_br/16379183.191763/40.918.105.690.60.512/early-holocene-sensitivity-annual-snowfall-accumulation-simulations-topography.webp)
![Fig. 6. Early Holocene ice sheet sensitivity of annual mean (a, b, c) 2 m temperature [ ◦ C] and (d, e, f) wind divergence [10 −6 s −1 ] over the Greenland ice sheet for the simulations with 7, 8 and 9 ka ice sheet topography](https://thumb-eu.123doks.com/thumbv2/123dok_br/16379183.191763/41.918.163.541.39.435/early-holocene-sensitivity-temperature-divergence-greenland-simulations-topography.webp)