GMDD
7, 1115–1136, 2014HEMCO emission component
C. A. Keller et al.
Title Page
Abstract Introduction
Conclusions References
Tables Figures
◭ ◮
◭ ◮
Back Close
Full Screen / Esc
Printer-friendly Version Interactive Discussion
Discussion
P
a
per
|
D
iscussion
P
a
per
|
Discussion
P
a
per
|
Discuss
ion
P
a
per
|
Geosci. Model Dev. Discuss., 7, 1115–1136, 2014 www.geosci-model-dev-discuss.net/7/1115/2014/ doi:10.5194/gmdd-7-1115-2014
© Author(s) 2014. CC Attribution 3.0 License.
Open Access
Geoscientiic
Model Development
Discussions
This discussion paper is/has been under review for the journal Geoscientific Model Development (GMD). Please refer to the corresponding final paper in GMD if available.
HEMCO v1.0: A versatile, ESMF-compliant
component for calculating emissions in
atmospheric models
C. A. Keller1, M. S. Long1, R. M. Yantosca1, A. M. Da Silva2, S. Pawson2, and D. J. Jacob1
1
School of Engineering and Applied Sciences, Harvard University, Cambridge, MA, USA
2
Global Modeling and Assimilation Office, NASA Goddard Space Flight Center, Greenbelt, Maryland, USA
Received: 20 December 2013 – Accepted: 10 January 2014 – Published: 28 January 2014 Correspondence to: C. A. Keller ([email protected])
GMDD
7, 1115–1136, 2014HEMCO emission component
C. A. Keller et al.
Title Page
Abstract Introduction
Conclusions References
Tables Figures
◭ ◮
◭ ◮
Back Close
Full Screen / Esc
Printer-friendly Version Interactive Discussion
Discussion
P
a
per
|
D
iscussion
P
a
per
|
Discussion
P
a
per
|
Discuss
ion
P
a
per
|
Abstract
We describe the Harvard-NASA Emission Component version 1.0 (HEMCO), a stand-alone software component for computing emissions in global atmospheric models.
HEMCO determines emissions from different sources, regions and species on a
user-specified grid and can combine, overlay, and update a set of data inventories and scale
5
factors, selected by the user from a data library through the HEMCO configuration file. New emission inventories at any spatial and temporal resolution are readily added to HEMCO and can be accessed by the user without any pre-processing of the data files or modification of the source code. Emissions that depend on dynamic source types and local environmental variables such as wind speed or surface temperature are
cal-10
culated in separate HEMCO extensions.
HEMCO is fully compliant with the Earth System Modeling Framework (ESMF) en-vironment. It is highly portable and can be deployed in a new model environment with only few adjustments at the top-level interface. So far, we have implemented HEMCO in the NASA GEOS-5 Earth System Model (ESM) and in the GEOS-Chem chemical
15
transport model (CTM).
By providing a widely applicable framework for specifying constituent emissions, HEMCO is designed to ease sensitivity studies and model comparisons, as well as inverse modeling in which emissions are adjusted iteratively. The HEMCO code, exten-sions, and data libraries are available at http://wiki.geos-chem.org/HEMCO.
20
1 Introduction
Accurate representation of emissions is essential in global models of atmospheric com-position. Models typically rely on gridded emission inventory data, covering global or
regional domains, which are often multiplied with scale factors to adjust for different
species and temporal variability (Lamarque et al., 2010). New and updated
emis-25
GMDD
7, 1115–1136, 2014HEMCO emission component
C. A. Keller et al.
Title Page
Abstract Introduction
Conclusions References
Tables Figures
◭ ◮
◭ ◮
Back Close
Full Screen / Esc
Printer-friendly Version Interactive Discussion
Discussion
P
a
per
|
D
iscussion
P
a
per
|
Discussion
P
a
per
|
Discuss
ion
P
a
per
|
reflecting both improving knowledge and actual changes in emissions. Timely incorpo-ration of this new information into atmospheric models is crucial but can involve labori-ous programming. Here, we present the Harvard-NASA Emission Component version 1.0 (HEMCO), a software interface for atmospheric models that automates the imple-mentation of new inventories and allows users to dynamically construct new emissions
5
by combining existing inventories and scale factors on a per region and/or per species basis. HEMCO is compliant with the Earth System Modeling Framework (ESMF, Hill et al., 2004) software environment and thus can serve as a stand-alone emission com-ponent in Earth System Models (ESM).
The general approach to determine emission of a given species in global
atmo-10
spheric models is through a combination of base emissions and multiplicative scale fac-tors. Base emissions are gridded external data generally constructed using a bottom-up approach based on best estimates of activity rates (e.g. fuel consumption) and emission factors (e.g. emitted mass of species per unit mass of fuel) (Granier et al., 2011). They may also include top-down constraints from atmospheric observations
15
(e.g. Mieville et al., 2010). Scale factors applied to these base values adjust emissions at specific times to account for diurnal, day-of-week, seasonal, or year-to-year variabil-ity (van Donkelaar et al., 2006; Wang et al., 2010), or for environmental parameters such as wind or temperature (e.g. Zender et al., 2003; Guenther et al., 2012).
HEMCO is highly customizable as it can use base emissions and scale factors from
20
a reference database and supplement these with user provided alternatives. These inventories need not be of the same grid dimensions or domain. Using the customizable configuration file, the HEMCO core module selects and assembles the emission arrays for the atmospheric model through combination of the selected base emissions and scale factors.
25
GMDD
7, 1115–1136, 2014HEMCO emission component
C. A. Keller et al.
Title Page
Abstract Introduction
Conclusions References
Tables Figures
◭ ◮
◭ ◮
Back Close
Full Screen / Esc
Printer-friendly Version Interactive Discussion
Discussion
P
a
per
|
D
iscussion
P
a
per
|
Discussion
P
a
per
|
Discuss
ion
P
a
per
|
in ESMs, where the atmospheric composition module is coupled to modules describ-ing atmospheric dynamics and other components of the Earth system (oceans, land, cryosphere). ESMs are interdisciplinary endeavors where stewardship of the code is distributed among several research communities, placing an additional hurdle on timely code updates. We have designed HEMCO so it can serve as an emission
com-5
ponent for ESMs through the ESMF interface, thus allowing for seamless updating of emission inventories and extension modules. HEMCO is currently being incorpo-rated into the Goddard Earth Observing System (GEOS-5) ESM of the NASA Global
Modeling and Assimilation Office (GMAO) (Molod et al., 2012; Ott et al., 2010;
Ran-dles et al., 2013). The HEMCO code, written in FORTRAN 90, along with its current
10
extensions and library of open-source emission inventory databases is available at http://wiki.geos-chem.org/HEMCO.
2 Description of HEMCO
2.1 Overview
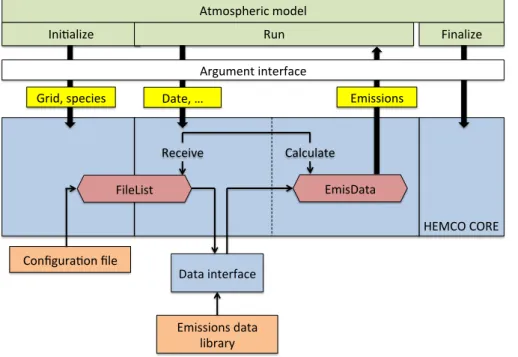
Figure 1 illustrates the design of the HEMCO core module. HEMCO acts as a coupler
15
between a set of emission data files organized in a data library and the external (at-mospheric) model. Based on the specifications of the user configuration file, HEMCO selects the emission files to be used, schedules and invokes the corresponding data receiving commands, organizes the resulting data arrays, and calculates the emission fields for a given species and time upon request. The model species and geographical
20
grid points to be used for the emission calculation are specified during initialization of HEMCO. The grid can be 3-D to allow for emissions at altitude (e.g. from tall stacks, aircraft, etc.), and all emission fields will be returned on this grid. Grid definitions are typically determined from the external model, even though any grid is supported.
HEMCO receives all data through the data interface and all data arrays entering
25
GMDD
7, 1115–1136, 2014HEMCO emission component
C. A. Keller et al.
Title Page
Abstract Introduction
Conclusions References
Tables Figures
◭ ◮
◭ ◮
Back Close
Full Screen / Esc
Printer-friendly Version Interactive Discussion
Discussion
P
a
per
|
D
iscussion
P
a
per
|
Discussion
P
a
per
|
Discuss
ion
P
a
per
|
are performed outside of HEMCO core. This facilitates the coupling of HEMCO to dif-ferent data reading and regridding algorithms, as discussed further in Sect. 2.5.
For each gridbox x on the specified grid, HEMCO computes emissions ex,j(t) for
requested speciesj and at timet. It does so by incorporating the emission inventories
and scale factor data files selected and prioritized by the user through the
configura-5
tion file. The resulting emissionsex,j(t) are then passed to the external model (Fig. 1).
Emission calculation may include a combination of different inventoriesn∈[1,p]
cover-ing different geographic domains (e.g. North America, China) and/or emission sectors
(e.g. fossil fuel, open fires). For each selected inventoryn, the emissionex,j,n(t) is cal-culated as multiplication of the base valuebx,j,n(t) andm∈[1,q] scale factorssx,m(t),
10
as defined in the configuration file:
ex,j,n(t)=bx,j,n(t)× q
Y
m=1
sx,m(t) (1)
Emissionsex,j,n(t) and bx,j,n(t) are in units of mass per unit area per unit time, and
scale factorssx,m(t) are unitless. Scale factors represent (1) temporal emission
vari-15
ations including diurnal, seasonal or inter-annual variability; (2) regional masks that restrict the applicability of the base inventory to a given region; or (3) species specific scale factors, e.g. to split lumped organic compound emissions into individual species. Additional scale factors can be applied to have emissions depend on local environ-mental variables such as temperature or wind speed. These require specifications or
20
functional dependencies and thus special treatment, as will be discussed in Sect. 2.6.
The final emissionsex,j(t) are composed through addition and/or overwriting of allp
employed inventoriesex,j,n(t). To determine how inventories of the same species are
added and prioritized, each inventory is assigned a category and hierarchy number in the configuration file. Within the same category, inventories of higher priority overwrite
25
lower priority data, while emissions of different categories are added. This system
GMDD
7, 1115–1136, 2014HEMCO emission component
C. A. Keller et al.
Title Page
Abstract Introduction
Conclusions References
Tables Figures
◭ ◮
◭ ◮
Back Close
Full Screen / Esc
Printer-friendly Version Interactive Discussion
Discussion
P
a
per
|
D
iscussion
P
a
per
|
Discussion
P
a
per
|
Discuss
ion
P
a
per
|
global inventory for the same sector, while still allowing the global inventory to provide information for other sectors.
2.2 Data library
The HEMCO data library contains the data files of all base emissions and scale factors available to users, who may also choose to extend it by adding their own. Depending
5
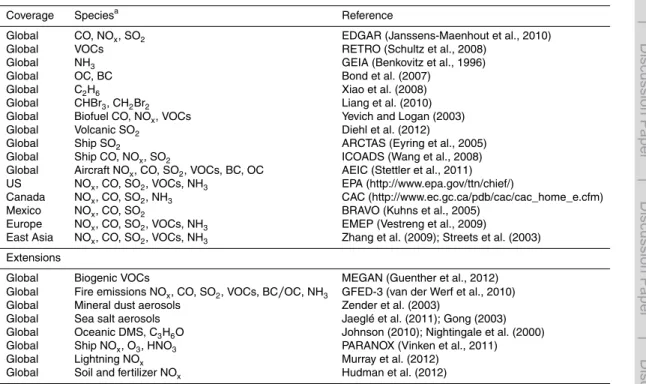
on the specifications of the configuration file, only a subset of the library is effectively used for emission calculation. Table 1 lists the global and regional emission inventories currently included in the HEMCO library.
All data files are in the Network Common Data Form (netCDF) format (http://www. unidata.ucar.edu/software/netcdf/) – the most commonly used data format in the
cli-10
mate community – and adhere to the COARDS metadata conventions. New inventories following these conventions can be readily added to the data library. Support for other
data formats/conventions can be added with relatively little effort through extension of
the HEMCO data interface (see Sect. 2.5).
2.3 HEMCO configuration file
15
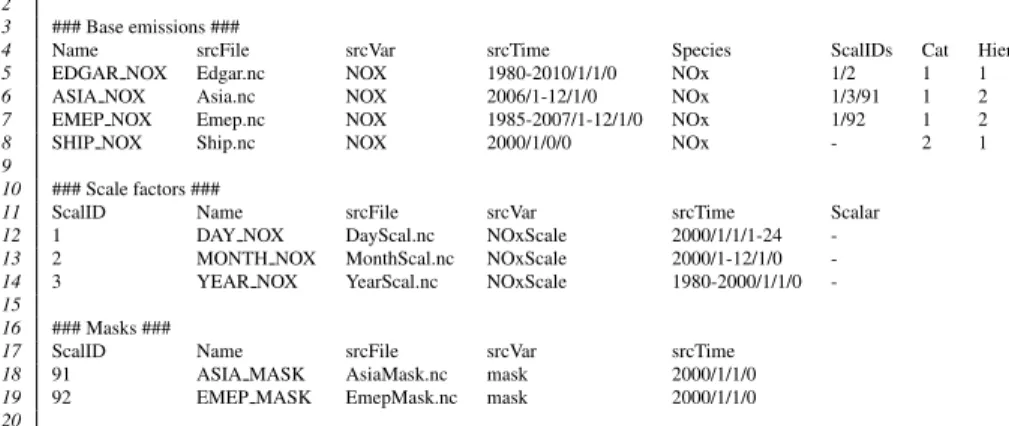
Users select base inventories and scale factors for their simulation through the HEMCO configuration file. Thus, HEMCO enables the user to incorporate new emissions and alter the composition of model emissions without the need to change any source code. A sample configuration file is shown in Fig. 2 for calculating global anthropogenic
emissions of NOx. Default inter-annual global emissions are from EDGAR (Emissions
20
Database for Global Atmospheric Research, Janssens-Maenhout et al., 2010), stored
in netCDF data fileEdgar.nc. Monthly and diurnal scale factors are taken from files
MonthScal.nc and DayScal.nc, respectively. Over Asia and Europe, the global EDGAR emissions are overwritten by the monthly regional inventories of Zhang et al. (2009) and the European Monitoring and Evauluation programme (EMEP, Vestreng
25
GMDD
7, 1115–1136, 2014HEMCO emission component
C. A. Keller et al.
Title Page
Abstract Introduction
Conclusions References
Tables Figures
◭ ◮
◭ ◮
Back Close
Full Screen / Esc
Printer-friendly Version Interactive Discussion
Discussion
P
a
per
|
D
iscussion
P
a
per
|
Discussion
P
a
per
|
Discuss
ion
P
a
per
|
(2009) data are available for year 2006. The same diurnal scale factors are applied to the two regional inventories as for the EDGAR emissions, and the inter-annual
vari-ability of the EDGAR inventory, provided in YearScal.nc, is adapted to the Asian
inventory. Finally, NOx ship emissions from the International Comprehensive Ocean –
Atmosphere Data Set (ICOADS, Wang et al., 2008), available in file Ship.nc, are
5
used in addition to the above-mentioned inventories.
The first section of the configuration file (denoted base emissions) lists the base inventories (see Fig. 2). The first column (“Name”) is a descriptive field identification name, followed by data reading information consisting of the (netCDF) data filename (“srcFile”), the data variable name (“srcVar”), as well as available time range and
tem-10
poral resolution (“srcTime”), as described in more detail in Sect. 2.5. Column “Species” denotes the emissions species name used by the external model, which is adopted by HEMCO during initialization. It is used to ensure that the requested model species are correctly identified by HEMCO (emissions will be ignored otherwise). Column “ScalIDs” lists the identification numbers of all scale factors applied to this base inventory, with
15
multiple scale factors separated by the forward slash sign. The numbers refer to the scale factor numbers specified in column “ScalID” of the second part of the configura-tion file, where all scale factors and masks are listed. For example, in the configuraconfigura-tion
file shown in Fig. 2, the EDGAR NOx inventory (line 5) is linked with scale factors 1
(DAY_NOX) and 2 (MONTH_NOX), defined on lines 12 and 13, respectively.
20
The last two columns of the base data section give the emissions category (“Cat”)
and hierarchy (“Hier”). In the example of Fig. 2, the EDGAR_NOX field (Cat=1;
Hier=1) is overwritten by the regional ASIA_NOX and EMEP_NOX data (Cat=1;
Hier=2). The regional inventories are only applied to the region where they are
de-fined, and EDGAR is used everywhere else. The ship emissions SHIP_NOX are given
25
a different category (Cat=2) and hence are added to the NOx field assembled for
emission category 1.
GMDD
7, 1115–1136, 2014HEMCO emission component
C. A. Keller et al.
Title Page
Abstract Introduction
Conclusions References
Tables Figures
◭ ◮
◭ ◮
Back Close
Full Screen / Esc
Printer-friendly Version Interactive Discussion
Discussion
P
a
per
|
D
iscussion
P
a
per
|
Discussion
P
a
per
|
Discuss
ion
P
a
per
|
descriptive field name (“Name”) and file attributes (“srcFile”, “srcVar”, “srcTime”). The unitless scale factors are either gridded data obtained from a data file (e.g. geograph-ical variations in diurnal emissions) or a spatially uniform scalar directly defined in column “Scalar” of the configuration file. The latter makes it easy to uniformly scale emissions and/or to fractionate lumped emission inventories into individual species
5
(e.g. for organic compounds). Masks are binary scale factors (1 inside the region, 0 outside).
2.4 Core module and emissions calculations
The operation of HEMCO can be divided into three stages, all invoked by the external
model (Fig. 1):Initialize,Run,Finalize.InitializeandFinalizeare only
10
executed once, at the beginning and end of the model simulation, respectively. The
Runcommand is repeated at every emission time step.
The core of HEMCO consists of the internal data structures “FileList” and “Emis-List”. FileList contains the file information of all used base emissions and scale factors, such as data filename, variable, update frequency, etc. It is created in the first stage
15
of HEMCO (Initialize) based on the content of the HEMCO configuration file. In
addition to setting FileList, the initialization routine also receives emission species def-initions (e.g. species name, molecular weight) and specifies the (emission) grid points to be covered by this Central Processing Unit (CPU). In the case of a distributed com-puting environment, the emissions grid will be broken up across all available CPUs on
20
the system. The grid defined during initialization is preserved over the whole course of the simulation and all emissions are returned on it.
EmisList organizes the 3-D arrays of all base emissions and scale factors, which are stored in individual data structures (“containers”) along with information on how these arrays are connected to each other. Each data array covers the specified emission grid
25
GMDD
7, 1115–1136, 2014HEMCO emission component
C. A. Keller et al.
Title Page
Abstract Introduction
Conclusions References
Tables Figures
◭ ◮
◭ ◮
Back Close
Full Screen / Esc
Printer-friendly Version Interactive Discussion
Discussion
P
a
per
|
D
iscussion
P
a
per
|
Discussion
P
a
per
|
Discuss
ion
P
a
per
|
The second stage (Run) of HEMCO consists of two steps, namely receiving/updating
content of the emissions list, and calculating the emissionsex,j(t). The “receive” com-mand generates a data request, based on the information in FileList, which is sent to the data interface. The returned base emissions and scale factors (which is,bx,j,n(t)
andsx,m(t)) are on the specified emission grid and unit and become stored in a
corre-5
sponding data container in EmisList.
In the second step ofRun(“calculate”), emissions are directly calculated from the 3-D
arrays stored in EmisList according to Eq. (1). For each base inventorynof compound
j, emissionsex,j,n(t) are calculated first for every grid point x before all these values
are merged into the final emissionsex,j(t), based upon the emission categories and
10
hierarchies given to each inventory.
2.5 Data interface
The data interface provides the link between HEMCO and the input data files.
Depend-ing on the employed model environment, this step includes different operations and
levels of complexity.
15
When run within ESMF, file reading and data interpolation are performed using the MAPL (Modeling Analysis and Prediction Program Layer) software toolkit built on top of ESMF (https://modelingguru.nasa.gov/docs/DOC-1118). in this case, the role of the data interface is to ensure that all files required by HEMCO are correctly identified and registered through MAPL, as well as to connect the final processed data to the HEMCO
20
core module on every emission time step. More details on the HEMCO implementation within a MAPL/ESMF environment is given in Sect. 3.
If HEMCO is run outside of ESMF, e.g. as part of a stand-alone chemical transport model (CTM) like GEOS-Chem, the data interface needs to perform data reading and remapping operations explicitly. In this case, a package of generic subroutines is called
25
GMDD
7, 1115–1136, 2014HEMCO emission component
C. A. Keller et al.
Title Page
Abstract Introduction
Conclusions References
Tables Figures
◭ ◮
◭ ◮
Back Close
Full Screen / Esc
Printer-friendly Version Interactive Discussion
Discussion
P
a
per
|
D
iscussion
P
a
per
|
Discussion
P
a
per
|
Discuss
ion
P
a
per
|
HEMCO determines the files to be updated – based on the date at the current and previous time step and the specified update frequencies – and invokes the reading and remapping routines accordingly. The (netCDF) filename, data variable and time stamp to be read are extracted by HEMCO from columns “srcFile”, “srcVar” and “src-Time”, respectively, of the configuration file. The time stamp provided in “srcTime” has
5
format year/month/day/hour and indicates the available time range as well as the tem-poral resolution of the configuration file. Both discrete dates for time-independent data (e.g. ship emissions in Fig. 2: 2000/1/1/0) and time ranges for temporally changing inventories (e.g. EDGAR: 1980–2010/1/1/0) are accepted. Time-uniform data is only read once and the same array is then used for all simulation dates. For time-varying
10
data, the time slice most representative for the current simulation date is used. For
example, HEMCO automatically updates EDGAR NOx data whenever the simulation
year changes within simulation years 1980 to 2010. Outside of this range, the closest available time slice is used.
At this stage of development, the HEMCO generic reading and remapping routines
15
focus on regular (lon-lat) grids, since this is the grid type most commonly used for (global) emission inventories. The fact that all data reading and remapping routines are kept separate from the rest of the HEMCO code (see Fig. 1) simplifies connecting HEMCO to other data reading and remapping routines and/or extending existing
func-tionalities, e.g. to use input data in formats different than netCDF or support additional
20
regridding interpolation methods.
2.6 Extensions for on-line scale factors
Emission inventories sometimes include dynamic source types and non-linear scale factors that have functional dependencies on local environmental variables, which are best calculated on-line during execution of the model. Examples are wind dependence
25
GMDD
7, 1115–1136, 2014HEMCO emission component
C. A. Keller et al.
Title Page
Abstract Introduction
Conclusions References
Tables Figures
◭ ◮
◭ ◮
Back Close
Full Screen / Esc
Printer-friendly Version Interactive Discussion
Discussion
P
a
per
|
D
iscussion
P
a
per
|
Discussion
P
a
per
|
Discuss
ion
P
a
per
|
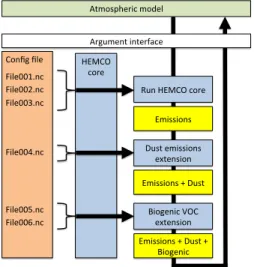
be determined within the HEMCO core module. Instead, users can select a suite of HEMCO extensions that perform emission calculations based on functional dependen-cies obtained from other parts of the ESM, and can write their own extensions from a supplied template. The set of extensions currently available in HEMCO is given in Table 1.
5
Figure 3 illustrates the functioning of the HEMCO extensions. All selected extensions (dust emissions and biogenic VOC emissions in the shown example) are sequentially called after the HEMCO core module, and the emission arrays calculated therein
be-come added to the emissionsex,j(t) previously calculated in HEMCO core. The
ex-tensions take advantage of many of the functionalities of HEMCO. Like the emission
10
data used by the core module, gridded source function data (such as base emissions and environmental independent scale factors) are provided in the configuration file and subsequently become organized and stored through the HEMCO FileList and Emis-List (Fig. 1), except that they are not used for the HEMCO core emission calculation. Instead, these data arrays are requested directly by the respective extension
mod-15
ules and used therein to calculate the emissions for the given process, together with the extension-specific parameterizations. Environmental variables used for these cal-culations, such as wind speed or surface temperature, are obtained from the external model.
3 Implementations
20
HEMCO is a stand-alone emissions component that can be readily included into a new model environment. All required adjustments can be done at the interface level be-tween HEMCO and the external model. So far, we have implemented HEMCO in the GEOS-Chem CTM driven by assimilated meteorological data (Bey et al., 2001), and the NASA GEOS-5 Earth System Model from the NASA Goddard Earth Observing
25
GMDD
7, 1115–1136, 2014HEMCO emission component
C. A. Keller et al.
Title Page
Abstract Introduction
Conclusions References
Tables Figures
◭ ◮
◭ ◮
Back Close
Full Screen / Esc
Printer-friendly Version Interactive Discussion
Discussion
P
a
per
|
D
iscussion
P
a
per
|
Discussion
P
a
per
|
Discuss
ion
P
a
per
|
inventories listed in Table 1. New emission inventories are now added to GEOS-Chem through HEMCO, which greatly facilitates model updates.
Implementation of HEMCO into the GEOS-5 ESM is done through the ESMF inter-face. ESMF is a widely used modular software framework for ESMs (Hill et al., 2004). It enables the construction of ESMs by assembly of a number of stand-alone
compo-5
nents connected to each other through the ESMF superstructure layer. Components
are classified asgriddedcomponents, which are executed on a discrete grid, and
cou-pler components, which connect gridded components and perform input/output
opera-tions. Components receive data through a special superstructure object class (import
state), and make data available to other components by returning data as object class
10
export state.
HEMCO contains all wrapper routines needed to embed it as a gridded component into an ESMF model application. Specifically, all files listed in the HEMCO configura-tion file are registered for data reading at the beginning of a model run. These files then become automatically read and interpolated in space and time through ESMF-generic
15
routines, and HEMCO subsequently imports these arrays through theimport state
ob-ject during step “Receive” of theRunstage (Fig. 1). Likewise, theimport stateobject is
used to obtain data from other ESM components needed by some of the HEMCO ex-tensions, e.g. meteorological fields such as wind speed and temperature or source type classifications, e.g. vegetation type. All emission arrays calculated within HEMCO are
20
returned asexport state object so that they are available to other model components
(i.e. the transport or chemistry component).
4 Conclusions
HEMCO provides a flexible tool for atmospheric models to compute emissions for dif-ferent sources, regions and species through automatic combination, overlaying, and
25
GMDD
7, 1115–1136, 2014HEMCO emission component
C. A. Keller et al.
Title Page
Abstract Introduction
Conclusions References
Tables Figures
◭ ◮
◭ ◮
Back Close
Full Screen / Esc
Printer-friendly Version Interactive Discussion
Discussion
P
a
per
|
D
iscussion
P
a
per
|
Discussion
P
a
per
|
Discuss
ion
P
a
per
|
of the source code. Emissions and scale factors that depend on local environmental parameter such as wind speed and temperature are included through HEMCO exten-sions.
A particular advantage of HEMCO is that no pre-processing of the input data is required as emissions become regridded and converted to desired units during model
5
execution, which allows a straightforward implementation of new emission inventories into atmospheric models. Thus, HEMCO is well suited for model inter-comparison and emission sensitivity studies. These tasks require running the model with emission data
that differ from the default emission settings, which is easily achieved in HEMCO by
simply modifying the configuration file.
10
The strictly modular structure of HEMCO also makes it attractive for inverse mod-eling applications in which emissions are adjusted iteratively to provide an optimal fit to geospatial observations (see Enting, 2005). The adjustment factors can be easily implemented into HEMCO as additional scale factors, which are then applied to the base emissions.
15
HEMCO is ESMF-compliant and can therefore be readily used to compute emis-sions in Earth System Models (ESM) that rely on the ESMF structure. In such appli-cations, HEMCO makes use of the MAPL/ESMF software toolkits to read and interpo-late data fields from files as well as to connect HEMCO with other ESM components. HEMCO presently serves as emission component for the GEOS-Chem CTM and for
20
the NASA GEOS-5 ESM (via ESMF). It can be used easily in any Earth system model. The HEMCO code (in Fortran 90) as well as current extensions and emission data bases are available at http://wiki.geos-chem.org/HEMCO.
Acknowledgements. This work was supported by the NASA Modeling, Analysis, and Prediction (MAP) Program. The authors would like to thank J. E. Nielsen for his technical support.
GMDD
7, 1115–1136, 2014HEMCO emission component
C. A. Keller et al.
Title Page
Abstract Introduction
Conclusions References
Tables Figures
◭ ◮
◭ ◮
Back Close
Full Screen / Esc
Printer-friendly Version Interactive Discussion
Discussion
P
a
per
|
D
iscussion
P
a
per
|
Discussion
P
a
per
|
Discuss
ion
P
a
per
|
References
Benkovitz, C. M., Scholtz, M. T., Pacyna, J., Tarrasón, L., Dignon, J., Voldner, E. C., Spiro, P. A., Logan, J. A., and Graedel, T. E.: Global gridded inventories of anthropogenic emissions of sulfur and nitrogen, J. Geophys. Res.-Atmos., 101, 29239–29253, doi:10.1029/96JD00126, 1996. 1133
5
Bey, I., Jacob, D. J., Yantosca, R. M., Logan, J. A., Field, B. D., Fiore, A. M., Li, Q., Liu, H. Y., Mickley, L. J., and Schultz, M. G.: Global modeling of tropospheric chemistry with assimi-lated meteorology: model description and evaluation, J. Geophys. Res.-Atmos., 106, 23073– 23095, doi:10.1029/2001JD000807, 2001. 1125
Bond, T. C., Bhardwaj, E., Dong, R., Jogani, R., Jung, S., Roden, C., Streets, D. G.,
10
and Trautmann, N. M.: Historical emissions of black and organic carbon aerosol from energy-related combustion, 1850–2000, Global Biogeochem. Cy., 21, GB2018, doi:10.1029/2006GB002840, 2007. 1133
Diehl, T., Heil, A., Chin, M., Pan, X., Streets, D., Schultz, M., and Kinne, S.: Anthropogenic, biomass burning, and volcanic emissions of black carbon, organic carbon, and SO2from
15
1980 to 2010 for hindcast model experiments, Atmos. Chem. Phys. Discuss., 12, 24895– 24954, doi:10.5194/acpd-12-24895-2012, 2012. 1133
Enting, I.: Inverse Problems in Atmospheric Constituent Transport, Cambridge University Press, New York, 2005. 1127
Eyring, V., Köhler, H. W., van Aardenne, J., and Lauer, A.: Emissions from
inter-20
national shipping: 1. The last 50 years, J. Geophys. Res.-Atmos., 110, D17305, doi:10.1029/2004JD005619, 2005. 1133
Gong, S. L.: A parameterization of sea-salt aerosol source function for sub- and super-micron particles, Global Biogeochem. Cy., 17, 1097, doi:10.1029/2003GB002079, 2003. 1133 Granier, C., Bessagnet, B., Bond, T., D’Angiola, A., Denier van der Gon, H., Frost, G., Heil, A.,
25
Kaiser, J., Kinne, S., Klimont, Z., Kloster, S., Lamarque, J.-F., Liousse, C., Masui, T., Meleux, F., Mieville, A., Ohara, T., Raut, J.-C., Riahi, K., Schultz, M., Smith, S., Thomp-son, A., Aardenne, J., Werf, G., and Vuuren, D.: Evolution of anthropogenic and biomass burning emissions of air pollutants at global and regional scales during the 1980–2010 pe-riod, Climatic Change, 109, 163–190, doi:10.1007/s10584-011-0154-1, 2011. 1117
30
GMDD
7, 1115–1136, 2014HEMCO emission component
C. A. Keller et al.
Title Page
Abstract Introduction
Conclusions References
Tables Figures
◭ ◮
◭ ◮
Back Close
Full Screen / Esc
Printer-friendly Version Interactive Discussion
Discussion
P
a
per
|
D
iscussion
P
a
per
|
Discussion
P
a
per
|
Discuss
ion
P
a
per
|
(MEGAN2.1): an extended and updated framework for modeling biogenic emissions, Geosci. Model Dev., 5, 1471–1492, doi:10.5194/gmd-5-1471-2012, 2012. 1117, 1124, 1133
Hill, C., DeLuca, C., Balaji, V., Suarez, M., and Da Silva, A.: The architecture of the Earth Sys-tem Modeling Framework, Comput. Sci. Eng., 6, 18–28, doi:10.1109/MCISE.2004.1255817, 2004. 1117, 1126
5
Hudman, R. C., Moore, N. E., Mebust, A. K., Martin, R. V., Russell, A. R., Valin, L. C., and Cohen, R. C.: Steps towards a mechanistic model of global soil nitric oxide emis-sions: implementation and space based-constraints, Atmos. Chem. Phys., 12, 7779–7795, doi:10.5194/acp-12-7779-2012, 2012. 1133
Jaeglé, L., Quinn, P. K., Bates, T. S., Alexander, B., and Lin, J.-T.: Global distribution of sea
10
salt aerosols: new constraints from in situ and remote sensing observations, Atmos. Chem. Phys., 11, 3137–3157, doi:10.5194/acp-11-3137-2011, 2011. 1133
Janssens-Maenhout, A., Petrescu, A., Muntean, M., and Blujdea, V.: Verifying Greenhouse Gas Emissions: Methods to Support International Climate Agreements, The National Academies Press, Washington, DC, 2010. 1120, 1133
15
Johnson, M. T.: A numerical scheme to calculate temperature and salinity dependent air-water transfer velocities for any gas, Ocean Sci., 6, 913–932, doi:10.5194/os-6-913-2010, 2010. 1133
Kuhns, H., Knipping, E. M., and Vukovich, J.: Development of a United States – Mexico emis-sions inventory for the big Bend Regional Aerosol and Visibility Observational (BRAVO)
20
Study, J. Air Waste Manage., 55, 677–692, doi:10.1080/10473289.2005.10464648, 2005. 1133
Lamarque, J.-F., Bond, T. C., Eyring, V., Granier, C., Heil, A., Klimont, Z., Lee, D., Liousse, C., Mieville, A., Owen, B., Schultz, M. G., Shindell, D., Smith, S. J., Stehfest, E., Van Aar-denne, J., Cooper, O. R., Kainuma, M., Mahowald, N., McConnell, J. R., Naik, V., Riahi, K.,
25
and van Vuuren, D. P.: Historical (1850–2000) gridded anthropogenic and biomass burn-ing emissions of reactive gases and aerosols: methodology and application, Atmos. Chem. Phys., 10, 7017–7039, doi:10.5194/acp-10-7017-2010, 2010. 1116
Liang, Q., Stolarski, R. S., Kawa, S. R., Nielsen, J. E., Douglass, A. R., Rodriguez, J. M., Blake, D. R., Atlas, E. L., and Ott, L. E.: Finding the missing stratospheric Bry: a global
mod-30
GMDD
7, 1115–1136, 2014HEMCO emission component
C. A. Keller et al.
Title Page
Abstract Introduction
Conclusions References
Tables Figures
◭ ◮
◭ ◮
Back Close
Full Screen / Esc
Printer-friendly Version Interactive Discussion
Discussion
P
a
per
|
D
iscussion
P
a
per
|
Discussion
P
a
per
|
Discuss
ion
P
a
per
|
Mieville, A., Granier, C., Liousse, C., Guillaume, B., Mouillot, F., Lamarque, F., Grégoire, J.-M., and Pétron, G.: Emissions of gases and particles from biomass burning during the 20th century using satellite data and an historical reconstruction, Atmos. Environ., 44, 1469–1477, doi:10.1016/j.atmosenv.2010.01.011, 2010. 1117
Molod, A., Takacs, L., Suarez, M., Bacmeister, J., Song, I., and Eichmann, A.: The GEOS-5
5
Atmospheric General Circulation Model: Mean Climate and Development from MERRA to Fortuna, Tech. Rep. NASA/TM-2012–104606-VOL-28; GSFC.TM.01153.2012, NASA God-dard Space Flight Center, Greenbelt, MD, USA, 2012. 1118
Murray, L. T., Jacob, D. J., Logan, J. A., Hudman, R. C., and Koshak, W. J.: Optimized regional and interannual variability of lightning in a global chemical transport model constrained by
10
LIS/OTD satellite data, J. Geophys. Res.-Atmos., 117, D20307, doi:10.1029/2012JD017934, 2012. 1133
Nightingale, P. D., Malin, G., Law, C. S., Watson, A. J., Liss, P. S., Liddicoat, M. I., Boutin, J., and Upstill-Goddard, R. C.: In situ evaluation of air-sea gas exchange parameteriza-tions using novel conservative and volatile tracers, Global Biogeochem. Cy., 14, 373–387,
15
doi:10.1029/1999GB900091, 2000. 1133
Ott, L. E., Duncan, S., Pawson, P., Colarco, M., Chin, C., Randles, C., Diehl, T., and Nielsen, J. E.: Influence of the 2006 Indonesian biomass burning aerosols on tropi-cal dynamics studied with the GEOS-5 AGCM, J. Geophys. Res.-Atmos., 115, D14121, doi:10.1029/2009JD013181, 2010. 1118
20
Randles, C. A., Colarco, P. R., and Da Silva, A.: Direct and semi-direct aerosol effects in the NASA GEOS-5 AGCM: aerosol-climate interactions due to prognostic vs. prescribed aerosols, J. Geophys. Res.-Atmos., 118, 149–169, doi:10.1029/2012JD018388, 2013. 1118 Schultz, M. G., Heil, A., Hoelzemann, J. J., Spessa, A., Thonicke, K., Goldammer, J. G., Held, A. C., Pereira, J. M. C., and van het Bolscher, M.: Global wildland fire emissions from
25
1960 to 2000, Global Biogeochem. Cy., 22, GB2002, doi:10.1029/2007GB003031, 2008. 1133
Stettler, M., Eastham, S., and Barrett, S.: Air quality and public health impacts of UK airports, Part I: Emissions, Atmos. Environ., 45, 5415–5424, doi:10.1016/j.atmosenv.2011.07.012, 2011. 1133
30
GMDD
7, 1115–1136, 2014HEMCO emission component
C. A. Keller et al.
Title Page
Abstract Introduction
Conclusions References
Tables Figures
◭ ◮
◭ ◮
Back Close
Full Screen / Esc
Printer-friendly Version Interactive Discussion
Discussion
P
a
per
|
D
iscussion
P
a
per
|
Discussion
P
a
per
|
Discuss
ion
P
a
per
|
and primary aerosol emissions in Asia in the year 2000, J. Geophys. Res.-Atmos., 108, 8809, doi:10.1029/2002JD003093, 2003. 1133
van der Werf, G. R., Randerson, J. T., Giglio, L., Collatz, G. J., Mu, M., Kasibhatla, P. S., Mor-ton, D. C., DeFries, R. S., Jin, Y., and van Leeuwen, T. T.: Global fire emissions and the contribution of deforestation, savanna, forest, agricultural, and peat fires (1997–2009),
At-5
mos. Chem. Phys., 10, 11707–11735, doi:10.5194/acp-10-11707-2010, 2010. 1133
van Donkelaar, A., Martin, R. V., and Park, R. J.: Estimating ground-level PM2.5using aerosol optical depth determined from satellite remote sensing, J. Geophys. Res.-Atmos., 111, D21201, doi:10.1029/2005JD006996, 2006. 1117
Vestreng, V., Ntziachristos, L., Semb, A., Reis, S., Isaksen, I. S. A., and Tarrasón, L.: Evolution
10
of NOx emissions in Europe with focus on road transport control measures, Atmos. Chem. Phys., 9, 1503–1520, doi:10.5194/acp-9-1503-2009, 2009. 1120, 1133
Vinken, G. C. M., Boersma, K. F., Jacob, D. J., and Meijer, E. W.: Accounting for non-linear chemistry of ship plumes in the GEOS-Chem global chemistry transport model, Atmos. Chem. Phys., 11, 11707–11722, doi:10.5194/acp-11-11707-2011, 2011. 1133
15
Wang, C., Corbett, J. J., and Firestone, J.: Improving spatial representation of global ship emis-sions inventories, Environ. Sci. Technol., 42, 193–199, doi:10.1021/es0700799, 2008. 1121, 1133
Wang, X., Liang, X.-Z., Jiang, W., Tao, Z., Wang, J. X., Liu, H., Han, Z., Liu, S., Zhang, Y., Grell, G. A., and Peckham, S. E.: WRF-Chem simulation of East Asian air quality:
sen-20
sitivity to temporal and vertical emissions distributions, Atmos. Environ., 44, 660–669, doi:10.1016/j.atmosenv.2009.11.011, 2010. 1117
Xiao, Y., Logan, J. A., Jacob, D. J., Hudman, R. C., Yantosca, R., and Blake, D. R.: Global budget of ethane and regional constraints on US sources, J. Geophys. Res.-Atmos., 113, D21306, doi:10.1029/2007JD009415, 2008. 1133
25
Yevich, R. and Logan, J. A.: An assessment of biofuel use and burning of agricultural waste in the developing world, Global Biogeochem. Cy., 17, 1095, doi:10.1029/2002GB001952, 2003. 1133
Zender, C. S., Bian, H., and Newman, D.: Mineral Dust Entrainment and Deposition (DEAD) model: description and 1990s dust climatology, J. Geophys. Res.-Atmos., 108, 4416,
30
doi:10.1029/2002JD002775, 2003. 1117, 1124, 1133
GMDD
7, 1115–1136, 2014HEMCO emission component
C. A. Keller et al.
Title Page
Abstract Introduction
Conclusions References
Tables Figures
◭ ◮
◭ ◮
Back Close
Full Screen / Esc
Printer-friendly Version Interactive Discussion
Discussion
P
a
per
|
D
iscussion
P
a
per
|
Discussion
P
a
per
|
Discuss
ion
P
a
per
|
Table 1.Sample of emission inventories currently in the HEMCO library.
Coverage Speciesa Reference
Global CO, NOx, SO2 EDGAR (Janssens-Maenhout et al., 2010)
Global VOCs RETRO (Schultz et al., 2008) Global NH3 GEIA (Benkovitz et al., 1996)
Global OC, BC Bond et al. (2007) Global C2H6 Xiao et al. (2008)
Global CHBr3, CH2Br2 Liang et al. (2010) Global Biofuel CO, NOx, VOCs Yevich and Logan (2003)
Global Volcanic SO2 Diehl et al. (2012)
Global Ship SO2 ARCTAS (Eyring et al., 2005)
Global Ship CO, NOx, SO2 ICOADS (Wang et al., 2008)
Global Aircraft NOx, CO, SO2, VOCs, BC, OC AEIC (Stettler et al., 2011)
US NOx, CO, SO2, VOCs, NH3 EPA (http://www.epa.gov/ttn/chief/)
Canada NOx, CO, SO2, NH3 CAC (http://www.ec.gc.ca/pdb/cac/cac_home_e.cfm) Mexico NOx, CO, SO2 BRAVO (Kuhns et al., 2005)
Europe NOx, CO, SO2, VOCs, NH3 EMEP (Vestreng et al., 2009)
East Asia NOx, CO, SO2, VOCs, NH3 Zhang et al. (2009); Streets et al. (2003)
Extensions
Global Biogenic VOCs MEGAN (Guenther et al., 2012) Global Fire emissions NOx, CO, SO2, VOCs, BC/OC, NH3 GFED-3 (van der Werf et al., 2010)
Global Mineral dust aerosols Zender et al. (2003)
Global Sea salt aerosols Jaeglé et al. (2011); Gong (2003) Global Oceanic DMS, C3H6O Johnson (2010); Nightingale et al. (2000)
Global Ship NOx, O3, HNO3 PARANOX (Vinken et al., 2011)
Global Lightning NOx Murray et al. (2012) Global Soil and fertilizer NOx Hudman et al. (2012)
a
GMDD
7, 1115–1136, 2014HEMCO emission component
C. A. Keller et al.
Title Page
Abstract Introduction
Conclusions References
Tables Figures
◭ ◮
◭ ◮
Back Close
Full Screen / Esc
Printer-friendly Version Interactive Discussion
Discussion
P
a
per
|
D
iscussion
P
a
per
|
Discussion
P
a
per
|
Discuss
ion
P
a
per
|
HEMCO CORE
Configura/on file
Data interface
Ini/alize Run Finalize
Emissions data library
Receive Calculate Atmospheric model
Emissions Date, …
Grid, species
Argument interface
FileList EmisData
Fig. 1.Overview of the HEMCO core module, which acts as coupler between the atmospheric
GMDD
7, 1115–1136, 2014HEMCO emission component
C. A. Keller et al.
Title Page
Abstract Introduction
Conclusions References
Tables Figures
◭ ◮
◭ ◮
Back Close
Full Screen / Esc
Printer-friendly Version Interactive Discussion
Discussion
P
a
per
|
D
iscussion
P
a
per
|
Discussion
P
a
per
|
Discuss
ion
P
a
per
|
1 ### BEGINNING OF HEMCO CONFIGURATION FILE ###
2
3 ### Base emissions ###
4 Name srcFile srcVar srcTime Species ScalIDs Cat Hier
5 EDGAR NOX Edgar.nc NOX 1980-2010/1/1/0 NOx 1/2 1 1
6 ASIA NOX Asia.nc NOX 2006/1-12/1/0 NOx 1/3/91 1 2
7 EMEP NOX Emep.nc NOX 1985-2007/1-12/1/0 NOx 1/92 1 2
8 SHIP NOX Ship.nc NOX 2000/1/0/0 NOx - 2 1
9
10 ### Scale factors ###
11 ScalID Name srcFile srcVar srcTime Scalar
12 1 DAY NOX DayScal.nc NOxScale 2000/1/1/1-24
-13 2 MONTH NOX MonthScal.nc NOxScale 2000/1-12/1/0
-14 3 YEAR NOX YearScal.nc NOxScale 1980-2000/1/1/0
-15
16 ### Masks ###
17 ScalID Name srcFile srcVar srcTime
18 91 ASIA MASK AsiaMask.nc mask 2000/1/1/0
19 92 EMEP MASK EmepMask.nc mask 2000/1/1/0
20
21 ### END OF HEMCO CONFIGURATION FILE ###
Fig. 2.Sample HEMCO configuration file. Emission inventories (base emissions) are listed in
GMDD
7, 1115–1136, 2014HEMCO emission component
C. A. Keller et al.
Title Page
Abstract Introduction
Conclusions References
Tables Figures
◭ ◮
◭ ◮
Back Close
Full Screen / Esc
Printer-friendly Version Interactive Discussion
Discussion
P
a
per
|
D
iscussion
P
a
per
|
Discussion
P
a
per
|
Discuss
ion
P
a
per
|
Atmospheric model
Argument interface Config file
File001.nc File002.nc File003.nc
Dust emissions extension File004.nc
HEMCO core
Emissions + Dust + Biogenic File005.nc
File006.nc
Run HEMCO core
Biogenic VOC extension Emissions
Emissions + Dust
Fig. 3. Use of HEMCO extensions to compute emissions with functional dependencies on