www.earth-syst-sci-data.net/8/235/2016/ doi:10.5194/essd-8-235-2016
© Author(s) 2016. CC Attribution 3.0 License.
A compilation of global bio-optical in situ data for
ocean-colour satellite applications
André Valente1, Shubha Sathyendranath2, Vanda Brotas1, Steve Groom2, Michael Grant2,
Malcolm Taberner3, David Antoine4,5, Robert Arnone6, William M. Balch7, Kathryn Barker8,
Ray Barlow9, Simon Bélanger10, Jean-François Berthon11, ¸Sükrü Be¸siktepe12, Vittorio Brando13,14, Elisabetta Canuti11, Francisco Chavez15, Hervé Claustre16, Richard Crout17, Robert Frouin18, Carlos García-Soto19,20, Stuart W. Gibb21, Richard Gould17, Stanford Hooker22, Mati Kahru18,
Holger Klein23, Susanne Kratzer24, Hubert Loisel25, David McKee26, Brian G. Mitchell18, Tiffany Moisan27, Frank Muller-Karger28, Leonie O’Dowd29, Michael Ondrusek30, Alex J. Poulton31,
Michel Repecaud32, Timothy Smyth2, Heidi M. Sosik33, Michael Twardowski34, Kenneth Voss35, Jeremy Werdell22, Marcel Wernand36, and Giuseppe Zibordi11
1Marine and Environmental Sciences Centre (MARE), University of Lisbon, Lisbon, Portugal 2Plymouth Marine Laboratory, Plymouth, PL1 3DH, UK
3EUMETSAT, Eumetsat-Allee 1, 64295 Darmstadt, Germany
4Sorbonne Universités, UPMC Univ. Paris 06, CNRS, Laboratoire d’Océanographie de Villefranche, Villefranche-sur-mer, 06238, France
5Remote Sensing and Satellite Research Group, Department of Physics, Astronomy and Medical Radiation Sciences, Curtin University, Perth, WA 6845, Australia
6University of Southern Mississippi, Stennis Space Center, Kiln, MS, USA 7Bigelow Laboratory for Ocean Sciences, East Boothbay, ME, USA
8ARGANS Ltd, Plymouth, UK
9Bayworld Centre for Research and Education, Cape Town, South Africa 10Département de biologie, chimie et géographie, Université du Québec à Rimouski,
Rimouski (Québec), Canada
11European Commission, Joint Research Centre, Ispra, Italy
12Institute of Marine Science and Technology, Dokuz Eylul University, Izmir, Turkey 13CSIRO Oceans and Atmosphere, Canberra, Australia
14CNR IREA, Milan, Italy
15Monterey Bay Aquarium Research Institute, Moss Landing, CA, USA
16Laboratoire d’Océanographie de Villefranche (LOV), Sorbonne Universités, UPMC Univ Paris 06, INSU-CNRS, 181 Chemin du Lazaret, 06230 Villefranche-sur-Mer, France
17Naval Research Laboratory, Stennis Space Center, Kiln, MS, USA
18Scripps Institution of Oceanography, University of California, San Diego, CA, USA 19Spanish Institute of Oceanography (IEO), Corazón de María 8, 28002 Madrid, Spain
20Plentziako Itsas Estazioa/Euskal Herriko Unibetsitatea (PIE/EHU), Areatza z/g, 48620 Plentzia, Spain 21Environmental Research Institute, North Highland College, University of the Highlands and Islands,
Thurso, Scotland, UK
22NASA Goddard Space Flight Center, Greenbelt, Maryland, USA
23Operational Oceanography Group, Federal Maritime and Hydrographic Agency, Hamburg, Germany 24Department of Ecology, Environment and Plant Sciences, Frescati Backe, Stockholm University,
106 91 Stockholm, Sweden
27NASA Goddard Space Flight Center, Wallops Flight Facility, Wallops Island, VA, USA 28Institute for Marine Remote Sensing/ImaRS, College of Marine Science, University of South Florida,
St. Petersburg, FL, USA
29Fisheries and Ecosystem Advisory Services, Marine Institute, Rinville, Oranmore, Galway, Ireland 30NOAA/NESDIS/STAR/SOCD, College Park, MD, USA
31Ocean Biogeochemistry and Ecosystems, National Oceanography Centre, Waterfront Campus, Southampton, UK
32IFREMER Centre de Brest, Plouzane, France
33Biology Department, Woods Hole Oceanographic Institution, Woods Hole, MA, USA 34Harbor Branch Oceanographic Institute, Fort Pierce, FL, USA
35Physics Department, University of Miami, Coral Gables, FL, USA
36Physical Oceanography, Marine Optics & Remote Sensing, Royal Netherlands Institute for Sea Research, Texel, Netherlands
Correspondence to:André Valente ([email protected])
Received: 11 November 2015 – Published in Earth Syst. Sci. Data Discuss.: 19 January 2016 Revised: 18 May 2016 – Accepted: 19 May 2016 – Published: 3 June 2016
Abstract. A compiled set of in situ data is important to evaluate the quality of ocean-colour satellite-data records. Here we describe the data compiled for the validation of the ocean-colour products from the ESA Ocean Colour Climate Change Initiative (OC-CCI). The data were acquired from several sources (MOBY, BOUSSOLE, AERONET-OC, SeaBASS, NOMAD, MERMAID, AMT, ICES, HOT, GeP&CO), span between 1997 and 2012, and have a global distribution. Observations of the following variables were compiled: spectral remote-sensing reflectances, concentrations of chlorophylla, spectral inherent optical properties and spectral diffuse attenuation coefficients. The data were from multi-project archives acquired via the open internet services or from individual projects, acquired directly from data providers. Methodologies were implemented for homogenisation, quality control and merging of all data. No changes were made to the original data, other than averaging of observations that were close in time and space, elimination of some points after quality control and conversion to a standard format. The final result is a merged table designed for validation of satellite-derived ocean-colour products and available in text format. Metadata of each in situ measurement (original source, cruise or experiment, principal investigator) were preserved throughout the work and made available in the final table. Using all the data in a validation exercise increases the number of matchups and enhances the representativeness of different marine regimes. By making available the metadata, it is also possible to analyse each set of data separately. The compiled data are available at doi:10.1594/PANGAEA.854832 (Valente et al., 2015).
1 Introduction
Currently, there are several bio-optical in situ datasets world-wide suitable for validation of ocean-colour satellite data. While some are managed by the data producers, others are in international repositories with contributions from multi-ple scientists. Many have rigid quality controls and are built specifically for ocean-colour validation. The use of only one of these datasets would limit the number of data in valida-tion exercises. It would therefore be useful to acquire and merge all these datasets into a single unified dataset to max-imise the number of matchups available for validation and their distribution in time and space and consequently reduce the uncertainties in the validation exercise. However, merg-ing several datasets together can be a complicated task. First, it is necessary to acquire and harmonise all datasets into a single standard format. Second, during the merging, the
du-plicates between datasets have to be identified and removed. Third, the metadata should be propagated throughout the pro-cess and made available in the final merged product. Ideally, the compiled dataset would be made available as a simple text table, to facilitate ease of access and manipulation. In this work such unification of multiple datasets is presented. This was done for the validation of the ocean-colour products from the ESA Ocean Colour Climate Change Initiative (OC-CCI), but with the intent to serve the broad user community as well.
even-tually have been modified by the processing routines used by the repositories or archives. Nevertheless, to minimise these potential drawbacks, we have, for the most part, incorporated only datasets that have emerged from the long-term efforts of the ocean-colour and biological oceanographic communities to provide scientists with high-quality in situ data and im-plemented additional quality checks on the data to enhance confidence in the quality of the merged product.
In Sect. 2 the methodologies used to harmonise and inte-grate all data, as well as a description of individual datasets acquired, are provided. In Sect. 3 the geographic distribu-tion and other characteristics of the final merged dataset are shown. Section 4 provides an overview of the data.
2 Data and methods
2.1 Preprocessing and merging
The compiled global set of bio-optical in situ data described in this work has an emphasis, though not exclusively, on open-ocean data from all geographic regions. It is com-prised of the following variables: remote-sensing reflectance (rrs), chlorophyll a concentration (chla), algal pigment ab-sorption coefficient (aph), detrital and coloured dissolved or-ganic matter absorption coefficient (adg), particle backscat-tering coefficient (bbp) and diffuse attenuation coefficient for downward irradiance (kd). A similar effort of compiling bio-optical in situ data from different sources has been recently published by Nechad et al. (2015). Given their focus on se-lected coastal regions, most of the data presented here are not part of their compilation. The variables rrs, aph, adg, bbp and kd are spectrally dependent, and this dependence is hereafter implied. The data were compiled from 10 sources of in situ data (MOBY, BOUSSOLE, AERONET-OC, SeaBASS, NO-MAD, MERMAID, AMT, ICES, HOT, GeP&CO), each de-scribed in Sect. 2.2. The compiled in situ observations have a global distribution and cover the recent period of satellite ocean-colour data between 1997 and 2012. The listed vari-ables were chosen as they are the operational satellite ocean-colour products of the ESA OC-CCI project, which currently focuses on the use of three ocean-colour satellite platforms to create a time series of satellite data: the Medium Resolu-tion Imaging Spectrometer (MERIS) of ESA, the Moderate Resolution Imaging Spectroradiometer (MODIS) of NASA, and the Sea-viewing Wide Field-of-view Sensor (SeaWiFS) of NASA, .
Rrs is a primary ocean-colour product routinely produced by several space agencies. It is defined as rrs =Lw/Es, where Lw is the upward water-leaving radiance and Es is the total downward irradiance at sea level. Remote-sensing reflectance is related to irradiance reflectance (Rw) approx-imately through rrs=Rw/ Q, whereQranges from 3 to 5 in natural waters and is equal to π for an isotropic (Lam-bertian) light field. Another quantity that is often required is the “normalised” water-leaving radiance (nLw) (Gordon
and Clark, 1981), which is related to remote-sensing re-flectance via rrs=nLw/Fo, where Fo is the top-of-the-atmosphere solar irradiance. If not directly available, remote-sensing reflectance was calculated through the equations de-scribed above, depending on the format of the original data. The original data were acquired in an advanced form (e.g. time-averaged, extrapolated to surface) from six data sources particularly designed for ocean-colour validation (MOBY, BOUSSOLE, AERONET-OC, SeaBASS, NOMAD, MER-MAID), therefore only requiring the conversion to a com-mon format. In the processing made by the space agencies, the quantity rrs is normalised to a single Sun-viewing geom-etry (Sun at zenith and nadir viewing) taking in account the bidirectional effects as described in Morel and Gentili (1996) and Morel et al. (2002). Thus, for consistency with the satel-lite rrs product, only in situ rrs that included the latter nor-malisation was included in the compilation.
observations at multiple depths, which, given our decision to use only in vitro measurements, would have reduced consid-erably the final number of observations.
With regard to the inherent optical properties (aph, adg, bbp), if not already calculated and provided in the con-tributed datasets, they were computed from related vari-ables that were available: particle absorption (ap), detrital absorption (ad), coloured dissolved organic matter (CDOM) absorption (ag) and total backscattering (bb). The follow-ing equations were used adg=ad+ag, ap=aph+ad and bb=bbp+bbw. For the latter equation, the variable bbw was computed using bbw=bw/2, where bw is the scatter-ing coefficient of seawater derived from Zhang et al. (2009). The diffuse attenuation coefficient for downward irradiance (kd) did not require any conversion and was compiled as originally acquired. Observations of inherent optical prop-erties (surface values) and diffuse attenuation coefficient for downward irradiance, were acquired from three data sources particularly designed for ocean-colour validation (SeaBASS, NOMAD, MERMAID) and were thus already subject to the processing routines of these datasets.
The merged dataset was compiled from 10 sets of in situ data, which were obtained individually either from archives that incorporate data from multiple contributors (SeaBASS, NOMAD, MERMAID and ICES) or from par-ticular measurement programs or projects (MOBY, BOUS-SOLE, AERONET-OC, HOT, GeP&CO, AMT) and were subsequently homogenised and merged. Data contributors are listed in Table 2. There were methodological differences between datasets. Therefore, after acquisition, and prior to any merging, each set of data was preprocessed for qual-ity control and conversion to a common format. During this process, data were discarded if they had (1) unrealistic or missing date, time and geographic coordinate fields; (2) poor quality (e.g. original flags) or a method of observation that did not meet the criteria for the dataset (e.g. in situ fluo-rescence for chlorophyll concentration); and (3) spuriously high or low data. For the latter, the following limits were imposed: for chla_fluor and chla_hplc [0.001–100] mg m−3; for rrs [0–0.15] sr−1; for aph, adg and bbp [0.0001–10] m−1; for kd [aw(λ)–10] m−1, where aw is the pure water absorp-tion coefficients derived from Pope and Fry (1997). Also dur-ing this stage, three metadata strdur-ings were attributed to each observation: dataset, subdataset and pi. The dataset contains the name of the original set of data, and can only be one of the following: “aoc”, “boussole”, “mermaid”, “moby”, “nomad”, “seabass”, “hot”, “ices”, “amt” or “gepco”. The subdataset starts with the dataset identifier and is followed by additional information about the data, in the format <dataset>_<cruise/station/site>) (e.g. seabass_car71). The pi contains the name of the principal investigator(s). An effort was made to homogenise the names of principal investigators from the different sets of data. These three metadata are the link to trace each observation to its origin and were prop-agated throughout the processing. Finally, this processing
stage ended with each set of data being scanned for replicate variable data and replicate station data, which when found, were averaged if the coefficient of variation was less than 50 %; otherwise they were discarded. Replicates were de-fined as multiple observations of the same variable, with the same date, time, latitude, longitude and depth. Replicate sta-tion data were defined as multiple measurements of the same variable, with the same date, time, latitude and longitude. For the latter case, a search window of 5 min in time and 200 m in distance was given, to account for station drift. A small number of observations that were identified as replicates had different subdataset identifiers (i.e. a different cruise name). These observations were considered suspicious if the values were different and were discarded. If the values were the same, one of the observations was retained. This possibly originated from the same group of data being contributed to an archive by two different principal investigators.
Geophys-ical Data Center ETOPO1; Amante and Eakins, 2009). For observations where the closest water depth was above sea level (e.g. data collected very near the coast), it was given the value of zero.
Data processing thus included two major steps: prepro-cessing and merging. The first step was related to each set of contributing datasets in particular and aimed to identify problems and convert the data of interest to a standard for-mat. The second step dealt with the integration of all data into one unique file and included the elimination of dupli-cated data between the individual sets of data acquired. In the next subsections a brief overview of each original set of data is provided.
2.2 Preprocessing of each set of data
2.2.1 Marine Optical Buoy (MOBY)
The Marine Optical Buoy (MOBY) is a fixed mooring sys-tem operated by the National Oceanic and Atmospheric Ad-ministration (NOAA) that provides a continuous time series of water-leaving radiance and surface irradiance in the visi-ble region of the spectra from 1997 onwards. The site is lo-cated a few kilometres west of the Hawaiian island of L¯ana’i where the water depth is about 1200 m. Since its deployment, MOBY measurements have been the primary basis for the on-orbit vicarious calibrations of the SeaWiFS and MODIS ocean-colour sensors. A full description of the MOBY sys-tem and processing is provided in Clark et al. (2003). Data are freely available for scientific use at the MOBY Gold di-rectory. The products of interest are the Scientific Time Se-ries files, which refer to MOBY data averaged over sensor-specific wavelengths and particular hours of the day (around 20:00–23:00 UTC). For this work, the satellite band-average products for SeaWiFS, MODIS AQUA and MERIS were compiled from the January 2005 reprocessing for the early data and from the latest reprocessing for data after 2011. The “inband” average subproduct was used, and to main-tain the highest quality, only data determined from the upper two arms (Lw1) and flagged “good” quality were acquired. Data from the MOBY203 deployment were discarded due to the absence of surface irradiance data. The compiled vari-able was the remote-sensing reflectance, rrs, which was com-puted from the original water-leaving radiance (Lw) and sur-face irradiance (Es). The water-leaving radiances were cor-rected for the bidirectional nature of the light field (Morel and Gentili, 1996; Morel et al., 2002) using the same look-up table and method as that used in the SeaWiFS Data Analy-sis System (SeaDAS) processing code. As mentioned before, the MOBY data compiled in this work are sensor-specific. Therefore, attention is necessary to use the correct MOBY data when validating a particular sensor. The way MOBY data are stored in the final merged table is consistent with the original wavelengths; however, these wavelengths can differ from what is sometimes expected to be the central
wavelength of a given band and sensor. Irrespective of the wavelength where MOBY data are stored in the final ta-ble, for validation of bands 1–6 of SeaWiFS, MOBY data stored in the final merged table at 412, 443, 490, 510, 555 and 670 nm, respectively, should be used. For validation of bands 1–6 of MODIS AQUA, MOBY data stored in the final merged table at 416, 442, 489, 530, 547 and 665 nm, respec-tively, should be used. Finally, for validation of bands 1–7 of MERIS, MOBY data stored in the final merged table at 410.5, 440.4, 487.8, 507.7, 557.6, 617.5 and 662.4 nm, re-spectively, are the appropriate data.
2.2.2 BOUée pour l’acquiSition de Séries Optiques à Long termE (BOUSSOLE)
quality control step was to remove days where the standard deviation was more than half of the daily average. This was meant to identify days with high variability. Very few days (N =2) were removed with this test. These quality control criteria were applied per wavelength, which resulted in some observations with an incomplete spectrum.
2.2.3 AErosol RObotic NETwork-Ocean Color (AERONET-OC)
The AErosol RObotic NETwork-Ocean Color (AERONET-OC) is a component of AERONET, including sites where sun photometers operate with a modified measurement pro-tocol leading to the determination of the fully normalised water-leaving radiance (Zibordi et al., 2006, 2009). The result of collaboration between the Joint Research Centre (JRC) and NASA, this component has been specifically de-veloped for the validation of ocean-colour radiometric prod-ucts. The strength of AERONET-OC is “the production of standardised measurements that are performed at different sites with identical measuring systems and protocols, cali-brated using a single reference source and method, and pro-cessed with the same codes” (Zibordi et al., 2006, 2009). All high-quality data (level 2) were acquired from the project website for 11 sites: Abu_Al_Bukhoosh (∼25◦N,∼53◦E), COVE_SEAPRISM (∼36◦N, ∼75◦W), Gloria (∼44◦N, ∼29◦E), Gustav_Dalen_Tower (∼58◦N,∼17◦E), Helsinki Lighthouse (∼59◦N,∼24◦E), LISCO (∼40◦N,∼73◦W), Lucinda (∼18◦S, ∼146◦E), MVCO (∼41◦N, ∼70◦W), Palgrunden (∼58◦N, ∼13◦E), Venice (∼45◦N, ∼12◦E) and WaveCIS_Site_CSI_6 (∼28◦N, ∼90◦W). The piled variable was rrs. Remote-sensing reflectance was com-puted from the original fully normalised water-leaving radi-ance (see Sect. 2.2.2 for definition). The solar irradiradi-ance (Fo), which is not part of the AERONET-OC data, was computed from the Thuillier (2003) solar spectrum irradiance by av-eraging Fo over a wavelength-centred 10 nm window. Data were compiled for the exact wavelengths of each record, which can change over time for a given site depending on the specific instrument deployed.
2.2.4 SeaWiFS Bio-optical Archive and Storage System (SeaBASS)
The SeaWiFS Bio-optical Archive and Storage System (SeaBASS) is one of the largest archives of in situ marine bio-optical data (Werdell et al., 2003). It is maintained by NASA’s Ocean Biology Processing Group (OBPG) and in-cludes measurements of optical properties, phytoplankton pigment concentrations, and other related oceanographic and atmospheric data. The SeaBASS database consists of in situ data from multiple contributors, collected using a variety of measurement instruments with consistent, community-vetted protocols, from several marine platforms such as fixed buoys, hand-held radiometers and profiling instruments. Quality
control of the received data includes a rigorous series of pro-tocols that range from file format verification to the inspec-tion of the geophysical data values (Werdell et al., 2003). Ra-diometric data were acquired through the Validation search tool, which provided in situ data with matchups for particular ocean-colour sensors (Bailey and Werdell, 2006). The crite-ria in the search query were defined to have the minimal flag conditions in the satellite data in order to retrieve a greater number of matchups and therefore in situ data. Regarding phytoplankton pigment data, they were acquired through the Pigment search tool, which provides pigment data di-rectly from the archives. As stated in the SeaBASS website (see Pigment tab at http://seabass.gsfc.nasa.gov/seabasscgi/ search.cgi), the Pigment search tool was originally designed to return only in vitro fluorometric measurements, which is consistent with our approach, but over time chlorophyll a
measurements made using other methods (e.g. in situ fluo-rometry) were included in the retrieved pigment data. In the pigment data used in this work, a large number of in situ flu-orometric measurements from continuous underway instru-ments were identified and discarded. These data were firstly identified from cruises with more than 50 observations per day and then re-checked on the SeaBASS website to confirm whether indeed they were continuous underway measure-ments. A total of 148 015 such measurements were identified and discarded. Given the large volume of this group of data, it is possible that some chlorophylla observations from in situ methods may have escaped the scrutiny and made it into the final merged dataset. In the future, the SeaBASS plans to add ancillary information to the extractions, which will enable users to distinguish the different types of chlorophyll measurements. The compiled variables from SeaBASS data were: rrs, chla_hplc, chla_fluor, aph, adg, bbp and kd. No conversion was necessary since all variables were acquired in the desired format.
2.2.5 NASA bio-Optical Marine Algorithm Data set (NOMAD)
by the NOMAD creators. The compiled variables were rrs, chla_hplc, chla_fluor, aph, adg, bbp and kd. Conversion was only necessary for aph, adg and bbp and followed the proce-dures described in Sect. 2.1. For the calculation of bbp the variable bb was used with a smooth fitting to remove noise. A portion of the NOMAD data were optically weighted (for methods, see Werdell and Bailey, 2005). These data are not consistent with the protocols chosen in this work, but these observations were retained since NOMAD is a widely used dataset in ocean-colour validation.
2.2.6 MERIS Match-up In situ Database (MERMAID)
The MERIS Match-up In situ Database (MERMAID) pro-vides in situ bio-optical data matched with concurrent and comparable MERIS Level 2 satellite ocean-colour products (Barker, 2013a, b). The MERMAID in situ database consists of data from multiple contributors, measured using a vari-ety of instruments and protocols, from several marine plat-forms such as fixed buoys, hand-held radiometers and filing instruments. Comprehensive quality control and pro-tocols are used by MERMAID to integrate all the data into a common and comparable format (Barker, 2013a, b). Ac-cess to MERMAID data is limited to the MERIS Valida-tion Team, the MERIS Quality Working Group and to the in situ data contributors. For this work, access has been granted to the MERMAID database through a signed service-level agreement. The MERMAID data include subsets of sev-eral datasets used in this compilation (MOBY, AERONET-OC, BOUSSOLE, NOMAD). These observations were re-moved from the MERMAID dataset to avoid duplication (as discussed in Sect. 2.1). The compiled variables were rrs, chla_hplc, chla_fluor, aph, adg, bbp and kd. Remote-sensing reflectance was calculated by dividing byπthe original irra-diance reflectance provided. Conversion was also necessary for aph, adg and bbp and followed the procedures described in Sect. 2.1.
2.2.7 Hawaii Ocean Time-series (HOT)
The Hawaii Ocean Time-series (HOT) programme provides repeated comprehensive observations of the hydrography, chemistry and biology of the water column at a station lo-cated 100 km north of O’ahu, Hawai’i, from October 1988 onwards (Karl and Michaels, 1996). This site is represen-tative of the North Pacific subtropical gyre. Cruises are made approximately once a month to the deep-water sta-tion ALOHA (A Long-Term Oligotrophic Habitat Assess-ment; 22◦45′N, 158◦00′W). Pigment data (chla_hplc and chla_fluor) were extracted directly from the project web-site. Radiometric measurements from the HOT project are also available, but observations of rrs and kd from the HOT project were acquired in this work as part of the SeaBASS dataset.
2.2.8 Geochemistry, Phytoplankton, and Color of the Ocean (GeP&CO)
The Geochemistry, Phytoplankton, and Color of the Ocean (GeP&CO) is part of the French PROcessus Océaniques et Flux (PROOF) programme and aims to describe and under-stand the variability of phytoplankton populations and to as-sess its consequences for the geochemistry of the oceans (Dandonneau and Niang, 2007). It is based on the quarterly travels of the merchant shipContship Londonfrom France to New Caledonia. A scientific observer embarked on each travel and operated the sampling for surface water, filtration and various measurements at several hours of each day. The experiment started in October 1999 and finished in July 2002. Pigment data were extracted from the project website. The compiled variable was chla_hplc.
2.2.9 Atlantic Meridional Transect (AMT)
The Atlantic Meridional Transect (AMT) is a multidisci-plinary programme, which undertakes biological, chemical and physical oceanographic research during an annual voy-age between the UK and destinations in the South Atlantic (Robinson et al., 2006). The programme was established in 1995 and since then has completed 23 research cruises. Pig-ment data between 1997 (AMT5) and 2005 (AMT17) were provided by the British Oceanographic Data Centre (BODC) following a specific request. For any interest in the original data, the BODC is the point of contact, which ensures that if there are any updates, the most recent data are supplied. The compiled variables are chla_hplc and chla_fluor.
2.2.10 International Council for the Exploration of the Sea (ICES)
The International Council for the Exploration of the Sea (ICES) is a network of more than 4000 scientists from al-most 300 institutes, with 1600 scientists participating in ac-tivities annually. The ICES Data Centre manages a number of large dataset collections related to the marine environment covering the North East Atlantic, Baltic Sea, Greenland Sea and Norwegian Sea. The majority of data originate from na-tional institutes that are part of the ICES network of mem-ber countries. Data were provided (on 28 April 2014) from the ICES database on the marine environment (Copenhagen, Denmark) following a specific request. The ICES data were made available under the ICES data policy and if there is any conflict between this and the policy adopted by the users, then the ICES policy applies. The compiled variables were chla_hplc and chla_fluor.
3 Results
table is comprised of in situ observations between 1997 and 2012, with a global distribution, and include the fol-lowing variables: remote-sensing reflectance (rrs), chloro-phyll a concentration (chla), algal pigment absorption co-efficient (aph), detrital and coloured dissolved organic mat-ter absorption (adg), particle backscatmat-tering coefficient (bbp), and diffuse attenuation coefficient for downward irradiance (kd). All observations in the table were processed in such a way that they can be compared directly with satellite-derived ocean-colour data. The table consists of 80 524 rows and 267 columns. Each row represents a unique station in space and time, separated from each other by at least 5 min and 200 m. For each observation in a given station, there are three metadata strings: dataset, subdataset and pi. The columns of the table take the form described in Table 1. The contrib-utors of data in the table are shown in Table 2. Regarding spectral variables, all original wavelengths were preserved, which requires a large number of unique wavelengths to be maintained in the database. No band shifting was performed (though some archived data in SeaBASS and MERMAID may have been merged with nearby wavelengths) and no minimum number of wavelengths per observation was im-posed. This allows further manipulation of the table for dif-ferent purposes. In the following paragraphs, the table is analysed and the final group of observations is described for each contributing dataset; however, the numbers reported here do not reflect the original numbers in each dataset, since duplicates across contributing datasets were removed (e.g. removed NOMAD and others from MERMAID).
Observations of remote-sensing reflectance are available at 134 unique wavelengths (i.e. columns), between 405 and 1022.1 nm (Fig. 1). In total there are 44 191 observations (i.e. rows) with remote-sensing reflectance in the table. The to-tal number of observations are partitioned per contributing datasets as follows: AERONET-OC (17 405), BOUSSOLE (17 364), MOBY (4513), NOMAD (3326), MERMAID (885) and SEABASS (698). The data from AERONET-OC, BOUSSOLE and MOBY correspond to continuous time se-ries and hence the higher number of observations. The data distribution at 44Xnm and 55Xnm is provided in Fig. 2a and b, respectively. Data were first searched at 445 and 555 nm and then with a search window of up to 8 nm to also include data at 547 nm. Median values at 44Xnm range from 0.003 m−1(AERONET-OC) and 0.009 m−1(MOBY), whereas at 55Xnm the median values lie between 0.001 m−1 (MOBY) and 0.004 m−1(AERONET-OC). The observations are evenly distributed on a monthly basis in the Northern Hemisphere (Fig. 3). In the Southern Hemisphere, where the number of stations is smaller, there is a decrease in the num-ber of observations during the austral winter months (Fig. 3). For additional analysis, rrs band ratios were plotted against each other (490 : 555 vs. 412 : 443, Fig. 4). Most points are within the boundaries of the NOMAD dataset, but some scat-tered points were found. These points were retained in the ta-ble to allow further manipulation with different quality
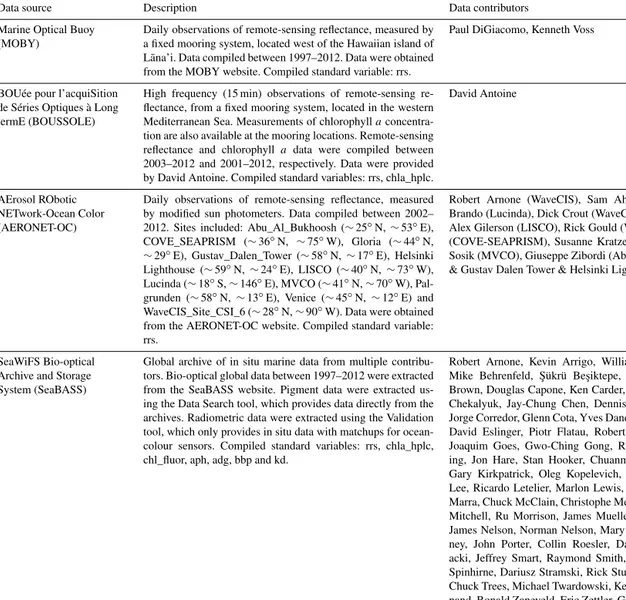
con-Table 1.The standard variables, nomenclatures and units in the fi-nal table.
Variable/column Description and units
time GMT, <YYYY-MM-DD>T<HH:MM:SS>Z lat Decimal degree,−90 : 90, south negative lon Decimal degree,−180 : 180, west negative depth_water Sampling depth (m) – all assigned to zero chla_hplc Total chlorophyllaconcentration determined
from HPLC method (mg m−3)
chla_fluor Chlorophyllaconcentration determined from fluorometric or spectrophotometric methods (mg m−3)
rrs_<band> Remote-sensing reflectance (sr−1) aph_<band> Algal pigment absorption coefficient (m−1) adg_<band> Detrital plus CDOM absorption coefficient
(m−1)
bbp_<band> Particle backscattering coefficient (m−1) kd_<band> Diffuse attenuation coefficient for downward
irradiance (m−1)
etopo1 Water depth from ETOPO1 (m) chla_hplc_dataset Metadata string for chla_hplc chla_hplc_subdataset Metadata string for chla_hplc chla_hplc_pi Metadata string for chla_hplc chla_fluor_dataset Metadata string for chla_fluor chla_fluor_subdataset Metadata string for chla_fluor chla_fluor_pi Metadata string for chla_fluor rrs_dataset Metadata string for rrs rrs_subdataset Metadata string for rrs rrs_pi Metadata string for rrs aph_dataset Metadata string for aph aph_subdataset Metadata string for aph aph_pi Metadata string for aph adg_dataset Metadata string for adg adg_subdataset Metadata string for adg adg_pi Metadata string for adg bbp_dataset Metadata string for bbp bbp_subdataset Metadata string for bbp bbp_pi Metadata string for bbp kd_dataset Metadata string for kd kd_subdataset Metadata string for kd kd_pi Metadata string for kd
trol criteria. Complementary analysis of remote-sensing re-flectance data is made when other variables are concurrently available and discussed further on in the text (see Figs. 11 and 16). The geographic distribution of remote-sensing re-flectance observations (Fig. 5) shows a higher number of ob-servations in some coastal regions, such as those of North America and Northern Europe. The central regions of the ocean show a lower number of observations, with the At-lantic Ocean having the highest density in relation to the other oceans. Best geographic coverage is provided by the NOMAD database. Data from SeaBASS are smaller in num-ber but are still important. Data from MERMAID are mainly located along the coasts of Europe, North America and the central region of the North Atlantic Ocean.
Table 2.Original sets of data and data contributors in the final table.
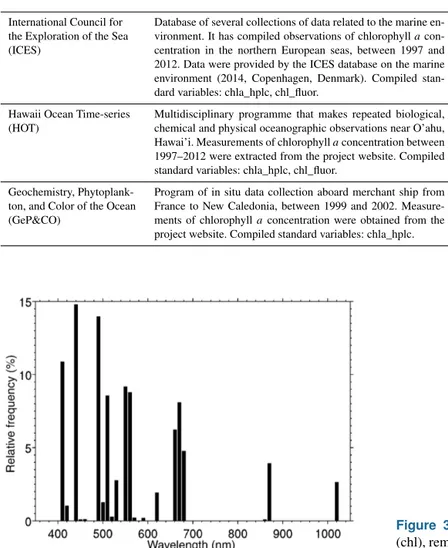
Data source Description Data contributors
Marine Optical Buoy (MOBY)
Daily observations of remote-sensing reflectance, measured by a fixed mooring system, located west of the Hawaiian island of L¯ana’i. Data compiled between 1997–2012. Data were obtained from the MOBY website. Compiled standard variable: rrs.
Paul DiGiacomo, Kenneth Voss
BOUée pour l’acquiSition de Séries Optiques à Long termE (BOUSSOLE)
High frequency (15 min) observations of remote-sensing re-flectance, from a fixed mooring system, located in the western Mediterranean Sea. Measurements of chlorophylla concentra-tion are also available at the mooring locaconcentra-tions. Remote-sensing reflectance and chlorophylla data were compiled between 2003–2012 and 2001–2012, respectively. Data were provided by David Antoine. Compiled standard variables: rrs, chla_hplc.
David Antoine
AErosol RObotic NETwork-Ocean Color (AERONET-OC)
Daily observations of remote-sensing reflectance, measured by modified sun photometers. Data compiled between 2002– 2012. Sites included: Abu_Al_Bukhoosh (∼25◦N,∼53◦E), COVE_SEAPRISM (∼36◦N, ∼75◦W), Gloria (∼44◦N, ∼29◦E), Gustav_Dalen_Tower (∼58◦N,∼17◦E), Helsinki Lighthouse (∼59◦N,∼24◦E), LISCO (∼40◦N,∼73◦W), Lucinda (∼18◦S,∼146◦E), MVCO (∼41◦N,∼70◦W), Pal-grunden (∼58◦N,∼13◦E), Venice (∼45◦N,∼12◦E) and WaveCIS_Site_CSI_6 (∼28◦N,∼90◦W). Data were obtained from the AERONET-OC website. Compiled standard variable: rrs.
Robert Arnone (WaveCIS), Sam Ahmed (LISCO), Vittorio Brando (Lucinda), Dick Crout (WaveCIS), Hui Feng (MVCO), Alex Gilerson (LISCO), Rick Gould (WaveCIS), Brent Holben (COVE-SEAPRISM), Susanne Kratzer (Palgruden), Heidi M. Sosik (MVCO), Giuseppe Zibordi (Abu Al Bukhoosh & Gloria & Gustav Dalen Tower & Helsinki Lighthouse & Venice)
SeaWiFS Bio-optical Archive and Storage System (SeaBASS)
Global archive of in situ marine data from multiple contribu-tors. Bio-optical global data between 1997–2012 were extracted from the SeaBASS website. Pigment data were extracted us-ing the Data Search tool, which provides data directly from the archives. Radiometric data were extracted using the Validation tool, which only provides in situ data with matchups for ocean-colour sensors. Compiled standard variables: rrs, chla_hplc, chl_fluor, aph, adg, bbp and kd.
Robert Arnone, Kevin Arrigo, William Balch, Ray Barlow, Mike Behrenfeld, ¸Sükrü Be¸siktepe, Emmanuel Boss, Chris Brown, Douglas Capone, Ken Carder, Francisco Chavez, Alex Chekalyuk, Jay-Chung Chen, Dennis Clark, Hervé Claustre, Jorge Corredor, Glenn Cota, Yves Dandonneau, Heidi Dierssen, David Eslinger, Piotr Flatau, Robert Frouin, Carlos García, Joaquim Goes, Gwo-Ching Gong, Rick Gould, Larry Hard-ing, Jon Hare, Stan Hooker, Chuanmin Hu, Sung-Ho Kang, Gary Kirkpatrick, Oleg Kopelevich, Sam Laney, Zhongping Lee, Ricardo Letelier, Marlon Lewis, Antonio Mannino, John Marra, Chuck McClain, Christophe Menkes, Mark Miller, Greg Mitchell, Ru Morrison, James Mueller, Frank Muller-Karger, James Nelson, Norman Nelson, Mary Jane Perry, David Phin-ney, John Porter, Collin Roesler, David Siegel, Mike Sier-acki, Jeffrey Smart, Raymond Smith, Heidi M. Sosik, James Spinhirne, Dariusz Stramski, Rick Stumpf, Ajit Subramaniam, Chuck Trees, Michael Twardowski, Kenneth Voss, Marcel Wer-nand, Ronald Zaneveld, Eric Zettler, Giuseppe Zibordi, Richard Zimmerman
NASA bio-Optical Marine Algorithm Data set (NOMAD)
High-quality global dataset of coincident bio-optical in situ data. The dataset was built upon SeaBASS archive. The cur-rent version (version 2.0 ALPHA, 2008) was used with an ad-ditional set of columns of remote-sensing reflectance corrected for the bidirectional nature of the light field, provided by NO-MAD creators. Data compiled between 1997–2007. Compiled standard variables: rrs, chla_hplc, chl_fluor, aph, adg, bbp and kd.
Robert Arnone, Kevin Arrigo, William Balch, Ray Barlow, Mike Behrenfeld, Chris Brown, Douglas Capone, Ken Carder, Francisco Chavez, Dennis Clark, Hervé Claustre, Jorge Corre-dor, Glenn Cota, David Eslinger, Piotr Flatau, Robert Frouin, Rick Gould, Larry Harding, Stan Hooker, Oleg Kopelevich, Marlon Lewis, Antonio Mannino, John Marra, Mark Miller, Greg Mitchell, Tiffany Moisan, Ru Morrison, Frank Muller-Karger, James Nelson, Norman Nelson, David Siegel, Ray-mond Smith, Timothy Smyth, James Spinhirne, Dariusz Stram-ski, Rick Stumpf, Ajit Subramaniam, Kenneth Voss
MERIS Match-up In situ Database (MERMAID)
Global database of in situ bio-optical data matched with concur-rent MERIS Level 2 satellite ocean-colour products. The Ex-tract matchup tool was used to acquire data. Data were com-piled between 2002 and 2012. Access was granted through a signed Service Level Agreement. Compiled standard variables: rrs, chla_hplc, chl_fluor, aph, adg, bbp and kd.
Simon Bélanger, Jean-François Berthon, Vanda Brotas, Elisa-betta Canuti, Pierre Yves Deschamps, Annelies Hommersom, Mati Kahru, Holger Klein, Hubert Loisel, David McKee, Greg Mitchell, Michael Ondrusek, Michel Repecaud, David Siegel, Giuseppe Zibordi
Atlantic Meridional Transect (AMT)
Multidisciplinary programme that makes biological, chemical and physical oceanographic measurements during an annual voyage between the United Kingdom and destinations in the South Atlantic. It has compiled observations of chlorophylla concentration between 1997 (AMT5) and 2005 (AMT17). Data were provided by the British Oceanographic Data Centre (BODC). Compiled standard variables: chla_hplc, chl_fluor.
Table 2.Continued.
International Council for the Exploration of the Sea (ICES)
Database of several collections of data related to the marine en-vironment. It has compiled observations of chlorophylla con-centration in the northern European seas, between 1997 and 2012. Data were provided by the ICES database on the marine environment (2014, Copenhagen, Denmark). Compiled stan-dard variables: chla_hplc, chl_fluor.
Not available
Hawaii Ocean Time-series (HOT)
Multidisciplinary programme that makes repeated biological, chemical and physical oceanographic observations near O’ahu, Hawai’i. Measurements of chlorophyllaconcentration between 1997–2012 were extracted from the project website. Compiled standard variables: chla_hplc, chl_fluor.
Bob Bidigare, Matthew Church, Ricardo Letelier, Jasmine Nahorniak
Geochemistry, Phytoplank-ton, and Color of the Ocean (GeP&CO)
Program of in situ data collection aboard merchant ship from France to New Caledonia, between 1999 and 2002. Measure-ments of chlorophyllaconcentration were obtained from the project website. Compiled standard variables: chla_hplc.
Yves Dandonneau
Figure 1.Relative spectral frequency of remote-sensing reflectance in the final table, using 10 nm wide class intervals, defined as the ratio of the number of observations at a particular waveband to the total number of observations at all wavebands, multiplied by 100 to report results in percentage. Data at a total of 134 unique wave-lengths, between 405 and 1022.1 nm, were compiled.
Figure 2. The distribution of (a)rrs at 44Xnm and (b) rrs at 55Xnm. Data were first searched at 445 and 555 nm and then with a search window of up to 8 nm to include data at 547 nm. The black boxes delimit the percentiles 0.25 and 0.75 of the data and the black horizontal lines show the extension of up to the 5th and 95th per-centiles. The red line represents the median value and the black cir-cles the values below (and above) the percentile 0.05 (0.95). The number of measurements of each dataset is reported on the right axis of the graph.
Figure 3. Temporal distribution of chlorophyll a concentration (chl), remote-sensing reflectance (rrs), algal pigment absorption co-efficient (aph), detrital plus CDOM absorption coco-efficient (adg), particle backscattering coefficient (bbp) and the diffuse attenua-tion coefficient for downward irradiance (kd) in the final table. All chlorophyll data were considered, but for a given station HPLC data were selected if available. Colours indicate the number of stations available for each variable, as a function of months and the hemi-spheres of data acquisition (N – Northern Hemisphere; S – Southern Hemisphere).
Figure 4. Ranges of remote-sensing reflectance band ratios (412 : 443 and 490 : 555) for all data. The points from the NOMAD dataset are shown in blue for reference. The total number of points is divided between MOBY (4513), AERONET-OC (17 293), BOUS-SOLE (3533), NOMAD (3120), SeaBASS (432) and MERMAID (677). To maximise the number of ratios per dataset, a search win-dow of up to 12 nm was used when the four wavelengths (412, 443, 490, 555) were not simultaneously available. The effect of different search windows was negligible in the ratio distribution.
Figure 5. Global distribution of remote-sensing reflectance per dataset in the final table. The data sources are identified with dif-ferent colours. Points show locations where at least one observa-tion is available. Crosses show sites from where time series data of remote-sensing reflectance are available.
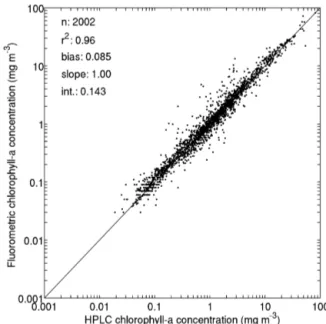
MERMAID (3711), ICES (5421), HOT (559) and AMT (164). The total number of chla_hplc observations is 13 918, ranging from 0.006 to 99.8 mg m−3 (Fig. 7), with contribu-tions from NOMAD (1309), SeaBASS (5920), MERMAID (707), ICES (2994), HOT (153), GeP&CO (1536), BOUS-SOLE (397) and AMT (902). The combined chlorophyll dataset (all chlorophyll data considered, but for a given sta-tion HPLC data were selected if available) has a total of 39 849 observations, with 11, 41 and 48 % from oligotrophic (< 0.1 mg m−3), mesotrophic (0.1–1 mg m−3) and eutrophic (> 1 mg m−3) waters, respectively. When compared with the proportions of the world ocean in these trophic classes, i.e. 56 % oligotrophic, 42 % mesotrophic and 2 % eutrophic
(An-Figure 6. Comparison of coincident observations of chloro-phylla concentration derived with different methods (chla_fluor and chla_hplc). The data were transformed prior to regression anal-ysis to account for their log-normal distribution.
Figure 7.Number of observations per chlorophyllaconcentration acquired with different methods ( chla_fluor and chla_hplc).
Figure 8.Global distribution of chlorophyllaconcentration per in-tervals of the observed value. All chlorophyll data were considered, but for a given station HPLC data were selected if available.
Figure 9. Global distribution of chlorophyll aconcentration per dataset in the final table. All chlorophyll data were considered, but for a given station HPLC data were selected if available.
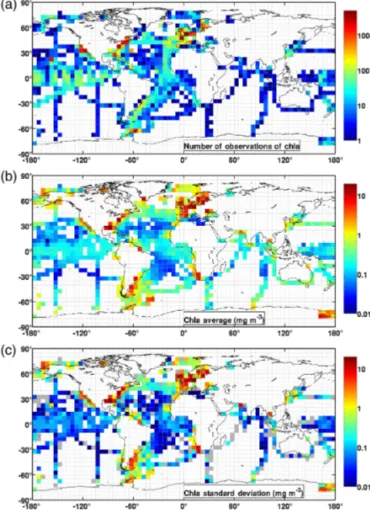
Indian oceans). Of the contributing datasets, NOMAD and SeaBASS provide a good spatial coverage in many regions (Fig. 9). The ICES and MERMAID data are mainly located along the coastal regions of Europe. The AMT data cover the central part of the Atlantic Ocean. For additional analysis and as an example of the applications of the compiled dataset, the combined chlorophyll data (chla_fluor and chla_hplc) were partitioned into 5◦×5◦boxes and for each box the number of observations, average value and standard deviation were computed (Fig. 10 a, b and c, respectively). The number of observations can be very high (> 1000) in some boxes along the European and North American coastlines and relatively low (< 20) in oceanic regions. Again there is an appearance in the average value map (Fig. 10b) of well-known biogeo-graphical features, such has the lower chlorophyll in the sub-tropical gyres and high values in coastal and upwelling areas. There is a close correspondence between the spatial patterns of the averaged and standard deviation maps (Fig. 10 b and c), which may be an indicator of the data quality.
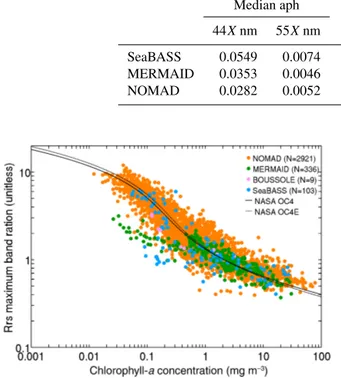
Coincident observations of chlorophyll a concentration and remote-sensing reflectance are available at 3562 sta-tions. These observations are mostly from NOMAD (85 %), MERMAID (10 %) and SeaBASS (5 %). The maximum of three band ratios of remote-sensing reflectance is
Figure 10. The chlorophyll a (mg m−3) data partitioned into 5◦×5◦boxes showing the(a)number of observations,(b)average value and(c)standard deviation in each box. All chlorophyll data were considered, but for a given station HPLC data were selected if available. In the standard deviation plot, grey represents boxes with zero standard deviation (i.e. one observation).
plotted against chlorophyll a concentration (Fig. 11). The chla values used are the combined HPLC and flu-orometric chlorophyll a, and for rrs the closest spectral observation within 2 nm was used. The maximum band ratios were calculated using the maximum value from [rrs(443)/rrs(555), rrs(490)/rrs(555), rrs(510)/rrs(555)] or [rrs(443)/rrs(560), rrs(490)/rrs(560), rrs(510)/rrs(560)] if rrs(555) was not available. The relationship between maximum band ratio and chlorophyll is close to the NASA OC4 and OC4E v6 standard algorithm (http://oceancolor.gsfc.nasa.gov/cms/atbd/chlor_a), equally based on maximum band ratios, providing confidence in the quality of the compiled data.
Table 3.Summary of median values for aph, adg and bbp at 44Xand 55Xnm for each dataset (as shown in Fig. 12a–f). Data were first searched at 445 and 555 nm and then with a search window of up to 8 nm to include data at 547 nm.
Median aph Median adg Median bbp
44Xnm 55Xnm 44Xnm 55Xnm 44Xnm 55Xnm
SeaBASS 0.0549 0.0074 0.0711 0.0222 0.0035 0.0025 MERMAID 0.0353 0.0046 0.0515 0.0112 0.0030 0.0022
NOMAD 0.0282 0.0052 0.1149 0.0286 0.0080 0.0052
Figure 11.A remote-sensing reflectance maximum band ratio (as defined in text) ([443,490,510]/555 or [443,490,510]/560 if 555 not available) as a function of chlorophyll a concentration. All chlorophyll data were considered, but for a given station HPLC data were selected if available. Data within 2 nm of the wave-lengths were used. For reference the solid and dotted line show the NASA OC4 and OC4E v6 standard algorithms, respectively (http://oceancolor.gsfc.nasa.gov/cms/atbd/chlor_a). The total num-ber of points was 3369, of which 86% were from NOMAD.
SeaBASS (14) and MERMAID (72). For adg the contribu-tions are as follows: NOMAD (1079), SeaBASS (11) and MERMAID (33). The bbp observations come from NO-MAD (371), SeaBASS (32) and MERMAID (235). Data distribution of aph, adg and bbp at 44X and 55Xnm for each dataset is provided in Fig. 12a–f. Median val-ues of aph, adg and bbp at 44X and 55Xnm for each dataset are summarised in Table 3. For additional analy-sis, the following band ratios for the absorption coefficients were calculated: aph(490)/aph(443), aph(412)/aph(443), adg(443)/adg(490) and adg(412)/adg(443). Data within 2 nm of the wavelengths were used to maximise the number of points. The distribution of the ratios is shown in Fig. 13. Several observations were found to be above the thresh-olds used in the IOCCG report 5 (IOCCG, 2006) for qual-ity control (see dotted vertical black lines in Fig. 13). These points are highlighted here for information but retained in the database, as these were mostly from NOMAD and there was an interest to preserve this dataset as a whole. Also, not dis-carding this data allows further manipulation with different
Figure 12. The distribution of (a) aph at 44Xnm, (b) aph at 55Xnm,(c)adg at 44Xnm,(d)adg at 55Xnm,(e)bbp at 44Xnm, (f)bbp at 55Xnm,(g)kd at 44Xnm and(h)kd at 55Xnm. Data were first searched at 445 and 555 nm and then with a search win-dow of up to 8 nm to include data at 547 nm. The graphical conven-tion is identical to Fig. 2.
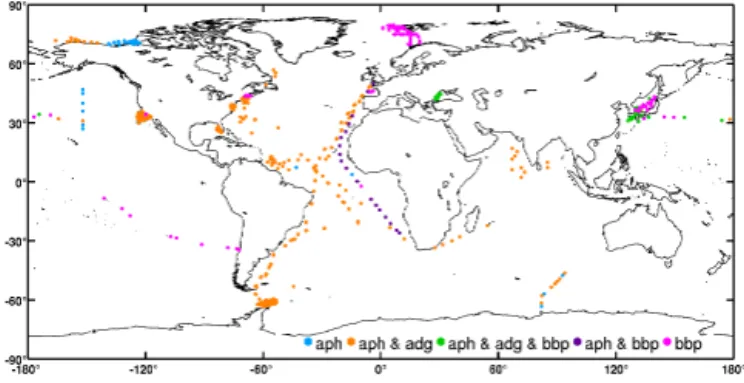
quality control criteria. On the annual scale, the observations of the inherent optical properties are strongly underrepre-sented in the Southern Hemisphere where there is a complete absence of data in several months of the year (Fig. 3). Over-all, the geographic coverage for observations of aph, adg and bbp (Fig. 14) is poor, with most open-ocean regions not be-ing sampled, with the exception of the Atlantic Ocean. Small clusters of data are located in particular coastal regions.
obser-Figure 13.The distribution of absorption coefficient band ratios: adg(443)/adg(490), adg(412)/adg(443), aph(490)/aph(443) and aph(412)/aph(443). Data within 2 nm of the wavelengths were used. The graphical convention is identical to Fig. 2. The vertical dashed lines show the lower and upper thresholds used for quality control in the IOCCG report 5 (IOCCG, 2006). The total number of points are divided between NOMAD (93–96 %), MERMAID (3– 6 %) and SeaBASS (1 %).
Figure 14.Global distribution of observations of inherent optical properties (algal pigment absorption coefficient aph, detrital plus CDOM absorption coefficient adg and particle backscattering coef-ficient bbp) in the final table.
vations, from NOMAD (2266), SeaBASS (118) and MER-MAID (70). Data distribution of kd at 44Xand 55Xnm for each dataset is shown in Fig. 12g and h. No kd data at these wavelengths were available for the SeaBASS dataset (only at 490 nm). Median values of kd at 44Xnm span between 0.08 m−1 (NOMAD) to 0.1 m−1 (MERMAID), whereas at 55Xnm the kd values are approximately 0.1 m−1(NOMAD and MERMAID). NOMAD provides the best geographic coverage (Fig. 15), with a higher coverage in the Atlantic, compared with other oceans. With the exception of the coastal regions of North America and the Japan Sea, most coastal regions are not sampled. In the Northern Hemisphere, kd is distributed roughly evenly across all months of the year, but in the Southern Hemisphere there are few data points dur-ing the austral winter and none at all in September (Fig. 3).
Although most of the stations with concurrent vari-ables are mainly from the NOMAD dataset, for
complete-Figure 15.Global distribution of diffuse attenuation coefficient for downward irradiance (kd) per dataset in the final table.
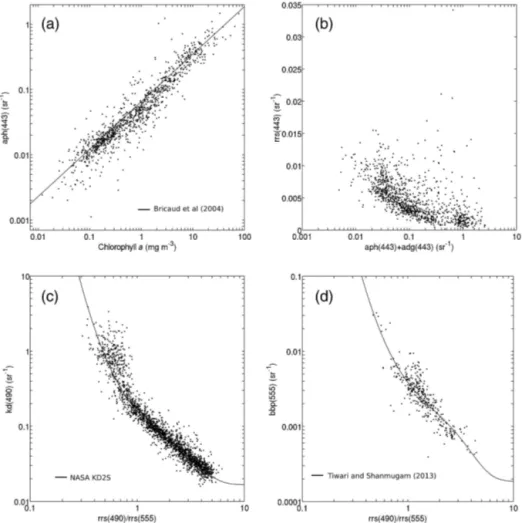
ness, an examination of bio-optical relationships is provided (Fig. 16). The relation between aph at 443 nm and chloro-phyll a (Fig. 16a) agrees with the relation proposed by Bricaud et al. (2004). A total of 1070 points exist with these two variables available (93 % from NOMAD). The relation between the sum of aph and adg at 443 nm and rrs at 443 nm (Fig. 16b) shows a similar dispersion, with the exception of some scattered points, to an equivalent analysis on the IOCCG report 5 (see their Fig. 2.3). Again, the scattered data were retained in the final table to preserve the NOMAD dataset. A total of 1112 points exist for which these three variables are available (97 % from NOMAD). The relation between the ratio rrs(490)/rrs(555) and kd(490) (Fig. 16c) shows a good agreement with the NASA KD2S standard al-gorithm (http://oceancolor.gsfc.nasa.gov/cms/atbd/kd_490). A total of 2280 points exist for which these three variables are available (93 % from NOMAD). The relation between the ratio rrs(490)/rrs(555) and bbp at 555 nm (Fig. 16c) shows a good agreement with the relation suggested by Tiwari and Shanmugam (2013). A total of 357 points exist for which these three variables are available (91 % from NOMAD).
4 Conclusions
A compilation of bio-optical in situ data is presented in this work. The compiled data have global coverage and span from 1997 to 2012, covering the recent period of ocean-colour satellite observations. They resulted from the acquisition, ho-mogenisation and integration of several sets of data obtained from different sources. Minimal changes were made to the original data, except for those necessary for conversion to standard format and quality control. In situ measurements of the following variables were compiled: remote-sensing re-flectance, chlorophyllaconcentration, algal pigment absorp-tion coefficient, detrital and coloured dissolved organic mat-ter absorption coefficient, particle backscatmat-tering coefficient and diffuse attenuation coefficient for downward irradiance.
Figure 16.Examples of bio-optical relationships in the final merged table. Panel(a): aph(443) vs. chlorophylla. Total number of points (1070) is divided between MERMAID (70), NOMAD (991) and SeaBASS (9). For reference the solid line show the regression from Bricaud et al. (2004). Panel(b): [aph(443)+adg(443)] vs. rrs(443). Total number of points (1112) is divided between MERMAID (33) and NOMAD (1079). Panel(c): [rrs(490)/rrs(555)] vs. kd(490). The total number of points (2280) is divided between MERMAID (62), NOMAD (2117) and SeaBASS (101). For reference the solid line show the NASA KD2S standard algorithm (http://oceancolor.gsfc.nasa.gov/cms/atbd/kd_ 490). Panel(d): [rrs(490)/rrs(555)] vs. bbp(555). The total number of points (357) is divided between MERMAID (33) and NOMAD (324). For reference the solid line show the relation proposed by Tiwari and Shanmugam (2013). A search window of 2 nm was used for panels(a) and(b), and a search window of 5 nm was used for panels(c)and(d)to include data at 560 nm when not available at 555 nm.
of satellite-derived ocean-colour data. The major advantages of this compilation are that it merges six commonly used data sources in ocean-colour validation (MOBY, BOUSSOLE, AERONET-OC, SeaBASS, NOMAD, MERMAID) and four additional sets of chlorophyll a concentration data (AMT, ICES, HOT and GeP&CO) into a simple text table free of du-plicated observations. This compilation was initially created with the intention of evaluating the quality of the satellite ocean-colour products from the ESA OC-CCI project. The
objective of publishing the compilation is to make it easy for the broader community to use it.
5 Data availability
Appendix A: Notation
ad Detrital absorption coefficient (m−1)
adg Detrital plus CDOM absorption coefficient (m−1)
AERONET-OC AErosol RObotic NETwork-Ocean Color ag CDOM absorption coefficient (m−1) AMT Atlantic Meridional Transect ap Particle absorption coefficient (m−1)
aph Algal pigment absorption coefficient (m−1)
aw Pure water absorption coefficient (m−1)
bb Total backscattering coefficient (m−1)
bbp Particle backscattering coefficient (m−1)
bbw Backscattering coefficient of seawater (m−1)
BOUSSOLE BOUée pour l’acquiSition de Séries Optiques à Long termE
CDOM Coloured dissolved organic matter chla Chlorophyllaconcentration (mg m−3) chla_fluor Chlorophyllaconcentration determined from
fluorometric or spectrophotometric methods (mg m−3)
chla_hplc Total chlorophyllaconcentration determined from HPLC method (mg m−3)
Es Surface irradiance (or above-water down-welling irradiance) (mW cm−2µm−1)
ESA European Space Agency
Fo Top-of-the-atmosphere solar irradiance (mW cm−2µm−1)
GeP&CO Geochemistry, Phytoplankton, and Color of the Ocean
HOT Hawaii Ocean Time-series
HPLC High-performance liquid chromatography ICES International Council for the Exploration of
the Sea
kd Diffuse attenuation coefficient for downward irradiance (m−1)
Lw Water-leaving radiance (or above-water upwelling radiance) (mW cm−2µm−1sr−1)
MERIS Medium Resolution Imaging Spectrometer MERMAID MERIS Match-up In situ Database MOBY Marine Optical Buoy
MODIS Moderate Resolution Imaging Spectro-radiometer
NASA National Aeronautics and Space Administration
nLw Normalised water-leaving radiance (mW cm−2µm−1sr−1)
nLw_ex nLw with a correction for bidirectional effects (mW cm−2µm−1sr−1)
NOMAD NASA bio-Optical Marine Algorithm Data set OC-CCI Ocean Colour Climate Change Initiative rrs Remote-sensing reflectance (sr−1)
SeaBASS SeaWiFS Bio-optical Archive and Storage System
SeaWiFS Sea-viewing Wide Field-of-view Sensor Rw Irradiance reflectance (dimensionless)
Appendix B: Data table
The compiled data are available at
Author contributions. The first six authors belong to the ESA OC-CCI team and contributed to the design of the compilation. The remaining authors are listed alphabetically and are data contributors (see their respective dataset on Table 2) or individuals responsible for the development of a particular dataset (Jeremy Werdell for NO-MAD and Katherine Barker for MERMAID). All data contributors (listed on Table 2) were contacted for authorisation of data pub-lishing and offered co-authorship. In the case of the ICES dataset the permission for publishing was given by the ICES team. All the authors have critically reviewed the manuscript.
Acknowledgements. This paper is a contribution to the ESA OC-CCI project. This work is also a contribution to project PEst-OE/MAR/UI0199/2014. We are grateful for the efforts of the teams responsible for the collection of the data in the field and of the teams responsible for processing and storing the data in archives, without which this work would not be possible. We thank Tamoghna Acharyya and Robert Brewin at Plymouth Marine Laboratory for their initial contribution to this work. We thank the NOAA (US) for making available the MOBY data and Yong Sung Kim for the help with questions about MOBY data. BOUSSOLE is supported and funded by the European Space Agency (ESA), the Centre National d’Etudes Spatiales (CNES), the Centre National de la Recherche Scientifique (CNRS), the Institut National des Sciences de l’Univers (INSU), the Université Pierre et Marie Curie (UPMC) and the Observatoire Océanologique de Villefranche-sur-mer (OOV). We thank ACRI-ST, ARGANS and ESA for access to the MERMAID Database (http://hermes.acri.fr/mermaid). We thank Annelies Hommersom, Pierre Yves Deschamps and David Siegel for allowing the use of MERMAID data for which they are principal investigators. We thank the British Oceanographic Data Centre (BODC) for access to AMT data and in particular Polly Hadziabdic and Rob Thomas for their help with questions about the AMT dataset. We thank Victoria Hill, Patrick Holligan, Gerald Moore and Emilio Suarez for the use of AMT data for which they are principal investigators. We thank Sam Ahmed, Hui Feng, Alex Gilerson and Brent Holben for allowing the use of the AERONET-OC data for which they are principal investigators. We thank also the AERONET staff and site support people. We thank Bob Bidigare, Matthew Church, Ricardo Letelier and Jasmine Nahorniak for making the HOT data available, and the National Science Foundation for support of the HOT research (grant OCE 09-26766). We thank Yves Dandonneau for allowing the use of GeP&CO data. We thank the ICES database on the marine environment (Copenhagen, Denmark, 2014) for allowing the use of their archived data, and Marilynn Sørensen for the help with questions about the ICES dataset. We thank all ICES contributors for their data. We thank Eric Zettler and the SEA Education Association. We thank NASA, SeaBASS and the Ocean Biology Processing Group (OBPG) for access to SeaBASS and NOMAD data. We thank NASA for project funding for data collection. We thank Chris Proctor from SeaBASS for his valuable and prompt help with a variety of questions. Finally, we are deeply thankful to the data contributors of NOMAD and SeaBASS: Kevin Arrigo, Mike Behrenfeld, Emmanuel Boss, Chris Brown, Douglas Capone, Ken Carder, Alex Chekalyuk, Jay-Chung Chen, Dennis Clark, Jorge Corredor, Glenn Cota, Yves Dandonneau, Heidi Dierssen, David Eslinger, Piotr Flatau, Joaquim Goes,
Gwo-Ching Gong, Larry Harding, Jon Hare, Chuanmin Hu, Sung-Ho Kang, Gary Kirkpatrick, Oleg Kopelevich, Sam Laney, Zhongping Lee, Ricardo Letelier, Marlon Lewis, Antonio Mannino, John Marra, Chuck McClain, Christophe Menkes, Mark Miller, Ru Morrison, James Mueller, James Nelson, Norman Nelson, Mary Jane Perry, David Phinney, John Porter, Collin Roesler, David Siegel, Mike Sieracki, Jeffrey Smart, Raymond Smith, James Spinhirne, Dariusz Stramski, Rick Stumpf, Ajit Sub-ramaniam, Chuck Trees, Ronald Zaneveld, Eric Zettler and Richard Zimmerman.
Edited by: D. Carlson
References
Amante, C. and Eakins, B. W.: ETOPO1, 1 Arc-Minute Global Relief Model: Procedures, Data Sources and Analysis, NOAA Technical Memorandum NESDIS NGDC-24. National Geo-physical Data Center, NOAA, available at: https://catalog.data. gov/dataset/etopo1-1-arc-minute-global-relief-model/resource/ 9e53be26-60cb-4139-b70c-51a2c4561bbb (last access: 3 June 2016), 2009.
Antoine, D., André, J. M., and Morel, A.: Oceanic primary produc-tion: 2. Estimation at global scale from satellite (CZCS) chloro-phyll, Global Biogeochem. Cy., 10, 57–70, 1996.
Antoine, D., Chami, M., Claustre, H., D’Ortenzio, F., Morel, A., Bécu, G., Gentili, B., Louis, F., Ras, J., Roussier, E., Scott, A. J., Tailliez, D., Hooker, S. B.,Guevel, P., Desté, J.-F., Dempsey, C., and Adams, D.: BOUSSOLE : a joint CNRS-INSU, ESA, CNES and NASA Ocean Color Calibration And Validation Ac-tivity. NASA Technical memorandum No. 2006-214147, 61 pp., available at: http://ntrs.nasa.gov/archive/nasa/casi.ntrs.nasa.gov/ 20070028812.pdf (last access: 3 June 2016), 2006.
Antoine, D., Guevel, P., Desté, J.-F., Bécu, G., Louis, F., Scott, A., and Bardey, P.: The “BOUSSOLE” Buoy – A New Transparent-to-Swell Taut Mooring Dedicated to Marine Optics: Design, Tests, and Performance at Sea. J. Atmos. Oceanic Technol., 25, 968–989, 2008.
Bailey, S. W. and Werdell, P. J.: A multi-sensor approach for the on-orbit validation of ocean color satellite data products, Remote Sens. Environ., 102, 12–23, 2006.
Barker, K.: In-situ Measurement Protocols. Part A: Ap-parent Optical Properties, Issue 2.0, Doc. no: CO-SCI-ARG-TN-0008, ARGANS Ltd., p. 126, available at: http://mermaid.acri.fr/dataproto/CO-SCI-ARG-TN-0008_ In-situ_Measurement_Protocols-AOPs_Issue2_Mar2013.pdf (last access: 3 June 2016), 2013a.
Barker, K.: In-situ Measurement Protocols. Part B: Inherent Optical Properties and in-water constituents, Issue 1.0, Doc. no: CO-SCI-ARG-TN-0008, ARGANS Ltd., p. 39, available at: http://mermaid.acri.fr/dataproto/CO-SCI-ARG-TN-0008_ In-situ_Measurement_Protocols-IOPs-Constituents_Issue1_ Mar2013.pdf (last access: 3 June 2016), 2013b.
Bricaud, A., Claustre, H., Ras, J., and Oubelkheir, K.: Natural vari-ability of phytoplanktonic absorption in oceanic waters: Influ-ence of the size sctructure of algal populations, J. Geophys. Res., 109, C11010, doi:10.1029/2004JC002419, 2004.
M., and Mueller, J. L.: MOBY, A Radiometric Buoy for Perfor-mance Monitoring and Vicarious Calibration of Satellite Ocean Colour Sensors: Measurements and Data Analysis Protocols, in: Ocean Optics Protocols for Satellite Ocean Colour Sensor Validation, edited by: Muller, J. L., Fargion, G., and McClain, C., NASA Technical Memo. 2003-211621/Rev4, Vol. VI, 3–34, NASA/GSFC, Greenbelt, MD, USA, 2003.
Dandonneau, Y. and Niang, A.: Assemblages of phytoplankton pig-ments along a shipping line through the North Atlantic and Trop-ical Pacific, Prog. Oceanogr., 73, 127–144, 2007.
Gordon, H. R. and Clark, D. K.: Clear water radiances for atmo-spheric correction of coastal zone color scanner imagery, Appl. Optics, 20, 4175–4180, 1981.
Gregg, W. W. and Carder, K. L.: A simple spectral solar irradiance model for cloudless maritime atmospheres, Limnol. Oceanogr., 35, 1657–1675, 1990.
IOCCG: Report 5: Remote Sensing of Inherent Optical Proper-ties: Fundamentals, Tests of Algorithms, and Applications, in: Reports of the International Ocean-Colour Coordinating Group, edited by: Lee, Z.-P., No. 5. vol. 5, IOCCG, 2006, Dartmouth, Canada, p. 126, 2006.
IOCCG: Why Ocean Colour? The Societal Benefits of Colour Technology, in: Reports of the International Ocean-Colour Coordinating Group, edited by: Platt, T., Hoepffner, N., Stuart, V., and Brown, C., No. 7, IOCCG, Dartmouth, Canada, 2008.
Karl, D. M. and Michaels, A. F.: The Hawaiian Ocean Time-series (HOT) and Bermuda Atlantic Time-series Study (BATS) – Pref-ace, Deep-Sea Res. II, 43, 127–128, 1996.
Morel, A. and Gentilli, B.: Diffuse Reflectance of Oceanic Waters. 3. Implications of Bidirectionality for the Remote-Sensing Prob-lem, Appl. Optics, 35, 4850–4862, 1996.
Morel, A. and Maritorena, S.: Bio-optical properties of oceanic wa-ters: A reappraisal, J. Geophys. Res., 106, 7163–7180, 2001. Morel, A., Antoine, D., and Gentilli, B.: Bidirectional reflectance
of oceanic waters: accounting for Raman emission and varying particle scattering phase function, Appl. Optics, 41, 6289–6306, 2002.
Nechad, B., Ruddick, K., Schroeder, T., Oubelkheir, K., Blondeau-Patissier, D., Cherukuru, N., Brando, V., Dekker, A., Clementson, L., Banks, A. C., Maritorena, S., Werdell, P. J., Sá, C., Bro-tas, V., Caballero de Frutos, I., Ahn, Y.-H., Salama, S., Tilstone, G., Martinez-Vicente, V., Foley, D., McKibben, M., Nahorniak, J., Peterson, T., Siliò-Calzada, A., Röttgers, R., Lee, Z., Peters, M., and Brockmann, C.: CoastColour Round Robin data sets: a database to evaluate the performance of algorithms for the re-trieval of water quality parameters in coastal waters, Earth Syst. Sci. Data, 7, 319–348, doi:10.5194/essd-7-319-2015, 2015. Pope, R. and Fry, E.: Absorption spectrum (380–700 nm) of pure
waters: II. Integrating cavity measurements, Appl. Optics, 36, 8710–8723, 1997.
Robinson, C., Poulton, A. J., Holligan, P. M., Baker, A. R., Forster, G., Gist, N., Jickells, T. D., Malin G., Upstill-Goddard, R., Williams, R. G., Woodward, E. M. S., and Zubkov, M. V.: The Atlantic Meridional Transect (AMT) Programme: a con-textual view 1995–2005, Deep-Sea Res. II, 53, 1485–1515, doi:10.1016/j.dsr2.2006.05.015, 2006.
Thuillier, G., Hersé, M., Labs, D., Foujols, T., Peetermans, W., Gillotay, D., Simon, P. C., and Mandel, H.: The solar spectral irradiance from 200 nnm to 2400 nm as measured by the SOL-SPEC spectrometer from the ATLAS 1-2-3 and EURECA mis-sions, Sol. Phys., 214, 1–22, 2003.
Tiwari, S. P. and Shanmugam, P.: An optical model for deriving the spectral particulate backscattering coefficients in oceanic waters, Ocean Sci., 9, 987–1001, 2013.
Trees, C. C., Kennicutt II, M. C., and Brooks, J. M.: Errors associ-ated with the standard fluorimetric determination of chlorophylls and phaeopigments, Mar. Chem., 17, 1–12, 1985.
Valente, A., Sathyendranath, S., Brotas, V., Groom, S., Grant, M., Taberner, M., Antoine, D., Arnone, R., Balch, W. M., Barker, K., Barlow, R., Bélanger, S., Berthon, J.-F., Besik-tepe, S., Brando, V., Canuti, E., Chavez, F. P., Claustre, H., Crout, R., Frouin, R., García-Soto, C., Gibb, S., Gould, R., Hooker, S., Kahru, M., Klein, H., Kratzer, S., Loisel, H., Mc-Kee, D,. Mitchell, G., Moisan, T., Muller-Karger, F. E., O’Dowd, L., Ondrusek, M., Poulton, A. J., Repecaud, M., Smyth, T. J., Sosik, H., Twardowski, M. S., Voss, K., Werdell, P. J., Wernand, M. R., and Zibordi, G.: A compilation of global bio-optical in situ data for ocean-colour satellite applications, doi:10.1594/PANGAEA.854832, 2015.
Werdell, P. J. and Bailey, S. W.: An improved bio-optical data set for ocean color algorithm development and satellite data product validation, Remote Sens. Environ., 98, 122–140, 2005.
Werdell, P. J., Bailey, S., Fargion, G., Pietras, C., Knobelspiesse, K., Feldman, G., and McClain, C.: Unique data repository facil-itates ocean color satellite validation, EOS Transactions AGU, 84, 377–387, 2003.
Zhang, X., Hu, L., and He, M.-X.: Scattering by pure seawater: Ef-fect of Salinity, Opt. Express, 17, 5698–5710, 2009.
Zibordi, G., Holben, B. N., Hooker, S. B., Mélin, F., Berthon, J.-F., Slutsker, I., Giles, D., Vandemark, D., Feng, H., Rutledge, K., Schuster, G., and Al Mandoos, A.: A network for standardized ocean color validation measurements, EOS Trans. Am. Geophys. Union, 87, 293–297, 2006.