ACPD
15, 9253–9291, 2015Nonlinear ozone response
S. Meul et al.
Title Page
Abstract Introduction
Conclusions References
Tables Figures
◭ ◮
◭ ◮
Back Close
Full Screen / Esc
Printer-friendly Version Interactive Discussion
Discussion
P
a
per
|
Discussion
P
a
per
|
Discussion
P
a
per
|
Discussion
P
a
per
|
Atmos. Chem. Phys. Discuss., 15, 9253–9291, 2015 www.atmos-chem-phys-discuss.net/15/9253/2015/ doi:10.5194/acpd-15-9253-2015
© Author(s) 2015. CC Attribution 3.0 License.
This discussion paper is/has been under review for the journal Atmospheric Chemistry and Physics (ACP). Please refer to the corresponding final paper in ACP if available.
Nonlinear response of modeled
stratospheric ozone to changes in
greenhouse gases and ozone depleting
substances in the recent past
S. Meul, S. Oberländer-Hayn, J. Abalichin, and U. Langematz
Institut für Meteorologie, Freie Universität Berlin, Berlin, Germany
Received: 6 February 2015 – Accepted: 2 March 2015 – Published: 27 March 2015
Correspondence to: S. Meul ([email protected])
ACPD
15, 9253–9291, 2015Nonlinear ozone response
S. Meul et al.
Title Page
Abstract Introduction
Conclusions References
Tables Figures
◭ ◮
◭ ◮
Back Close
Full Screen / Esc
Printer-friendly Version Interactive Discussion
Discussion
P
a
per
|
Discussion
P
a
per
|
Discussion
P
a
per
|
Discussion
P
a
per
|
Abstract
In the recent past, the evolution of stratospheric ozone (O3) was affected by both in-creasing ozone depleting substances (ODSs) and greenhouse gases (GHGs). The im-pact of the single forcings on O3is well known. Interactions between the simultaneously increased GHG and ODS concentrations, however, can occur and lead to nonlinear O3 5
changes. In this study, we investigate if nonlinear processes have affected O3changes between 1960 and 2000. This is done with an idealized set of timeslice simulations with the chemistry–climate model (CCM) EMAC. Nonlinearity leads to a net reduction of ozone decrease throughout the stratosphere, with a maximum of 1.2 % at 3 hPa. The total ozone column loss between 1960 and 2000 that is mainly attributed to the 10
ODS increase is mitigated in the extra-polar regions by up to 1.1 % due to nonlinear processes. A separation of the O3 changes into the contribution from chemistry and transport shows that nonlinear interactions occur in both. In the upper stratosphere a reduced efficiency of the ClOx-catalysed O3 loss chiefly causes the nonlinear O3 increase. An enhanced formation of halogen reservoir species through the reaction 15
with methane (CH4) reduces the abundance of halogen radicals significantly. The tem-perature induced deceleration of the O3 loss reaction rate in the Chapman cycle is reduced, which leads to a nonlinear O3 decrease and counteracts the increase due to ClOx. Nonlinear effects on the NOxabundance cause hemispheric asymmetric non-linear changes of the O3 loss. Nonlinear changes in O3 transport occur in particular 20
ACPD
15, 9253–9291, 2015Nonlinear ozone response
S. Meul et al.
Title Page
Abstract Introduction
Conclusions References
Tables Figures
◭ ◮
◭ ◮
Back Close
Full Screen / Esc
Printer-friendly Version Interactive Discussion
Discussion
P
a
per
|
Discussion
P
a
per
|
Discussion
P
a
per
|
Discussion
P
a
per
|
1 Introduction
During the 20th century both the emissions of ozone depleting substances (ODSs) and greenhouse gases (GHGs) increased, which had a large effect on stratospheric ozone (O3) (e.g., WMO, 2007). Observations show that between 1979 and 2000 the total column ozone decreased by 2–3 % decade−1at midlatitudes in the annual mean 5
and by up to 12 % decade−1 in the Southern Hemisphere (SH) polar region in spring (e.g., Fioletov et al., 2002). This development is mainly caused by increasing concen-trations of ODSs (e.g., WMO, 2007). As these compounds are relatively chemically inert in the troposphere, they are transported into the stratosphere where they are de-composed, releasing reactive chlorine and bromine compounds at levels well above 10
the natural background concentrations. The chlorine and bromine radicals can then initiate catalytic reaction cycles which destroy ozone (e.g., Molina and Rowland, 1974). In the polar regions in spring, this catalytic ozone loss is especially effective since the occurance of polar stratospheric clouds in winter leads to an enhanced conversion of halogen reservoir species to radicals (e.g., Solomon et al., 1986).
15
Increasing concentrations of the well-mixed GHGs carbon dioxide (CO2), methane (CH4) and nitrous oxide (N2O) affect the ozone evolution in addition to the ODS induced changes by different mechanisms. They change the radiative budget of the atmosphere and therefore cool the stratosphere (e.g., IPCC, 1996). This decelerates the O3 loss reaction, O3+O, and accelerates the reaction O2+O+M, which controls the partitioning 20
of Ox (=O+O3), and hence increases ozone (e.g., Rosenfield et al., 2002; Jonsson et al., 2004). At the same time, the temperatures of the troposphere and of the oceans increase, which alter the stratospheric meridional residual circulation (Brewer–Dobson circulation, BDC) (e.g., Garny et al., 2011a) and therefore the transport of ozone and other chemical species such as chlorine source gases (e.g., Butchart and Scaife, 2001; 25
ACPD
15, 9253–9291, 2015Nonlinear ozone response
S. Meul et al.
Title Page
Abstract Introduction
Conclusions References
Tables Figures
◭ ◮
◭ ◮
Back Close
Full Screen / Esc
Printer-friendly Version Interactive Discussion
Discussion
P
a
per
|
Discussion
P
a
per
|
Discussion
P
a
per
|
Discussion
P
a
per
|
loss (e.g., Portmann et al., 2007; Revell et al., 2012). Furthermore, the chemical pro-duction via CH4 oxidation is increased in the lower stratosphere (e.g., Johnston and Podolske, 1978; Nevison et al., 1999), while the chemical production through photoly-sis is decreased due to the reversed “self-healing” effect (e.g., Portmann et al., 2007).
Former studies have analysed the contributions from increasing GHG and ODS con-5
centrations to the past ozone change. So far, observational timeseries have been too short to clearly separate the effects using multiple linear regression (Stolarski et al., 2010). Therefore, simulations with CCMs are used for attribution studies. Different strategies for the attribution are discussed in McLandress et al. (2010), ranging from the multiple linear regression analysis of a single transient simulation including all forc-10
ings (e.g., Oman et al., 2010) to the comparison of a set of simulations with different forcings (e.g., Waugh et al., 2009). Differences among the studies arise also from the explanatory variables that are used as proxy for the GHG effect (e.g., temperature or CO2), and the processes that are considered (e.g., including composition changes by CH4 and N2O increases). However, qualitatively all studies agree and consistently 15
show that increasing ODSs are the dominant driver of past ozone loss, while the GHG increase has led to an ozone increase in the upper stratosphere (e.g., Waugh et al., 2009; Oman et al., 2010; Shepherd and Jonsson, 2008; Jonsson et al., 2009).
Since both GHG and ODS abundances have increased simultaneously in the atmo-sphere, interactions between the forcings may occur (e.g., Cicerone et al., 1983; Yang 20
and Brasseur, 2001). In most attribution studies, however, those nonlinear interactions, or buffering effects, are not considered, either by simply assuming linearity (e.g., Jon-sson et al., 2009) or by using explanatory variables that can be affected by nonlinear processes themselves (e.g. the temperature or the abundance of stratospheric halogen radicals; Jonsson et al., 2009; Nevison et al., 1999, respectively).
25
chlo-ACPD
15, 9253–9291, 2015Nonlinear ozone response
S. Meul et al.
Title Page
Abstract Introduction
Conclusions References
Tables Figures
◭ ◮
◭ ◮
Back Close
Full Screen / Esc
Printer-friendly Version Interactive Discussion
Discussion
P
a
per
|
Discussion
P
a
per
|
Discussion
P
a
per
|
Discussion
P
a
per
|
rine chemistry, a run with low CO2 concentrations and high ODS concentrations and a run with increasing levels of CO2 and high ODS levels. With this set of simulations it is possible to detect nonlinear effects. Haigh and Pyle (1982) found that the ozone changes in the upper stratosphere caused by the coupled perturbation are not equal to the sum of the individual changes. The ozone decrease due to the combined forcing 5
is larger than the ozone decrease expected from the sum of the ODS and the GHG effect. For total column ozone, they reported a decrease from 1960 values by 3.2 % due to an ODS increase to predicted 2000 levels. Total column ozone is increased by 3 % due to an increase of the CO2content from 320 to 400 ppm, a value slightly higher than actually observed in the year 2000. The combined forcing results in a change of 10
−0.6 % (compared to −0.2 % in the sum). They explained the nonlinearity with a
re-duced temperature dependency of ozone, and therefore a rere-duced positive effect of the GHGs if chlorine chemistry is considered.
A detailed analysis of nonlinear buffering effects between increasing halogen and GHG concentrations is reported in Nevison et al. (1999). They analysed the effect of 15
simultaneously increased concentrations of halogens, CH4and N2O on the NOx, HOx and halogen-catalysed ozone loss in model simulations. They found that increasing CH4together with the halogen concentrations mitigates the halogen-catalysed O3loss, since the reaction CH4+Cl leads to the formation of the reservoir species HCl and thus to a reduced ClOx/Clyratio. Furthermore, increasing N2O and hence NOxcauses 20
a buffering of the HOx and halogen-catalysed O3 loss through the formation of the reservoir species HNO3, ClONO2and BrONO2.
Since both GHGs and ODSs affect the temperature of the stratosphere, nonlinear changes in the temperature structure can have an impact on wave propagation and hence on the residual mean circulation. This is analysed in detail in McLandress et al. 25
chang-ACPD
15, 9253–9291, 2015Nonlinear ozone response
S. Meul et al.
Title Page
Abstract Introduction
Conclusions References
Tables Figures
◭ ◮
◭ ◮
Back Close
Full Screen / Esc
Printer-friendly Version Interactive Discussion
Discussion
P
a
per
|
Discussion
P
a
per
|
Discussion
P
a
per
|
Discussion
P
a
per
|
ing GHGs and ODSs. They state that the response in the zonal mean temperature, zonal mean zonal wind and the mass flux in SH spring and summer is linear within the statistical uncertainty.
For future ozone changes, the issue of additivity is briefly addressed in the study by Zubov et al. (2013) who analysed a set of timeslice simulations with the CCM SOCOL 5
focusing on the future role of GHG, ODS and SST/SIC forcing. They find positive non-linear annual mean ozone changes in the tropical upper stratosphere and the SH polar lower stratosphere. However, the underlying processes are not discussed.
In this study we want to address the question of the relevance of nonlinear processes in ozone chemistry and transport in the recent past. We aim to clarify if ozone evolu-10
tion was affected by nonlinear interactions between the increasing concentrations of well-mixed GHGs and ODSs. Therefore, we want to consider the effects of both chang-ing temperature and chemical composition, and account for nonlinear changes in all processes. This is realized with the help of an idealized set of multi-year equilibrium simulations with a state-of-the-art CCM following the strategy by Zubov et al. (2013). 15
The advantage of timeslice simulations compared to transient experiments is the im-proved statistical basis, which allows the detection of small signals. In these simulations we detect and quantify the contribution of nonlinearities to the ozone change between 1960 and 2000 and analyse the processes leading to the nonlinearities.
The study is composed as follows. In Sect. 2 the model and the experiments used in 20
this study are described. The results are discussed in Sect. 3, followed by a summary and conclusion in Sect. 4.
2 Model and experimental setup
A set of equilibrium simulations has been performed with the ECHAM/MESSy Atmo-spheric Chemistry (EMAC) CCM version 1.7 (Jöckel et al., 2006). The core atmo-25
ACPD
15, 9253–9291, 2015Nonlinear ozone response
S. Meul et al.
Title Page
Abstract Introduction
Conclusions References
Tables Figures
◭ ◮
◭ ◮
Back Close
Full Screen / Esc
Printer-friendly Version Interactive Discussion
Discussion
P
a
per
|
Discussion
P
a
per
|
Discussion
P
a
per
|
Discussion
P
a
per
|
System (MESSy1) the core model is coupled to the atmospheric chemistry module MECCA1 (Module Efficiently Calculating the Chemistry of the Atmosphere; Sander et al., 2005) and to a standard set of submodels describing tropospheric and middle atmosphere processes. Additionally, the highly resolved short-wave radiation param-eterisation FUBRad (Nissen et al., 2007) is used. The model is run with horizontal 5
resolution T42 (corresponding to a quadratic Gaussian grid of approx. 2.8◦×2.8◦) and
39 hybrid model layers between the surface and 0.01 hPa (∼80 km). Since this model
version is not coupled to an ocean model, the sea surface temperatures (SSTs) and sea ice concentrations (SICs) are prescribed. After a spin-up period, each experiment has been integrated for 40 years.
10
The performance of the EMAC model in this configuration has been evaluated in different model intercomparison studies (e.g., Austin et al., 2010; Eyring et al., 2010) with respect to the ozone evolution. EMAC is within the range of other CCMs, but the observed ozone depletion in the Antarctic spring is not fully captured by simulations with EMAC.
15
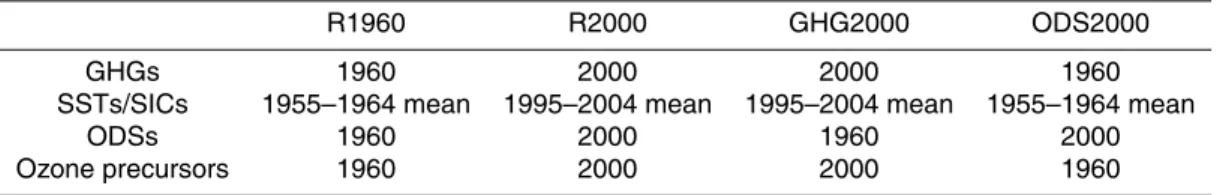
To analyse the additivity of the ozone response to the GHG and ODS forcing be-tween 1960 and 2000, four timeslice simulations are required, analogous to Haigh and Pyle (1982) and Zubov et al. (2013): Two simulations that represent the reference states of the atmosphere for the year 1960 (R1960) and the year 2000 (R2000) with observed mixing ratios of well-mixed GHGs (CO2, CH4, N2O) from the IPCC (2001) 20
and the ODSs from the WMO (2007) for the corresponding years, and two simulations in which just the GHG (GHG2000) or the ODS (ODS2000) boundary conditions are set to present day conditions while the other is kept at 1960 levels. The RETRO (RE-analysis of the TROpospheric chemical composition) data set (Schultz et al., 2007) is used for the emissions of tropospheric ozone precursors. The SSTs and SICs from 25
ACPD
15, 9253–9291, 2015Nonlinear ozone response
S. Meul et al.
Title Page
Abstract Introduction
Conclusions References
Tables Figures
◭ ◮
◭ ◮
Back Close
Full Screen / Esc
Printer-friendly Version Interactive Discussion
Discussion
P
a
per
|
Discussion
P
a
per
|
Discussion
P
a
per
|
Discussion
P
a
per
|
is no variability due to ENSO in the prescribed SSTs/SICs timeseries. Other natural forcings such as solar variability, the quasi biennial oscillation (QBO), or volcanic erup-tions are not included either. In all experiments solar mean condierup-tions are prescribed. Since no QBO-nudging is applied, easterly winds prevail in the tropical stratosphere. For reference, the specific boundary conditions used for the simulations are listed in 5
Table 1.
The response of ozone to the combined GHG and ODS forcing is determined by cal-culating the difference between the mean states of the R2000 and the R1960 simula-tions (total=R2000−R1960). With the help of the simulations GHG2000 and ODS2000
we can separate the effects due to GHGs (GHG=GHG2000−R1960) and due to ODSs
10
only (ODS=ODS2000−R1960). To test the additivity a nonlinear contribution is
cal-culated:
nonlinear=total−(GHG+ODS). (1)
It has to be noted that changes in tropospheric ozone due to changes in the ozone pre-cursors are attributed to the GHG effect when using the described attribution method. 15
The GHG effect is calculated as a combined effect from CO2, CH4and N2O changes. The attribution to specifically CO2, CH4or N2O changes is not possible. Thus, effects of interactions between the GHG induced HOxand NOxchanges, as reported for instance by Nevison et al. (1999), are not detectable.
To identify the processes causing nonlinear ozone changes, the annual mean ozone 20
change is separated into the contributions from chemistry (chemical production and loss), transport and a residual term according to the method described in Garny et al. (2011b) and Meul et al. (2014). Since the polar regions exhibit a large seasonal variabil-ity in ozone chemistry and ozone transport, the analysis must be extended to seasonal data. This means that in the attribution method the tendency term is no longer small and 25
ACPD
15, 9253–9291, 2015Nonlinear ozone response
S. Meul et al.
Title Page
Abstract Introduction
Conclusions References
Tables Figures
◭ ◮
◭ ◮
Back Close
Full Screen / Esc
Printer-friendly Version Interactive Discussion
Discussion
P
a
per
|
Discussion
P
a
per
|
Discussion
P
a
per
|
Discussion
P
a
per
|
change is interpreted as the difference in the seasonal imbalance between chemistry and transport between the climate states. In the following analysis, the tendency term is not shown, but it is considered (together with the residual term) when adding up the single contributions to the total.
To separate the chemical ozone loss into the different loss cycles, the tool 5
StratO3Bud (for details see Meul et al., 2014) is applied to the model data. As dis-cussed in Meul et al. (2014) a lower temporal resolution of the input data and a reduced set of reactions used in StratO3Bud lead, in some regions, to differences of the total ozone production and loss compared to the online integrated terms that are used for the separation into chemistry and transport. Therefore both loss quantities are shown 10
in Sect. 3 for comparison.
The uncertainty of the nonlinear signals is calculated from the joint standard devi-ations (SDs), based on the concept of error propagation. Significant changes on the 95 %/99 % confidence level are then estimated by the exceedance of two/three times the SD (2/3σ).
15
3 Results
3.1 Ozone change and its drivers
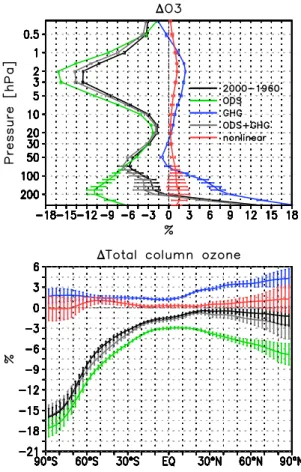
The annual mean, global mean ozone change between the years 1960 and 2000 is shown in Fig. 1 (top). Ozone mixing ratios are reduced throughout the stratosphere, with a maximum change of−12 % (=−3 % decade−1) in the upper stratosphere (black
20
line). This decrease is slightly smaller than that described in Jonsson et al. (2009) for the period 1975–1995. However, since the ozone decline was slower before 1975, the results are comparable. Consistent with the literature, the ozone decrease is mainly due to the increase in ODSs (green). Rising levels of GHGs lead to an ozone increase in the middle and upper stratosphere (by up to 2.5 %) and below 100 hPa (blue) and 25
ACPD
15, 9253–9291, 2015Nonlinear ozone response
S. Meul et al.
Title Page
Abstract Introduction
Conclusions References
Tables Figures
◭ ◮
◭ ◮
Back Close
Full Screen / Esc
Printer-friendly Version Interactive Discussion
Discussion
P
a
per
|
Discussion
P
a
per
|
Discussion
P
a
per
|
Discussion
P
a
per
|
the upper stratosphere is related to GHG-induced radiative cooling, which decelerates the temperature dependant ozone loss reactions (e.g., Rosenfield et al., 2002). The negative GHG-signal in the lower stratosphere, which is also found by Jonsson et al. (2009), originates from the tropics where a sligthly strengthened upwelling (not shown) reduces the local abundance of ozone. In the lower mesosphere, the overall ozone 5
loss is enhanced by the GHG effect. This is caused by an increase of the HOx mixing ratio which is related to the higher CH4emissions (e.g., Wuebbles and Hayhoe, 2002). A slightly negative ozone change attributed to HOx in the lower mesosphere is also reported by Oman et al. (2010) for the period 1960 to 1999.
The annual mean change in the total ozone column between 1960 and 2000 is shown 10
in Fig. 1 (bottom) for all latitudes. Total column ozone is decreased globally with the largest changes,−15 %, occuring in the SH polar region. The pattern of the changes
in the SH is qualitatively comparable to the trends derived from observations (Fig. 3-22 from WMO, 2007) for the period 1980–2004. In the tropics, however, the total ozone column change in the simulations is larger than in the observations. Furthermore, the 15
gradient in the change from the tropics to the northern high latitudes in the obser-vations is not captured by the model. Here, the different periods considered for the calculation may play a role. However, regarding the contribution from the ODSs, the ozone changes show this latitudinal gradient. This indicates that the change induced by the GHGs is too small in the tropics and too large in the Northern Hemisphere (NH), 20
which suggests a slightly stronger increase in the transport of ozone from the tropics to the high latitudes in the timeslice simulations compared to the observations.
3.2 Nonlinear processes
3.2.1 Annual mean
In the atmosphere, GHG and ODS abundances have increased simultaneously and 25
ACPD
15, 9253–9291, 2015Nonlinear ozone response
S. Meul et al.
Title Page
Abstract Introduction
Conclusions References
Tables Figures
◭ ◮
◭ ◮
Back Close
Full Screen / Esc
Printer-friendly Version Interactive Discussion
Discussion
P
a
per
|
Discussion
P
a
per
|
Discussion
P
a
per
|
Discussion
P
a
per
|
(black) is shown by the red line in Fig. 1. Throughout the stratosphere the nonlinear contribution to the annual mean global mean ozone change is positive (Fig. 1, top). The largest nonlinear effect is found in the upper stratosphere, where it is as large as 1.2 %. Here, the ozone change due to nonlinearity is about half as large as the ozone change induced by GHG changes. Statistically significant nonlinear contributions are 5
found above 100 hPa.
The vertically integrated nonlinear contribution for the different latitudes is shown in red in Fig. 1 (bottom). Significant positive changes are found in the extrapolar regions. At SH midlatitudes the nonlinear term causes up to 1.1 % increase. Nonlinearity has a slightly negative (not significant) contribution in the SH polar region in the annual 10
mean, but a slightly positive contribution (not significant) in the NH polar region. All in all, due to nonlinear interactions between changing GHG and ODS concentrations, the resulting ozone loss in the recent past is sligthly smaller than expected from the single forcings.
To analyse the processes that underlie the nonlinear ozone changes, the regions with 15
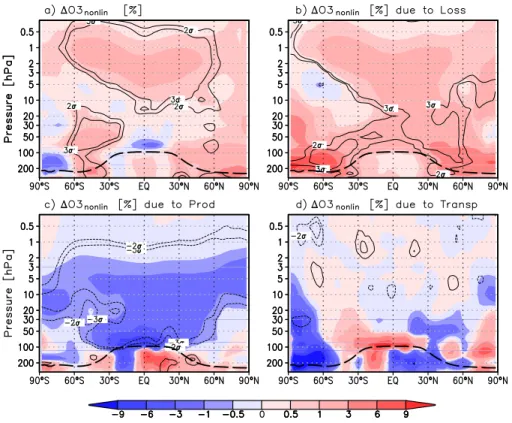
significant nonlinear changes have to be identified. In Fig. 2a, showing the vertically and latitudinally resolved annual mean nonlinear ozone change, two stratospheric regions are found: the extrapolar upper stratosphere and the SH midlatitude lower stratosphere. Both regions exhibit positive nonlinear contributions to the overall ozone change of 1– 2 %. These regions of statistically significant nonlinear changes are in relatively good 20
agreement with the regions identified by Zubov et al. (2013) for the future.
In the following we investigate which processes exhibit nonlinear interactions in the different regions. For this purpose the annual mean nonlinear ozone change is sepa-rated into the contributions from chemical ozone loss, chemical ozone production and ozone transport, shown in Fig. 2b–d, respectively. For the interpretation, it should be 25
ACPD
15, 9253–9291, 2015Nonlinear ozone response
S. Meul et al.
Title Page
Abstract Introduction
Conclusions References
Tables Figures
◭ ◮
◭ ◮
Back Close
Full Screen / Esc
Printer-friendly Version Interactive Discussion
Discussion
P
a
per
|
Discussion
P
a
per
|
Discussion
P
a
per
|
Discussion
P
a
per
|
the nonlinear ozone changes are caused by nonlinearities in the ozone chemistry, with a positive effect from ozone loss and a smaller negative from ozone production (Fig. 2b and c). In the tropical lower stratosphere and at NH midlatitudes the significant non-linear effects from ozone loss and production nearly compensate each other, leading to insignificant changes in ozone. The positive nonlinear signal in the lower strato-5
sphere at SH midlatitudes results from the contribution from both ozone chemistry and ozone transport. Nonlinear processes affecting the ozone transport cause an ozone increase in the tropical and SH midlatitudinal lower stratosphere and a decrease in the SH polar region (Fig. 2d). This indicates a reduced ozone transport into the SH polar stratosphere. However, to identify the involved processes it is necessary to analyse 10
the seasonal changes in detail, since the BDC exhibits strong seasonal variability (see Sect. 3.2.2).
The next step is to understand how the nonlinear interactions are caused and which processes are responsible. First we analyse the reasons for the nonlinearity of the chemical ozone loss by separating the contributions from the different ozone loss 15
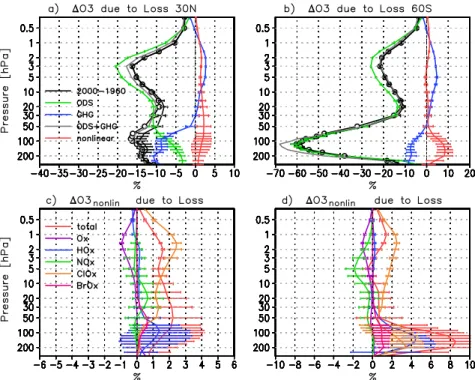
cycles, applying the tool StratO3bud. For illustration, we show the attribution of the ozone changes due to ozone loss at 30◦N and at 60◦S (Fig. 3). Note that the use of StratO3bud can lead to quantitatively different results compared to Fig. 2b, which is indicated by the additional contour line (black with circles) in the top panel. In the upper stratosphere at NH midlatitudes (Fig. 3a), the nonlinear processes are acting in the 20
same direction as the increasing GHG concentrations and are reducing the efficiency of the ozone loss, whereas the increase of the halogen loading causes an ozone de-crease due to enhanced ozone loss. In the lower stratosphere both the GHG and ODS increase enhance the ozone loss. The nonlinear contribution, however, remains pos-itive. At 60◦S (Fig. 3b) the sign of the ozone changes attributed to increassing GHG 25
ACPD
15, 9253–9291, 2015Nonlinear ozone response
S. Meul et al.
Title Page
Abstract Introduction
Conclusions References
Tables Figures
◭ ◮
◭ ◮
Back Close
Full Screen / Esc
Printer-friendly Version Interactive Discussion
Discussion
P
a
per
|
Discussion
P
a
per
|
Discussion
P
a
per
|
Discussion
P
a
per
|
stratosphere 8 % of the overall annual mean ozone change are explained by nonlinear interactions.
By analysing the nonlinear contributions from different loss cycles (Fig. 3c and d), we find that at NH midlatitudes the nonlinear ozone increase is determined by a reduced ozone loss in the catalytic chlorine loss cycle (orange) above 70 hPa. In the upper 5
stratosphere this increase is slightly counteracted by an enhanced ozone loss in the Chapman cycle (purple). In the middle stratosphere nonlinear interactions modify the NOx-catalysed O3 loss, while in the lower stratosphere the HOx and BrOx-catalysed O3 loss are affected. In contrast to the nonlinear effect on the ClOx and Chapman cycles in the upper stratosphere, which varies only quantitatively but not qualitatively 10
with latitude, the sign of the nonlinear ozone change due to the NOx cycle depends on the geographical region. In the NH the nonlinear ozone change related to the NOx cycle is relatively small and not statistically significant. In the SH, however, ozone is significantly decreased by up to 2 % in the upper stratosphere at midlatitudes (Fig. 3d) and increased in the middle stratosphere in the polar region due to a nonlinearly 15
modified NOx-catalysed ozone loss (not shown). This causes the hemispheric asym-metries in the nonlinear ozone change attributed to chemical loss in Fig. 2b. In the lower stratosphere the nonlinear ozone change due to HOx is positive at all latitudes, but statistically significant increases occur only at high latitudes. In the annual mean the total nonlinear decrease of the chemical O3loss in the Antarctic lower stratosphere 20
is caused by a reduced HOx-, ClOx- and BrOx-catalysed O3loss (Fig. 3d).
Which nonlinear processes are affecting the ozone loss cycles? Since the loss rate of a specific reaction is determined by the (temperature dependant) rate coefficient and the concentration of the involved species, nonlinear effects can occur either be-cause of nonlinear temperature changes or/and nonlinear changes of the radical and 25
ACPD
15, 9253–9291, 2015Nonlinear ozone response
S. Meul et al.
Title Page
Abstract Introduction
Conclusions References
Tables Figures
◭ ◮
◭ ◮
Back Close
Full Screen / Esc
Printer-friendly Version Interactive Discussion
Discussion
P
a
per
|
Discussion
P
a
per
|
Discussion
P
a
per
|
Discussion
P
a
per
|
the changes due to ODSs (≈+350 %) and GHGs (≈ −10 %) add up to≈+340 % (not
shown). This is explained by a nonlinear effect on the partitioning of inorganic chlorine, consistent with the study by Nevison et al. (1999). From 1960 to 2000 the ratio between reactive (ClOx) and inorganic chlorine is reduced more than expected from the single forcings. This is caused by the interaction between the chlorine species and the GHGs 5
CH4and N2O. While CO2is chemically quasi inert in the atmosphere and primarily in-fluences the radiative budget of the system, CH4and NO2, a product species from N2O, can react with chlorine compounds and form HCl and ClONO2, respectively, which are the most abundant chlorine reservoir species in the stratosphere. Thus, the formation of chlorine reservoir species is enhanced if the GHG concentrations are increased si-10
multaneously with the chlorine loading. This is also valid for the BrOx-catalysed O3 loss in the lower stratosphere through the formation of BrONO2. In addition, nonlin-ear processes lead to a reduced abundance not only of chlorine radicals, but also of the total amount of inorganic chlorine in the stratosphere (not shown). This is related to a reduced conversion of the chlorine source gases to inorganic compounds in the 15
tropical stratosphere. Here, the reduced shortwave radiation reaching the lower strato-sphere due to the O3 increase above lowers the photolysis rate of organic chlorine. Furthermore, circulation changes can play a role for the chlorine release as discussed in Waugh et al. (2007).
The positive nonlinear effect on ozone shown here is contrary to the findings in Haigh 20
and Pyle (1982), who found a larger ozone decrease for the combined change of ODSs and CO2. The main difference to the study by Haigh and Pyle (1982) is that not only CO2concentrations are increased, but also the CH4and N2O abundances. This means that the nonlinear effect due to a reduced temperature sensitivity of ozone is smaller than the nonlinearity that originates from changing atmospheric abundances of CH4 25
and N2O and their interactions with chlorine species.
ACPD
15, 9253–9291, 2015Nonlinear ozone response
S. Meul et al.
Title Page
Abstract Introduction
Conclusions References
Tables Figures
◭ ◮
◭ ◮
Back Close
Full Screen / Esc
Printer-friendly Version Interactive Discussion
Discussion
P
a
per
|
Discussion
P
a
per
|
Discussion
P
a
per
|
Discussion
P
a
per
|
between 1960 and 2000 (Fig. 5) is positive and statistically significant in the tropical upper stratosphere and lower stratosphere at SH midlatitudes. Thus, the stratospheric cooling in the tropical upper stratosphere is weaker by up to 0.4 K if ODSs and GHGs are changed simultaneously, with the consequence that the ozone loss via the Chap-man cycle is slightly increased. The temperature change pattern is linked to the non-5
linear ozone increase due to the ClOx cycle and the concomitant increase in ozone heating rates, but it is modulated by dynamical processes, especially in the polar re-gions. The warming in the SH polar upper stratosphere is related to a dynamically induced adiabatic descent that is probably caused by the cooling in the lower strato-sphere. The cooling can partly be explained by a reduced downwelling (see Sect. 3.2.2 10
and Fig. 8d).
The hemispheric asymmetry in the nonlinear ozone change in the lower and middle stratosphere is attributed to a larger nonlinear effect on the NOx loss cycle in the SH that leads to a compensation of the ClOx induced ozone increase at SH midlatitudes and to a larger nonlinear ozone increase in the polar region. This is mainly caused by 15
processes in the SH spring season and will be discussed in Sect. 3.2.2.
The significant nonlinear annual mean ozone increase due to chemical loss in the lowermost stratosphere at SH high latitudes (Fig. 2b) is mainly caused by a reduced efficiency of HOx-catalysed O3 loss (see Fig. 3d for 60◦S). At this altitude, the HOx cycle is primarily determined by the reaction of OH with O3. Although the absolute 20
abundance of HOx is increased due to nonlinear processes, the partitioning between OH and HO2 is shifted in favour of HO2 in this region (not shown). Thus, the loss efficiency is reduced.
In addition to chemical ozone loss, chemical ozone production contributes to the nonlinear ozone signal. Figure 2c shows that ozone production is reduced if interactions 25
ACPD
15, 9253–9291, 2015Nonlinear ozone response
S. Meul et al.
Title Page
Abstract Introduction
Conclusions References
Tables Figures
◭ ◮
◭ ◮
Back Close
Full Screen / Esc
Printer-friendly Version Interactive Discussion
Discussion
P
a
per
|
Discussion
P
a
per
|
Discussion
P
a
per
|
Discussion
P
a
per
|
NH upper troposphere, however, is found to be due to increased production via the reaction path HO2+NO (not shown).
The processes that are responsible for the nonlinear change in the ozone transport are analysed in more detail from the seasonal point of view in the next section. To investigate the seasonality of the nonlinear ozone changes, the attribution method is 5
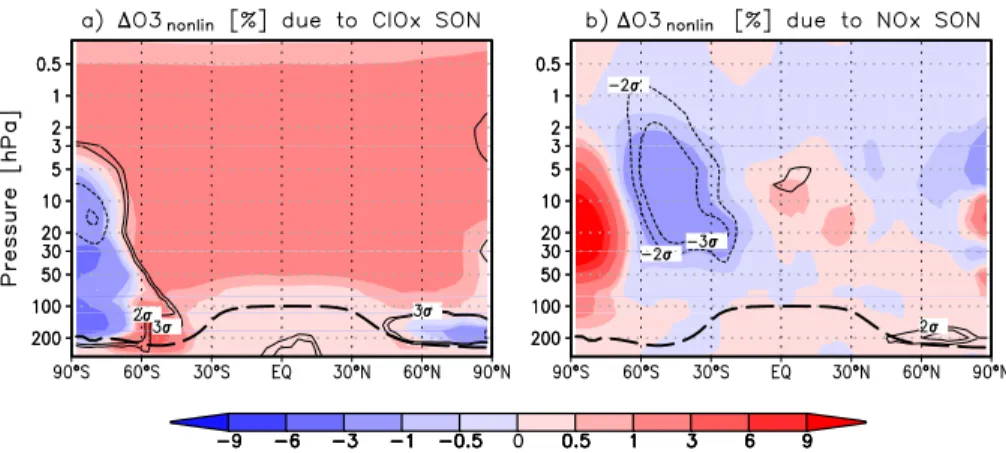
applied to seasonal means as discussed in Sect. 2. The largest nonlinear contributions are found in the September to November (SON) season. Therefore we focus on the SON mean in the following analyses.
3.2.2 Southern Hemisphere Spring (SON)
Figure 6 shows the nonlinear ozone change between 1960 and 2000 for the SH spring 10
season (SON) and the attributions to chemical ozone loss, production and transport analogous to Fig. 2. Figure 6a shows that the nonlinear ozone increase in the extrapolar upper stratosphere that was found for the annual mean is a robust signal in austral spring (and in fact all seasons, not shown). In the lower stratosphere, however, the nonlinear ozone change in the SON mean exhibits a clear dipole pattern in the SH, with 15
a positive signal at midlatitudes and a negative signal in the polar region. Furthermore, a statistically significant ozone increase due to nonlinear interactions is found in the NH polar lower stratosphere.
The nonlinear ozone changes due to loss in the SON mean (Fig. 6b) are qualita-tively similar to the annual mean, but in the SH polar region the changes are more 20
pronounced. The nonlinear contribution is positive in the upper and lower extra-polar stratosphere, as in the annual mean, but an ozone decrease is attributed to nonlinear processes at SH midlatitudes in the middle stratosphere and in the polar region in the upper stratosphere and lower mesosphere. This decrease is caused by significantly enhanced ozone loss through the NOx cycle – by more than 2 % (Fig. 7b) – which 25
ACPD
15, 9253–9291, 2015Nonlinear ozone response
S. Meul et al.
Title Page
Abstract Introduction
Conclusions References
Tables Figures
◭ ◮
◭ ◮
Back Close
Full Screen / Esc
Printer-friendly Version Interactive Discussion
Discussion
P
a
per
|
Discussion
P
a
per
|
Discussion
P
a
per
|
Discussion
P
a
per
|
the NH, no comparable nonlinear change pattern is found in the spring season (March to May; not shown).
The nonlinearity in NOx-catalysed O3loss originates from a nonlinear change of the NOxmixing ratios in the atmosphere: it is positive at SH midlatitudes and negative in the polar region (Fig. 4b). To understand this nonlinear behavior, we first explain the effect 5
of the single forcings, since the NOxmixing ratios are affected by both increasing GHGs and ODSs. Increasing halogen loading leads to a reduction of stratospheric NOxabove the 50 hPa level by increasing the photolysis rate of N2O and hence reducing the NOx production, and by increasing the formation of reservoir species (not shown). In con-trast, increasing GHG concentrations cause a significantly larger abundance of nitro-10
gen radicals in the extrapolar stratosphere (not shown) which is linked to increased N2O input into the stratosphere. In the upper stratosphere and mesosphere GHG induced stratospheric cooling increases the NOy loss reaction rate (Rosenfield and Douglass, 1998) and therefore causes a NOxdecrease. The combined NOxchange is dominated by the positive GHG effect in the tropical middle stratosphere and by the negative ODS 15
effect in the polar regions and lower stratosphere. In the upper stratosphere and lower mesosphere the total NOx change between 1960 and 2000 is negative.
This means that in the SH, the combined change of ODSs and GHGs leads to a larger NOx decrease in the polar region than expected from the sum of the single forcings (shown in Fig. 4b). At midlatitudes, the NOx decrease is mitigated by nonlin-20
ear processes. Since this pattern dominates also the annual mean change (not shown), seasonally asymmetric processes must be involved. In the lower stratosphere the distri-bution of NOxis determined by the release from reservoir species which are produced from N2O and transported via the residual circulation. Thus, nonlinear NOx changes in the lower stratosphere can be caused by changes in the NOyproduction, in the cir-25
ACPD
15, 9253–9291, 2015Nonlinear ozone response
S. Meul et al.
Title Page
Abstract Introduction
Conclusions References
Tables Figures
◭ ◮
◭ ◮
Back Close
Full Screen / Esc
Printer-friendly Version Interactive Discussion
Discussion
P
a
per
|
Discussion
P
a
per
|
Discussion
P
a
per
|
Discussion
P
a
per
|
air masses that are transported downward from the mesosphere are characterized by lower NOx values.
In the lower stratosphere we find qualitatively the same nonlinear change pattern for NOy as for NOx, with only slightly masked absolute values due to a modified partition-ing of radicals and reservoir species. Since the release from N2O shows no significant 5
nonlinear change in the tropics (not shown), a possible explanation for the nonlinear NOychange is an effect of transport. In the upper stratosphere the larger ozone abun-dance due to nonlinear processes can reduce the photolysis of NO which reduces the efficiency of the NOxloss reaction (Rosenfield and Douglass, 1998). Furthermore, the reduced cooling in the tropical upper stratosphere (Fig. 5) tends to decrease the loss. 10
This leads to an increase of NOx. However, the dipole pattern cannot be explained by these processes. Therefore, transport changes must be involved. The circulation changes due to nonlinear processes are discussed later in more detail.
The significant ozone decrease attributed to chemical loss in the SH polar upper stratosphere in the SON mean (Fig. 6b) is caused by increased O3loss in the Chapman 15
and the HOxcycle, which together exceed the effect of the ClOxdecrease (not shown). The enhanced O3loss in the Chapman cycle is explained by nonlinear warming (see Fig. 5 since the SON nonlinear temperature change is comparable to the annual mean), while the increased O3loss due to HOx is related to a nonlinear increase of the HOx mixing ratio in the upper stratosphere (not shown).
20
While the ClOx-catalysed O3 loss is significantly reduced at all latitudes and all seasons in the upper stratosphere due to nonlinear processes, a significant nonlin-ear ozone decrease occurs in the SH polar region between 20 and 5 hPa in the SON mean (Fig. 7a). This is not explained by a nonlinear change of the ClOx mixing ratio, but is probably related to the reduced ozone loss in the NOx cycle that leads to more 25
Ox available for the catalytic ClOx cycle. However, the overall nonlinear ozone change attributed to loss in this region is dominated by the ozone increase due to NOx.
ACPD
15, 9253–9291, 2015Nonlinear ozone response
S. Meul et al.
Title Page
Abstract Introduction
Conclusions References
Tables Figures
◭ ◮
◭ ◮
Back Close
Full Screen / Esc
Printer-friendly Version Interactive Discussion
Discussion
P
a
per
|
Discussion
P
a
per
|
Discussion
P
a
per
|
Discussion
P
a
per
|
the annual mean. The contribution to the nonlinear ozone change, however, remains negative.
All in all, we find that ozone chemistry is affected by nonlinear changes, but it can-not fully explain the nonlinear ozone changes, in particular the ozone decrease in the Antarctic lower stratosphere in spring. Figure 6d shows the nonlinear ozone change 5
due to ozone transport in the Antarctic spring season. The pattern is qualitatively sim-ilar to that for the annual mean (Fig. 2d) which indicates that the effect of nonlinear interactions on ozone transport is largest in the SH spring season. We find a strong dipole signal in each hemisphere: in the SH a significant decrease in ozone due to transport in the polar stratosphere and an increase in the tropics and midlatitudes, and 10
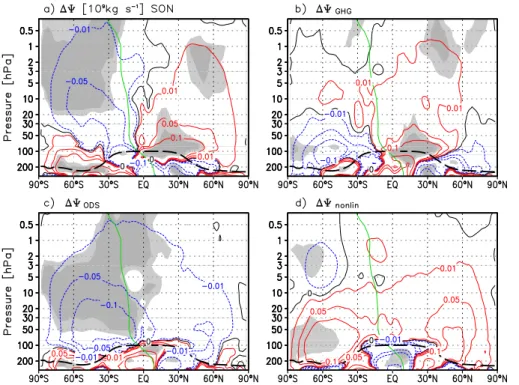
vice versa in the NH. Hence, the nonlinear ozone change pattern in the SH is primarily determined by the nonlinear changes in the ozone transport.
To understand why this dynamically driven nonlinearity is generated, we analyse the changes in the residual mean mass streamfunction (Ψ). Figure 8a shows the change in the mass streamfunction between 1960 and 2000 for the SON mean. The contri-15
butions from GHGs, ODSs and the nonlinear term are illustrated in the panels 8b–d, respectively. The absolute field of the streamfunction is positive for clockwise transport from the equator to north pole. The zero-Ψ-line of the 1960 reference simulation is shown in green.
The residual mean circulation is strengthened throughout the stratosphere in the 20
NH between 1960 and 2000 in the SON mean. In the SH the circulation is enhanced in the upper stratosphere and weakened in the lower stratosphere. This is consistent with the results by Li et al. (2008) who analysed simulations with a CCM and reported a weakening of the downward motion in the Antarctic lower stratosphere in SON for the 1960 to 2004 period and an enhancement of the downwelling in the upper stratosphere. 25
ACPD
15, 9253–9291, 2015Nonlinear ozone response
S. Meul et al.
Title Page
Abstract Introduction
Conclusions References
Tables Figures
◭ ◮
◭ ◮
Back Close
Full Screen / Esc
Printer-friendly Version Interactive Discussion
Discussion
P
a
per
|
Discussion
P
a
per
|
Discussion
P
a
per
|
Discussion
P
a
per
|
result shows that in constrast to the findings by McLandress et al. (2010), we detect a small, but significant nonlinear response in our timeslice simulations.
Due to increasing GHG concentrations, the residual circulation is enhanced in the NH upper stratosphere and in the lower stratosphere at low latitudes, as well as in the SH lower stratosphere (Fig. 8b). A reduced wave dissipation in the upper tropo-5
sphere (seen in the reduced Eliassen–Palm flux (EPF) convergence; Fig. S1b in the Supplement) leads to enhanced wave propagation into the lower stratosphere at mid-latitudes in both hemispheres. In the SH the wave dissipation is enhanced between 100 and 10 hPa leading to a strengthening of the circulation, particularly in the lower stratosphere, but for the NH midlatitudes, the atmospheric structure favours wave prop-10
agation (indicated by the change in the refractive properties; see Fig. S2b) into the up-per stratosphere, where the waves dissipate and drive the change of the mean mass streamfunction in the upper part (Fig. 8b and Fig. S1b).
In contrast, ODS increase leads to an enhancement of the mass transport in the SH and a reduction in the NH (Fig. 8c), which is also reported by Rind et al. (2009). In 15
the SH the source region of wave energy (EPF divergence) in the UTLS between 30 and 60◦S is shifted poleward and intensified (see Fig. S1c). This is probably related to
a slight poleward shift of the SH subtropical jet, which is caused by the cooling trend in the Antarctic lower stratosphere and an increase of the latitudinal temperature gradient. The shift of the SH subtropical jet is a known feature in summer months (e.g. Wilcox 20
et al., 2012), but it already starts to develop in SON in the timeslice simulations. In addition, wave dissipation is reduced in the lower stratosphere at midlatitudes, i.e. the atmosphere is more permeable, which leads to increased EPF convergence in the mid-dle and upper SH stratosphere (Figs. S2c and S1c, respectively) and to a strengthening of the SH residual circulation (Fig. 8c). The improved conditions for wave propagation 25
ACPD
15, 9253–9291, 2015Nonlinear ozone response
S. Meul et al.
Title Page
Abstract Introduction
Conclusions References
Tables Figures
◭ ◮
◭ ◮
Back Close
Full Screen / Esc
Printer-friendly Version Interactive Discussion
Discussion
P
a
per
|
Discussion
P
a
per
|
Discussion
P
a
per
|
Discussion
P
a
per
|
Finally, nonlinear changes occur, for example, if changes in the atmospheric con-ditions due to ODSs favour or mitigate the propagation of waves, which in turn are caused by increasing GHGs. In our simulations we find that the strenghening of the residual circulation in the SH lower stratosphere, which arises from both GHG and ODS changes, is weaker for the combined forcing (Fig. 8d). Here, different processes 5
play a role. On the one hand, the wave activity from below is decreased due to less reduced (=increased) wave dissipation in the troposphere. This is linked to a weaker increase of the zonal wind around 60◦S (Figs. S1 and S3), which is associated with a weaker meridional temperature gradient in the UTLS and a reduced poleward shift of the SH subtropical jet (compared to the sum of the single forcings). This shift also 10
induces a weakening of the EPF divergence in the lowermost stratosphere (Figs. S1d and S3d). On the other hand, the middle stratosphere is more permeable for waves (Figs. S1d and S2d), which is related to the greater persistence of the polar vortex in SH spring for the combined forcings compared to the sum of the single forcings (not shown), meaning a longer period of westerly winds in spring (Fig. S3d). Thus, while 15
wave dissipation is reduced in the middle stratosphere, it is enhanced in the upper stratosphere, driving the positive circulation change there (Fig. 8d).
In the NH the weakening of the residual circulation which is caused by ODSs and, in the polar lower stratosphere, by GHGs, is compensated by nonlinear interactions. The wave dissipation in the troposphere is decreased at midlatitudes allowing more 20
waves to propagate into the stratosphere. As a consequence the wave dissipation in the middle and upper stratosphere is increased, driving the positive change of the residual circulation (Fig. 8 and Fig. S1d).
This nonlinear behavior of the mass streamfunction is consistent with the changes of the ozone transport, since reduced transport from the tropics to the polar regions 25
ACPD
15, 9253–9291, 2015Nonlinear ozone response
S. Meul et al.
Title Page
Abstract Introduction
Conclusions References
Tables Figures
◭ ◮
◭ ◮
Back Close
Full Screen / Esc
Printer-friendly Version Interactive Discussion
Discussion
P
a
per
|
Discussion
P
a
per
|
Discussion
P
a
per
|
Discussion
P
a
per
|
NOx change pattern in the lower stratosphere (Fig. 4b). A slower mass transport from the tropics to the mid- and high latitudes goes along with a longer transport time, which means that more time is available for the chemical conversion of N2O. The reduced NOxvalues south of 70◦S are probably linked to the transport barrier at the edge of the polar vortex, which is more persistent if ODSs and GHGs are increased simultaneously 5
(not shown). In the upper stratosphere, the increased downward motion transports air with low NOxto the polar region and explains the NOxdecrease.
4 Conclusions
In this study we have performed an attribution of ozone changes between 1960 and 2000 to increasing GHGs and ODSs, explicitly accounting for nonlinearities. A set of 10
idealized simulations with the CCM EMAC allows us to detect nonlinear contributions to changes and to analyse the underlying processes. In contrast to attribution stud-ies using the stratospheric halogen loading as explanatory variable, this method in-cludes all preceding processes like transport and chemical conversion of the halogen source gases. GHG induced changes in the processing of ODSs and the resulting 15
ozone changes are therefore not attributed to ODS changes, but to the nonlinear inter-action term. Furthermore, by attributing the ozone changes to increasing mixing ratios of well-mixed GHGs, both temperature and chemical modifications are considered, as opposed to only temperature or CO2 changes. Thus, ODS induced changes in the abundance of HOx and NOxand the resulting ozone changes are attributed to nonlin-20
ear processes.
We identified a positive nonlinear contribution to the annual mean global mean ozone change throughout the stratosphere. The largest nonlinear change of 1.2 % occurs in the upper stratosphere, where it is half as large as the GHG induced ozone change. This signal is robust in the extra-polar region in all seasons. The main processes 25
ACPD
15, 9253–9291, 2015Nonlinear ozone response
S. Meul et al.
Title Page
Abstract Introduction
Conclusions References
Tables Figures
◭ ◮
◭ ◮
Back Close
Full Screen / Esc
Printer-friendly Version Interactive Discussion
Discussion
P
a
per
|
Discussion
P
a
per
|
Discussion
P
a
per
|
Discussion
P
a
per
|
is mainly attributed to nonlinearities in chemical ozone loss. We showed that reduced ozone loss is mainly caused by nonlinear processes affecting the ClOxloss cycle. Inter-actions between the chlorine species and CH4or N2O products lead to an enhanced formation of chlorine reservoir species, which decrease chemical ozone loss and in-crease ozone abundance by up to 2.5 %. This is consistent with the results of Nevison 5
et al. (1999). The ClOx effect is counteracted by more effective ozone loss via the Chapman cycle, which means that the temperature induced decrease of the Chapman loss reaction rate is smaller if GHGs and ODSs are changed at the same time. This is consistent with the findings of Haigh and Pyle (1982), who showed that the sen-sitivity of ozone to temperature changes decreases with increasing chlorine loading. 10
In the middle stratosphere, nonlinear ozone change due to the NOx cycle is slightly positive at NH midlatitudes, but larger and negative at SH midlatitudes, which leads to hemispheric asymmetries in the nonlinear ozone loss signal.
Besides the significant nonlinear ozone change in the extra-tropical upper strato-sphere, a second region with significant nonlinear annual mean changes is identified 15
in the lower stratosphere SH midlatitudes. Here, reduced ClOx-catalysed ozone loss together with positive changes in ozone transport are found to be the main drivers of a nonlinear ozone increase. A nonlinear contribution is also found in ozone production, which is significantly reduced globally except for the lower polar stratosphere. The re-duced production is related to a rere-duced photolysis rate of molecular oxygen, which is 20
the concequence of the ozone increase above.
In the SH in spring (SON), a pronounced dipole pattern in the nonlinear ozone change is evident below 10 hPa, with ozone decrease in the polar region and increase at midlatitudes. This is mainly attributed to nonlinear processes affecting ozone trans-port, but also modulated by nonlinear changes in the ozone chemistry. Due to a non-25
ACPD
15, 9253–9291, 2015Nonlinear ozone response
S. Meul et al.
Title Page
Abstract Introduction
Conclusions References
Tables Figures
◭ ◮
◭ ◮
Back Close
Full Screen / Esc
Printer-friendly Version Interactive Discussion
Discussion
P
a
per
|
Discussion
P
a
per
|
Discussion
P
a
per
|
Discussion
P
a
per
|
a negative ozone change at midlatitudes. Here, the reduced ozone loss in the ClOx cycle balances the negative signal at midlatitudes and enhances the positive signal at high latitudes. In contrast, at SH midlatitudes the nonlinearily enhanced ozone loss in the NOx cycle exceeds the positive signal from the ClOx cycle in the middle strato-sphere. No enhancement of the heterogeneous ozone loss due to nonlinear processes 5
is detected in the ozone hole area in spring, but rather a (not significant) mitigation of the chemical ozone depletion.
The integrated effect of the nonlinear processes is evident in the change of the total ozone column. The ODS induced decrease is significantly mitigated in the extra-polar regions by up to 1.1 % in the annual mean.
10
All in all, we showed that in simulations with the CCM EMAC, simultaneously in-creased GHG and ODS concentrations leads to nonlinear interactions affecting both ozone chemistry and ozone transport between 1960 and 2000. The nonlinear effect on ozone is small compared to the ODS effect, but for the recent past it is about half as large as the GHG effect. It has to be noted that these results are based on a single 15
model study. Douglass et al. (2012) showed that differences in the balance of loss pro-cesses between different CCMs leads to different sensitivity of ozone to temperature and chlorine changes in the upper stratosphere. Analyses of the nonlinear processes with different models are thus needed to confirm the conclusions shown here.
For attribution studies with multiple linear regression analysis, however, one has to 20
be aware of the fact that the basis functions may already be modified by nonlinear interactions. Therefore some processes are not included in the attribution. The appear-ance of nonlinearities means that the effect of ODS emission changes is to a small percentage dependant on the prevailing GHG concentrations. Thus the future evolu-tion of stratospheric ozone due to the decline of ODSs will not simply be a reversal of 25
the past.
ACPD
15, 9253–9291, 2015Nonlinear ozone response
S. Meul et al.
Title Page
Abstract Introduction
Conclusions References
Tables Figures
◭ ◮
◭ ◮
Back Close
Full Screen / Esc
Printer-friendly Version Interactive Discussion
Discussion
P
a
per
|
Discussion
P
a
per
|
Discussion
P
a
per
|
Discussion
P
a
per
|
Acknowledgements. This work has been funded by the Deutsche Forschungsgemeinschaft (DFG) within the Research Unit SHARP (LA 1025/14-2 and LA 1025/13-2) and within the Project ISOLAA (LA 1025/19-1). We thank Blanca Ayarzagüena for many helpful discussions and Edwin Gerber for proofreading. Furthermore, we would like to thank the North-German Supercomputing Alliance (HLRN) for computing time and support.
5
References
Austin, J., Struthers, H., Scinocca, J., Plummer, D. A., Akiyoshi, H., Baumgaertner, A. J. G., Bekki, S., Bodeker, G. E., Braesicke, P., Brühl, C., Butchart, N., Chipperfield, M. P., Cugnet, D., Dameris, M., Dhomse, S., Frith, S., Garny, H., Gettelman, A., Hardiman, S. C., Joeckel, P., Kinnison, D., Kubin, A., Lamarque, J. F., Langematz, U., Mancini, E.,
Marc-10
hand, M., Michou, M., Morgenstern, O., Nakamura, T., Nielsen, J. E., Pitari, G., Pyle, J., Rozanov, E., Shepherd, T. G., Shibata, K., Smale, D., Teyssèdre, H., and Yamashita, Y.: Chemistry-climate model simulations of spring Antarctic ozone, J. Geophys. Res., 115, D00M11, doi:10.1029/2009JD013577, 2010. 9259
Butchart, N. and Scaife, A.: Removal of chlorofluorocarbons by increased mass exchange
be-15
tween the stratosphere and the troposphere in a changing climate, Nature, 410, 799–802, 2001. 9255
Cicerone, R. J., Walters, S., and Liu, S. C.: Nonlinear response of stratospheric ozone column to chlorine injections, J. Geophys. Res., 88, 3647–3661, doi:10.1029/JC088iC06p03647, 1983. 9256
20
Cook, P. A. and Roscoe, H. K.: Changes in reactive stratospheric gases due to a change in Brewer–Dobson circulation: results from a simple model, Atmos. Sci. Lett., 13, 49–54, doi:10.1002/asl.362, 2012. 9255
Douglass, A. R., Stolarski, R. S., Strahan, S. E., and Oman, L. D.: Understanding differences in upper stratospheric ozone response to changes in chlorine and temperature as computed
25
using CCMVal-2 models, J. Geophys. Res., 117, D16306, doi:10.1029/2012JD017483, 2012. 9276
Eyring, V., Cionni, I., Bodeker, G. E., Charlton-Perez, A. J., Kinnison, D. E., Scinocca, J. F., Waugh, D. W., Akiyoshi, H., Bekki, S., Chipperfield, M. P., Dameris, M., Dhomse, S., Frith, S. M., Garny, H., Gettelman, A., Kubin, A., Langematz, U., Mancini, E., Marchand, M.,
ACPD
15, 9253–9291, 2015Nonlinear ozone response
S. Meul et al.
Title Page
Abstract Introduction
Conclusions References
Tables Figures
◭ ◮
◭ ◮
Back Close
Full Screen / Esc
Printer-friendly Version Interactive Discussion
Discussion
P
a
per
|
Discussion
P
a
per
|
Discussion
P
a
per
|
Discussion
P
a
per
|
Nakamura, T., Oman, L. D., Pawson, S., Pitari, G., Plummer, D. A., Rozanov, E., Shep-herd, T. G., Shibata, K., Tian, W., Braesicke, P., Hardiman, S. C., Lamarque, J. F., Mor-genstern, O., Pyle, J. A., Smale, D., and Yamashita, Y.: Multi-model assessment of strato-spheric ozone return dates and ozone recovery in CCMVal-2 models, Atmos. Chem. Phys., 10, 9451–9472, doi:10.5194/acp-10-9451-2010, 2010. 9259
5
Fioletov, V. E., Bodeker, G. E., Miller, A. J., McPeters, R. D., and Stolarski, R.: Global and zonal total ozone variations estimated from ground-based and satellite measurements: 1964– 2000, J. Geophys. Res.-Atmos., 107, 4647, doi:10.1029/2001JD001350, 2002. 9255 Garny, H., Dameris, M., Randel, W., Bodeker, G. E., and Deckert, R.: Dynamically forced
increase of tropical upwelling in the lower stratosphere, J. Atmos. Sci., 68, 1214–1233,
10
doi:10.1175/2011JAS3701.1, 2011a. 9255
Garny, H., Grewe, V., Dameris, M., Bodeker, G. E., and Stenke, A.: Attribution of ozone changes to dynamical and chemical processes in CCMs and CTMs, Geosci. Model Dev., 4, 271–286, doi:10.5194/gmd-4-271-2011, 2011b. 9260
Haigh, J. D. and Pyle, J. A.: Ozone perturbation experiments in a two-dimensional circulation
15
model, Q. J. Roy. Meteor. Soc., 109, 551–574, doi:10.1002/qj.49710845705, 1982. 9256, 9257, 9259, 9266, 9275
IPCC (Intergovernmental Panel on Climate Change): Climate Change 1995: The Science of Climate Change, Contribution of Working Group I to the Second Assessment Report of the Intergovernmental Panel on Climate Change, edited by: Houghton, J. T., Meira Filho, L. G.,
20
Callander, B. A., Harris, N., Kattenberg, A., and Maskell, K., Cambridge University Press, Cambridge, UK and New York, USA, 1996. 9255
IPCC (Intergovernmental Panel on Climate Change): Climate Change 2001: The Scien-tific Basis, Contribution of Working Group I to the Third Assessment Report, edited by: Houghton, J. T., Ding, Y., Griggs, D. J., Noguer, M., van der Linden, P. J., Dai, X., Maskell, K.,
25
and Johnson, C. A., Cambridge University Press, Cambridge, UK and New York, NY, USA, 2001. 9259
Jöckel, P., Tost, H., Pozzer, A., Brühl, C., Buchholz, J., Ganzeveld, L., Hoor, P., Kerk-weg, A., Lawrence, M. G., Sander, R., Steil, B., Stiller, G., Tanarhte, M., Taraborrelli, D., van Aardenne, J., and Lelieveld, J.: The atmospheric chemistry general circulation model
30
ACPD
15, 9253–9291, 2015Nonlinear ozone response
S. Meul et al.
Title Page
Abstract Introduction
Conclusions References
Tables Figures
◭ ◮
◭ ◮
Back Close
Full Screen / Esc
Printer-friendly Version Interactive Discussion
Discussion
P
a
per
|
Discussion
P
a
per
|
Discussion
P
a
per
|
Discussion
P
a
per
|
Johnston, H. S. and Podolske, J.: Interpretations of stratospheric photochemistry, Rev. Geo-phys. Space Ge., 16, 491–519, 1978. 9256
Jonsson, A. I., de Grandpre, J., Fomichev, V. I., McConnell, J. C., and Beagley, S. R.: Dou-bled CO2-induced cooling in the middle atmosphere: photochemical analysis of the ozone radiative feedback, J. Geophys. Res., 109, D24103, doi:10.1029/2004JD005093, 2004. 9255
5
Jonsson, A. I., Fomichev, V. I., and Shepherd, T. G.: The effect of nonlinearity in CO2 heat-ing rates on the attribution of stratospheric ozone and temperature changes, Atmos. Chem. Phys., 9, 8447–8452, doi:10.5194/acp-9-8447-2009, 2009. 9256, 9261, 9262
Jungclaus, J. H., Botzet, M., Haak, H., Keenlyside, N., Luo, J. J., Latif, M., Marotzke, J., Mikola-jewicz, U., and Roeckner, E.: Ocean circulation and tropical variability in the coupled model
10
ECHAM5/MPI-OM, J. Climate, 19, 3952–3972, doi:10.1175/JCLI3827.1, 2006. 9259 LeTexier, H., Solomon, S., and Garcia, R. R.: The role of molecular hydrogen and methane
oxidation in the water vapour budget of the stratosphere, Q. J. Roy. Meteor. Soc., 114, 281– 295, 1988. 9255
Li, F., Austin, J., and Wilson, J.: The strength of the brewer-dobson circulation in
15
a changing climate: coupled chemistry–climate model simulations, J. Climate, 21, 40–57, doi:10.1175/2007JCLI1663.1, 2008. 9271
McLandress, C., Jonsson, A. I., Plummer, D. A., Reader, M. C., Scinocca, J. F., and Shepherd, T. G.: Separating the dynamical effects of climate change and ozone depletion, Part I: Southern Hemisphere stratosphere, J. Climate, 23, 5002–5020,
20
doi:10.1175/2010JCLI3586.1, 2010. 9256, 9257, 9272
Meul, S., Langematz, U., Oberländer, S., Garny, H., and Jöckel, P.: Chemical contribution to future tropical ozone change in the lower stratosphere, Atmos. Chem. Phys., 14, 2959–2971, doi:10.5194/acp-14-2959-2014, 2014. 9260, 9261
Molina, M. J. and Rowland, F. S.: Stratospheric sink for chlorofluoromethanes: chlorine
atomc-25
atalysed destruction of ozone, Nature, 249, 810–812, doi:10.1038/249810a0, 1974. 9255 Nevison, C. D., Solomon, S., and Gao, R. S.: Buffering interactions in the modeled response
of stratospheric O3to increased NOx and HOx, J. Geophys. Res.-Atmos., 104, 3741–3754, doi:10.1029/1998JD100018, 1999. 9256, 9257, 9260, 9266, 9275
Nissen, K. M., Matthes, K., Langematz, U., and Mayer, B.: Towards a better
representa-30
ACPD
15, 9253–9291, 2015Nonlinear ozone response
S. Meul et al.
Title Page
Abstract Introduction
Conclusions References
Tables Figures
◭ ◮
◭ ◮
Back Close
Full Screen / Esc
Printer-friendly Version Interactive Discussion
Discussion
P
a
per
|
Discussion
P
a
per
|
Discussion
P
a
per
|
Discussion
P
a
per
|
Oberländer, S., Langematz, U., and Meul, S.: Unravelling impact factors for future changes in the Brewer–Dobson circulation, J. Geophys. Res.-Atmos., 118, 10296–10312, doi:10.1002/jgrd.50775, 2013.
Oman, L. D., Waugh, D. W., Kawa, S. R., Stolarski, R. S., Douglass, A. R., and Newman, P. A.: Mechanisms and feedback causing changes in upper stratospheric ozone in the 21st century,
5
J. Geophys. Res., 115, D05303, doi:10.1029/2009JD012397, 2010. 9256, 9262
Portmann, R. W. and Solomon, S.: Indirect radiative forcing of the ozone layer during the 21st century, Geophys. Res. Lett., 34, L02813, doi:10.1029/2006GL028252, 2007. 9256
Revell, L. E., Bodeker, G. E., Smale, D., Lehmann, R., Huck, P. E., Williamson, B. E., Rozanov, E., and Struthers, H.: The effectiveness of N2O in depleting stratospheric ozone,
10
Geophys. Res. Lett., 39, L15806, doi:10.1029/2012GL052143, 2012. 9256
Rind, D., Jonas, J., Stammerjohn, S., and Lonergan, P.: The Antarctic ozone hole and the Northern Annular Mode: a stratospheric interhemispheric connection, Geophys. Res. Lett., 36, L09818, doi:10.1029/2009GL037866, 2009. 9272
Roeckner, E., Brokopf, R., Esch, M., Giorgetta, M., Hagemann, S., Kornblueh, L., Manzini, E.,
15
Schlese, U., and Schulzweida, U.: Sensitivity of simulated climate to horizontal and vertical resolution in the ECHAM5 Atmosphere Model, J. Climate, 19, 3771–3791, doi:10.1175/JCLI3824.1, 2006. 9258
Rosenfield, J. E and Douglass, A. R.: Doubled CO2 effects on NOy in a coupled 2D model, Geophys. Res. Lett., 25, 4381–4384, 1998. 9255, 9269, 9270
20
Rosenfield, J. E., Douglass, A. R., and Considine, D. B.: The impact of increasing car-bon dioxide on ozone recovery, J. Geophys. Res.-Atmos., 107, ACH 7-1–ACH 7-9, doi:10.1029/2001JD000824, 2002. 9255, 9262
Sander, R., Kerkweg, A., Jöckel, P., and Lelieveld, J.: Technical note: The new comprehensive atmospheric chemistry module MECCA, Atmos. Chem. Phys., 5, 445–450,
doi:10.5194/acp-25
5-445-2005, 2005. 9259
Shepherd, T. G. and Jonsson, A. I.: On the attribution of stratospheric ozone and tempera-ture changes to changes in ozone-depleting substances and well-mixed greenhouse gases, Atmos. Chem. Phys., 8, 1435–1444, doi:10.5194/acp-8-1435-2008, 2008. 9256
Shepherd, T. G. and McLandress, C.: A robust mechanism for strengthening of the Brewer–
30

![Figure 5. Same as Fig. 2a, but for the nonlinear annual mean temperature change [K] between 1960 and 2000](https://thumb-eu.123doks.com/thumbv2/123dok_br/18175817.330486/35.918.99.611.95.494/figure-fig-nonlinear-annual-mean-temperature-change-k.webp)