Adv. Sci. Res., 4, 43–46, 2010 www.adv-sci-res.net/4/43/2010/
©Author(s) 2010. This work is distributed under the Creative Commons Attribution 3.0 License.
Advances
in
Science & Research
Open Access Proceedings
9th
EMS
Ann
ual
Meeting
and
9th
European
Conf
erence
on
Applications
of
Meteorology
2009
Regional tendencies of extreme
wind characteristics in Hungary
K. Radics1,2, J. Bartholy2, and Cs. N. P´elin´e1,2
1
Geoinformation Service, Hungarian Defence Forces, Szilagyi E. fasor 7–9, 1024 Budapest, Hungary 2Department of Meteorology, E¨otv¨os Lor´and University, Pazmany s. 1/A, 1117 Budapest, Hungary
Received: 31 December 2009 – Revised: 30 March 2010 – Accepted: 7 April 2010 – Published: 26 April 2010
Abstract. Human activities have substantial effects on climate system and climate change will directly influ-ence the global economy and society in the near future. Since change in the long-term mean climatic conditions will have significant consequences, the most important effects of climate change may come from changes in the intensity and frequency of climatic extremes. It is therefore of great interest to document and evaluate the extremes of near-surface wind that could assist in estimating the regional effects of climate change.
Recently a research started on specifying the possible changes of wind characteristics over Hungary. The study is based on 33-year-long (1975–2007) wind (speed, direction, and gust) data sets of 36 Hungarian synoptic me-teorological stations. Spatial and temporal distributions of mean and extreme wind climate characteristics were estimated, wind extremes and trends were interpolated and mapped over the country. Finally, measured and reanalysis (ERA-40) wind data were compared over Hungary. This might be important in order to check the adaptability of climate simulation results in estimation of regional climate change effects besides the direct validitation of ERA-40 reanalysis data sets.
1 Introduction
Since environmental processes may be affected by global warming, changes of extreme climate events have been con-sidered a key issue nowadays. Usually it is impossible to connect directly specific weather events to global warming. Instead, global warming is expected to cause changes in the overall distribution and intensity of extreme events, such as changes in the frequency and intensity of heavy precipitation and wind storms.
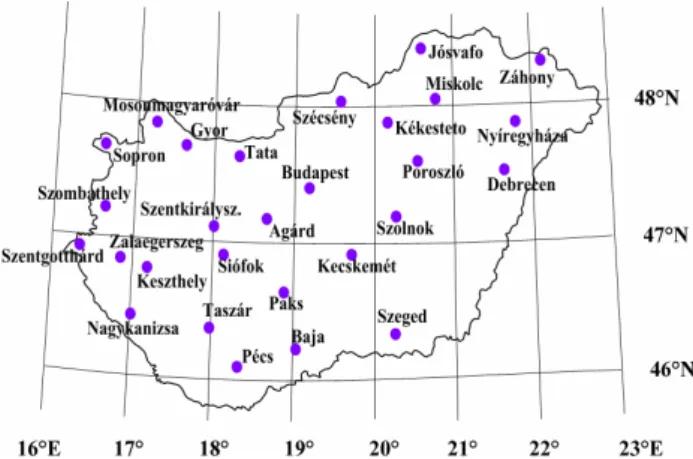
Hungary occupies the low elevated areas of the Carpathian basin. The country is predominantly flat, two-thirds of the entire territory lays below 200 m and approximately 2% is above 400 m. The latitudinal extension of Hungary (Fig. 1) – less than three degrees (45◦
45′
–48◦
35′
N) – is not responsi-ble for significant climatological differences between north-ern and southnorth-ern regions. The country had not been the sub-ject of extensive wind researches in the last century. How-ever, some studies were carried out analyzing the surface and
Correspondence to:K. Radics (kornelia.radics@mil.hu)
upper-air wind records spanning several decades (Tar et al., 2001). The presented study is a segment of complex wind cli-mate research of the country, which uses statistical methods to analyze the measured wind field of the Hungarian meteo-rological stations.
Most scientists agree that special attention should be paid applying ERA-40 reanalysis data sets as a reference, e.g. for such model development and validation purposes where wind plays an important role (Punge and Giorgetta, 2007). Considering the main achievements of studies dealt with statistics of differences between observations and hindcasts, furthermore, regarding the fact that no corrections were ap-plied prior to 1980 in ERA-40 data sets (Haimberger, 2005), spatially and temporally inhomogeneous measured wind speed data and reanalyzed data were compared for Hungary. In this study some preliminary results are presented demon-strating how the comparison of different datasets can improve the reliability of detected wind variability.
44 K. Radics et al.: Regional tendencies of extreme wind characteristics in Hungary
Figure 1. Geographical locations of meteorological stations
in-volved in the analysis.
2 Data sets
Wind data sets of 36 Hungarian synoptic meteorological sta-tions have been analyzed, which consists of hourly wind speed, wind direction and wind gust data for the period 1975–2007.
As an achievement of technical development, automated measurement systems were installed in Hungary during the 1990s. This implies changes not only in the measuring meth-ods and instruments, but in many cases in the location and height of observation. Furthermore, some new stations were installed, and as a consequence of urbanization, the closer and farther surroundings of measuring stations have been changed in the meantime. Due to these inhomogeneities uni-fied analysis of the whole time series is not feasible. There-fore, (1) only 28 stations are involved in this study (Fig. 1), (2) Hungarian wind climate conditions are analyzed for two different sets of the database: the first part (1975–1994) was recorded by Fuess wind instruments; the second part (1997– 2007) was measured by automated meteorological systems.
After processing the measured wind data sets (including digitisation of old instrumental records, quality control and homogenisation of measured data), time series and complex wind climate analysis were carried out.
The global multi-decadal data sets, generated by reanaly-sis of past observations, have become a bareanaly-sis of many types of atmospheric research. Reanalyses provide comprehensive information that can support a variety of applications. Thus, in the second part of the study ERA-40 reanalysis data sets from the European Centre for Medium-Range Weather Fore-casts (ECMWF) were analyzed. Average wind speed (u,v) components (at 10 m height) were used for the period 1975– 2002 with 6 h temporal resolution and 1◦
×1◦spatial
resolu-tion over the Carpathian Basin.
Figure 2. Relative frequencies of wind speed values greater than
5 m/s at 10 m height over Hungary.
3 Analyses and results
Analysing the second part (1997–2007) of measured wind data the following preliminary conclusions can be drawn (Bartholy et al., 2003; Radics and Bartholy, 2002, 2008):
– Mean wind speed is ranging between 1.47–3.84 m/s over Hungary. Therefore, the country can be considered moderately windy.
– The range of annual and daily variability of wind speed is 1–2 m/s.
– Duration of 1–3 m/s winds is the longest (1500– 3000 h/year). Annual average duration of the wind speeds greater than 10 m/s is very low, less than 100 h/year generally.
– The relative frequency of the dominant wind direction is low. The frequencies of calm periods in some regions are relatively high comparing that to the regional mean values.
– Mean wind speed and wind gust values show large spa-tial differences over the country. The windiest region is Northwestern Hungary, while the least windy is the northeastern part of the country.
– Absolute maxima values of average wind speed and wind gust are ranging between 15–40 m/s. The largest values occurred before 2000.
The spatial distribution of wind speeds greater than 5 m/s at 10 m height is illustrated in Fig. 2. In harmony with the preliminary expectations, the maximum of relative frequency values (21.6%) occurred in the centre of Transdanubia (west-ern part of Hungary bordered by the river Danube), while the minima (less than 4%) are found in the northeastern, south-ern and southwestsouth-ern regions of the country.
K. Radics et al.: Regional tendencies of extreme wind characteristics in Hungary 45
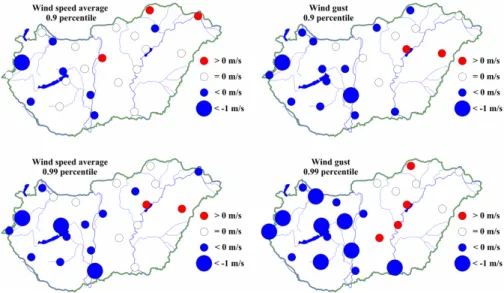
Figure 3.Spatial distribution of linear trend fitted on different percentile values (0.9 – up, 0.99 – down) calculated from three-year subseries
of wind speed (left) and wind gust (right) values, 1997–2007.
Spatial and temporal distributions of extreme wind con-ditions were estimated by calculating three-year moving averages of different percentile values (median, 0.9, 0.95, 0.99). During the period 1975–1994 the 0.9 percentiles of wind speed did not change generally, except two sta-tions (Keszthely and Paks) with slightly decreasing tendency. Concerning the 0.99 percentile, half of the stations shows negative tendency (mainly in Transdanubia), positive trend was found only in Zalaegerszeg. During the same time, dif-ferent percentile values of wind gust decreased in the west-ern part of the country and were constant at the eastwest-ern re-gions. Increasing tendencies were found only in two stations (Szeged and Ny´ıregyh´aza).
During the second period (1997–2007) the median of av-erage wind speed was constant over the entire territory of Hungary. In cases of 0.9 and 0.99 (Fig. 3, left), decreases were found mainly in Transdanubia, and increases appeared in some stations at the eastern part of the country. Investigat-ing temporal and spatial distributions of extreme wind gust values, the median was constant almost over the whole coun-try. As it is demonstrated in Fig. 3 (right), the increase of the applied percentile value caused significant increase in the area and intensity of negative tendencies. In contrast, con-stant or slightly increasing tendencies were found over the Great Hungarian Plain.
It has already accepted that expected regional climate change can influence the Hungarian wind climate, as well, as the frequency of extreme events. Thus, the comparison of different climate scenarios with statistics of present climate parameters provides the means for estimating the potential regional effects of climate change. Therefore, the spatially and temporally inhomogeneous measured wind data and the homogeneous ERA-40 reanalysis data sets were compared
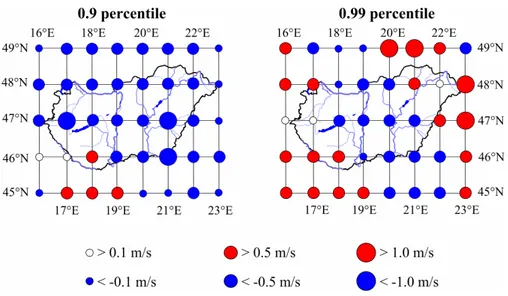
(1975–2002). During the period 1975–1980 ERA-40 con-siderably underestimates the measured data, especially, in cases of maxima (Radics et al., 2009). Between 1988–1994 ERA-40 underestimates measured data because of the lack of night-time observations. Taking the whole period (1975– 2002) into consideration, ERA-40 data significantly under-estimate the maxima of measured data until 1997, and after that year the large overestimation of minima is typical. The overall degree of underestimation has decreased since 1997. Concerning our further study of ERA-40, spatial distribu-tion of wind speed and wind gust extremes were analyzed (1997–2002) using three-year moving averages of different percentile values. On the left side of Fig. 4, where the spa-tial distribution of linear trend fitted on 0.9 percentile values is shown, decreasing tendencies were found generally. In-side the country only one grid point could be characterised by a slightly increasing trend. On the other hand, increas-ing tendencies appeared only in some cases on the right side of Fig. 4 (0.99 percentile). Greater than 1 m/s increase were found only outside the Hungarian border.
4 Conclusions
The main goal of the presented research is to specify the vari-ability of regional wind characteristics over Hungary. The study is based on 33-year-long (1975–2007) wind data sets of 36 Hungarian meteorological stations. Summarizing the main results, the following conclusions can be drawn.
– During the period 1975–2007 different percentile values of average wind speed and wind gust were analyzed. In cases of 0.9 and 0.99 percentiles significantly de-creasing tendencies were found mainly in Transdanubia,
46 K. Radics et al.: Regional tendencies of extreme wind characteristics in Hungary
Figure 4.Spatial distribution of linear trend fitted on different percentile values (0.9 – left, 0.99 – right) calculated from three-year subseries
of ERA-40 wind speed data, 1997–2002.
increasing trend appeared only in some stations at the eastern part of the country.
– The preliminary results show strong relationships be-tween the corresponding periods of ERA-40 and station data.
– Analysing ERA-40 percentile values, generally decreas-ing tendencies were found. Increasdecreas-ing tendencies ap-peared only in some cases. Greater than 1 m/s increase were found only outside the country.
– In order to estimate regional climate change effects, spa-tially and temporally homogeneous data series of ERA-40 seems to be an appropriate tool to substitute the mea-sured data over Hungary.
Acknowledgements. Authors are very grateful to the
Geoinfor-mation Service of Hungarian Defence Forces for the wind data bases of the Hungarian meteorological stations, to the Hungarian Meteorological Service for the ERA-40 data sets.
Research leading to this paper has been supported by the Hungar-ian Academy of Sciences under the program 2006/TKI/246 titled Adaptation to climate change, by the Hungarian National Science Research Foundation under grants T-049824, K-67626, K-69164 and K-78125, and by the Hungarian Ministry of Environment and Water.
Furthermore, the support of the J´anos Bolyai Research Scholarship of the Hungarian Academy of Sciences is appreciated.
Edited by: I. Auer
Reviewed by: K. Tar and two other anonymous referees
References
Bartholy, J., Radics, K., and Bohoczky, F.: Present state of wind en-ergy utilisation in Hungary: policy, wind climate, and modelling studies, Renew. Sust. Energ. Rev., 7, 175–186, 2003.
Haimberger, L.: Homogenization of the global radiosonde dataset using ERA-40 analysis feedback information, Reviews, 7, 175– 186, 2005.
Punge, H. J. and Giorgetta, M. A.: Differences between the QBO in the first and in the second half of the ERA-40 reanalysis, Atmos. Chem. Phys., 7, 599–608, 2007,
http://www.atmos-chem-phys.net/7/599/2007/.
Radics, K. and Bartholy, J.: Selected wind characteristics and po-tential use of wind energy in Hungary. Part II, Id¨oj´ar´as, 106, 59– 74, 2002.
Radics, K. and Bartholy, J.: Estimating and modelling the wind resource of Hungary, Renew. Sust. Energ. Rev., 12, 874–882, 2008.
Radics, K., P´elin´e, N. Cs., and Bartholy, J.: Regional tendencies of wind climate over Hungary, New Challenges in the Field of Military Sciences, Conference Proceedings, CD ROM, 2009. Tar, K., Makra, L., Horv´ath, Sz., and Kircsi, A.: Temporal change
of some statistical characteristics of wind speed over the Great Hungarian Plain, Theor. Appl. Clim., 69, 69–79, 2001.