Abstract— In order to optimize the drying process at low temperature, the influence of geometric factors and operating conditions on drying time of wet coarse particle of sludge in a conical spouted bed dryer has been analyzed by means of a factorial experimental design. The effect of the geometric factors and operating conditions on drying time has been determined by a statistical analysis. Operation regimes of beds consisting of wet coarse particles in a conical spouted bed dryer have been determined by pressure drop fluctuations at inlet gas temperatures from room temperature up to 120 ºC. Results of drying modelling for beds of coarse particle wastes at different regimes have been verified through some experimental drying time of sludge.
Index Terms—conical spouted beds, drying time, sludge drying, cycle times, experimental design
I. INTRODUCTION
HE spouted bed technology has demonstrated to have better benefits than fluidized beds. This technology in conical geometry of the contactor is very useful for applications where a vigorous movement of the solids is required, as happens in the handling of solids that are sticky, of irregular texture and with a wide particle size distribution [1-7]. Moreover, the conical spouted bed is successful for wastes treatment, especially biomass wastes, [3, 5-8] mainly because avoids the stickiness, particle segregation. The good performance for conventional applications (drying, granulation, and coating) and for those of a more recent nature is due to the cyclic movement of particles and to the versatility in the properties related to solid circulation (such as the time required by a particle to complete a cycle and the fractions of this time spent in the spout and the annular zones).
The spouted bed technology is successful for wastes treatment [3, 9-11]. In addition, this technology avoids the disadvantages of sludge treatment (stickiness, wide sizes
Manuscript received April 4, 2012. This work was supported Spanish Ministry of Science and Innovation (Project TRA2009-0318 and Project CTQ2010-18697) and of the Ministry of the Basque Country (Project SA-2010/00097).
M. J. San José is with the Departamento de Ingeniería Química, Universidad del País Vasco, Aptdo 644. 48080 Bilbao, Spain. (corresponding author to provide phone: 946015362; fax: 34-946013500; e-mail: [email protected]).
S. Alvarez is with the Universidad del País Vasco, (e-mail: [email protected]).
F. Javier Peñas is with the Universidad de Navarra, Campus Universitario, 31009 Pamplona, Spain ([email protected])
Iris García is with the Universidad del País Vasco ([email protected]).
distribution, etc), and allows for drying at low temperatures. Spouted bed contactors of geometry entirely conical perform well in a great variety of industrial applications over room temperature as drying [12], combustion [9-10] and pyrolysis [13-14]. Design of conical spouted beds for processing of beds of solid materials of uniformed size or mixtures of particle size distribution requires the identification of flow regimes as well as stability of spouting regimes.
In this paper, bed stability of uniformed beds consisting of wet coarse particles (glass beads and sludge) has been studied in conical spouted beds, based in a previous study with dry granular materials [15-16] and the ranges of the geometric factors of the conical contactor, and of the contactor-particle system for stable operating condition have been determined. Furthermore, the influence of geometric factors and operating conditions to optimize the drying process at low temperature, such as in beds consisting of thermal sensitive materials, has been analyzed by means of an experimental design [17].
II. EXPERIMENTAL
The experimental study has been carried out at in a unit designed at pilot plant scale, shown in Figure 1, which basically consists of two blowers that supplies a maximum flow rate of 500 Nm3h-1 at a pressure of 15 kPa; three rotameters, and two mass flow meters controlled by computer for flow rate measurement; [18] probes for the measurement of the static and dynamic pressure at different positions by a displacement device controlled by computer; an electric resistance for preheating the air; thermocouples for measuring the temperature at several positions in the contactor and two high efficiency cyclones in order to collect the ashes and fine particles.
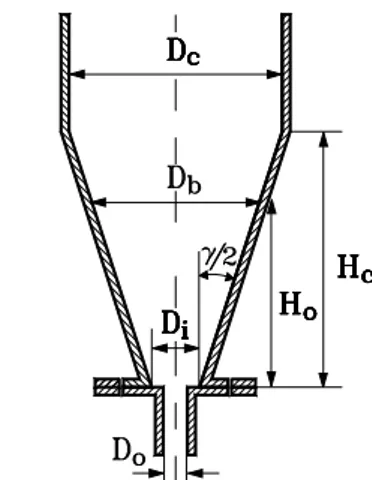
The dryer, Figure 2, is a conical spouted bed whose geometric factors are shown in Table I. The study has been carried out for different ratios of Do/dp and Do/Di at different operating conditions summarizes in Table 1. Drying has been has been carried out at inlet gas temperature from room temperature to 120 ºC.
Beds consist of wet coarse particles, sludge wastes and glass beads to approach particles drying in the performance of this novel dryer. Table II sums up the physical properties of the solid particles, which belong to Geldart D classification, and of the gas properties.
Modelling of Drying of Wet Coarse Particles of
Sludge in a Conical Spouted Bed Dryer
María J. San José*,Sonia Alvarez, F. Javier Peñas,Iris García
Bed pressure drop is calculated as the difference of the data measured by the pressure tap located before gas inlet to the contactor and by a pressure tap arranged at the outlet of the contactor. Measurements of bed pressure drop are sent to a differential pressure transducer (Siemens Teleperm), which quantifies these measurements within the 0-100% range [18]. The transducer sends the 4-20 mA signal to a data logger (Alhborn Almeno 2290-8), which is connected to a computer where the data are registered and processed by means of the software AMR-Control. The software AMR-Control also registers and processes the air velocity data, which allows for the acquisition of continuous curves of pressure drop against air velocity. The absolute error of the dynamic pressure is lower than 0.1 Pa and of the static pressure is below 1 Pa.
Qualitative identification of each regime has been determined based on visual observations through transparent wall of the contactor. Operating regimes have been determined quantitatively by analyzing the standard deviation of bed pressure fluctuation. This methodology is based on the analysis of the different tendencies of standard
deviation of bed pressure fluctuation with the flow regimes [19-20].
During the batch drying, air temperature and moisture have been measured and solid sampling has been carried out by means of a suction pump, with the time. Solid moisture has been measured by means of Mettler Toledo hygrometer and by AQUA-Boy KPM HM III hygrometer. Solid moisture results have been checked with those obtained by the oven drying method at 105 ºC up to constant weight.
With the aim of estimating the effect of geometric factors and operating conditions to optimize the drying process at low temperature, such in beds consisting of thermal sensitive material, a general approach has been obtained by a two-level factorial experimental design.
The variables which might have influence on drying time, based in previous experimental observations, have been varied at two levels by a 2k factorial experimental design. The 2k design is appropriated when several factors are of interest in an experiment [21]. These factors are: the ratio gas inlet diameter to dryer diameter, Do/Di, gas flow to minimum spouting gas flow ratio, Q/Qms, solid initial moisture content, X, and inlet gas temperature, T. The two levels of the factors studied are summarized in Table III.
The distribution of cycle times has been measured by monitoring a colored particle using an image treatment system composed of a camera, a video recorder, a monitor with tactile screen, and the computer support needed for treatment of the data obtained, Figure 3. The cycle time namely, the time spent by a particle in traveling the annulus and spout and returning to the fountain, has been determined by freezing the image where the particle is seen again in the fountain after one cycle.
The cycle time is calculated by counting the frames between two consecutive appearances of the particle in the fountain and taking into account that the time between two
Fig. 2. Geometric factors of the conical dryer.
TABLEIII DESIGN FACTORS AND LEVELS
No. Factor Level 1 Level 2
1 Do/Di(m) 0.5 1
2 Q/Qms (m3/h) Minimum
spouting 1
Moderately spouting
1.3
3 X (wt %) 1 2
4 T (ºC) 25 100
TABLEII
PHYSICAL PROPERTIES OF THE SOLID PARTICLES AND OF THE GAS Solid properties
Material s (kg/m3) dp (mm) o
Glass beads 2420 3.0 0.34
Sludge 1123 2.81 0.35
Gas properties T (ºC) g (kg/m3) (kg/ms)
Air 25 1.2 1.9 10-5
50 1.08 1.98 10-5
80 1.01 2.09 10-5
100 0.95 2.21 10-5
120 0.99 2.31 10-5
TABLEI
GEOMETRIC FACTORS OF THE DRYER AND OPERATING CONDITIONS
Parameter Symbol Value
Column diameter Dc (m) 0.36
Diameter of the contactor base Dc (m) 0.03
Angle of the dryer base (deg) 36
Gas inlet diameter Do (m) 0.015, 0.02, 0.03
Stagnant bed height Ho (m) between 0.03 and 0.25
frames is 1/25 s. The frequency of the cycles described by a colored particle has been determined in all of the experimental systems, by means of equipment for the acquisition and treatment of video images. The number of cycles considered in each system is always above 1000.
Average cycle time has been calculated from the distribution of cycle times by the following expression [20]:
n
1 i i i n
1 i i i i c
t f
t f t
t (1)
III. RESULTS
In order to identify the different regimes of beds of wet coarse particles at drying temperatures, a hydrodynamic study has been carried out at temperatures from room temperatures up to 120 ºC.
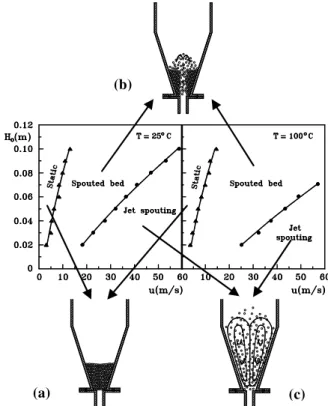
The operation map for a bed consisting of glass beads of particle diameter 3 mm with a moisture content of 2 wt % (dry basis) at inlet gas temperatures of 25 and of 100 ºC is shown in Figure 4 as an example, in plots of stagnant bed height, Ho, vs. air velocity, u together with an outline of the particles state in the dryer for the different regimes. The borders between the different regimes, drawn with solid lines, have been obtained experimentally (the points drawn are the experimental base for tracing these borders), by increasing gas velocity for each stagnant bed height.
The different spouting regimes of solid bed have been determined by the comparing the changing tendencies of standard deviation of pressure fluctuations with the flow regimes visually observed. Stable spouting regime, Figure 4 (b), is characterized by small bed pressure fluctuation of the standard deviation as air velocity decreases. Static bed, Figure 4 (a), is reached when standard deviation suddenly increases as gas velocity is decreased below minimum spouting velocity, and the fountain, characteristic of the spouted bed regime, onset. Instability situation, which is defined as standard deviation fluctuations of bed pressure drop higher than 100 Pa [20], is not reached in this experimental system.
As it is observed, after the fixed bed, increasing gas velocity, the stable regime of spouted bed is reached, the velocity corresponding to the beginning of the regime of spouted bed is the minimum spouting velocity. The
experimental value of this velocity is determined from the values of pressure drop by decreasing slowly the gas flow as the point when the pressure drop levels off [1, 23], and the fountain onset, because this velocity is more accurate and reproducible than the one obtained by increasing the gas flow. Increasing the velocity, both annular and spout zones characteristic of classical spouting become progressively confused (transition zone) and increasing gas velocity jet spouting regime (dilute spouted bed) [23] is reached. Once this regime is reached, it stays stable at higher gas velocities. The velocity corresponding to the beginning of the jet spouting (dilute spouted bed) regime is the minimum jet spouting velocity. As it is observed, system are stable at any stagnant bed height studied and as stagnant bed height is increased, minimum spouting velocity as well as minimum jet spouting (dilute spouted bed) velocity increase. In addition, the increasing in inlet gas temperature gives way to an increase in gas velocity.
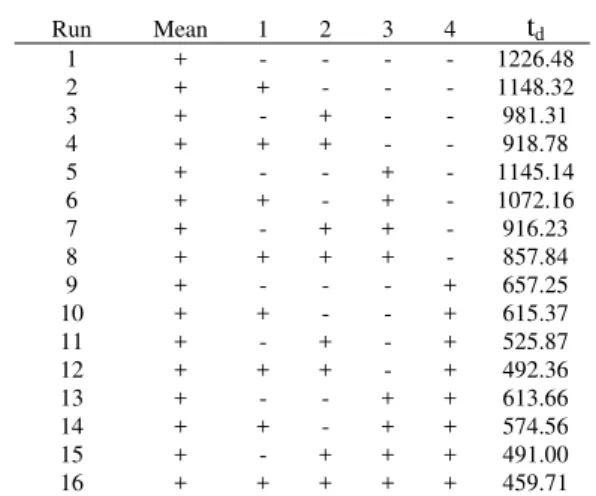
The experimental design proposed to optimize the drying of beds of wet coarse particle wastes at different regimes in a conical dryer, uses the possible combination of the two levels of the operating conditions to form a basic experiment with 16 different settings. Table IV presents the design matrix for the 16 experiments, where in each row the high and low level of each factor, denoted +1 and -1, respectively, and the results of the drying time obtained at each combination of experimental conditions are summarized. In Table IV, variables 1, 2, 3 and 4, represent the gas inlet diameter to dryer diameter, Do/Di ratio, initial solid moisture content, X, gas flow to minimum spouting gas flow ratio, Q/Qms and inlet gas temperature, T, respectively.
Fig. 3. Scheme of the image treatment system.
Fig. 4. Operating map (stagnant bed height, Ho, vs. air velocity, u) and
outline of the particles circulation at the different regimes in a conical spouted bed dryer: (a) static bed, (b) spouted bed regime, (c) jet spouted bed (dilute spouted bed). Bed consisting of wet glass beads of particle diameter of 3 mm at inlet gas temperatures of 25 and 100 ºC.
(a)
(b)
This experimental design is solved by using Box´s algorithm [24]. The number of effects and interactions of a factorial design is calculated by eq. 2 and for a factorial design 24 there are four main effects, six two-variable interactions, four three-variable interactions and one four-variable interactions. )! i k ( ! i ! k ni
(2)
The main effects and interactions, shown in Table V are calculated by multiplying the drying time in the last column of Table IV by the signs in the corresponding main effect or interaction column, by adding the result to produce a contrast, and then by dividing the contrast by one-half the total number of runs in the experiment [21]. The effect estimates are computed from:
1 k N
1
i d( ) d( )
2 t t Effect
(3)
The normal probability scale is an appropriate method for estimating the importance of effects and interactions [21]. The normal probability plot of the 16 ordered effects (main effects and interactions) is shown in Figure 5. As it is
observed,, the most of the effects are negligible because are normally distributed with mean equal to zero and lie close to a straight line confirming that are explained by random noise [36]. Nevertheless, the main effects 2 and 4 and the three variable interaction are significant because have non-zero means and do not fit the straight line.
Normal plotting of the residuals provides a diagnostic check for any tentatively entertained model. The regression model used to obtain the predicted values is:
3 2 1 4 3 2 1 x x x 21 . 153 x 98 . 239 x 21 . 27 x 11 . 88 x 11 . 26 5 . 93 7 d
tˆ
(4)
where x1, x2, x3, x4 represent 1, 2, 3 and 4 factors, respectively and x1x2x3 represent 123 interaction. x1, x2, x3, and x4 take the value -1 or +1 according to the columns of signs in Table IV.
The residuals for the 16 runs at that design point are summarized in Table VI. The normal probability of the residuals indicates that except for 1, 2, 3 and 4 factors are explained by random noise.
From the effects of the factors, the significance order of the factors is analyzed and it is observed that the factor of greatest influence on drying time is inlet gas temperature and as its effect is negative means that as inlet gas temperature is increased drying time decreases. The following factor is gas flow. As the effect of gas flow tube is negative, an increasing in gas flow minimizes drying time. Moreover, the ratio of the gas inlet diameter to inlet diameter of the dryer has a slight influence on drying time.
The regression model of drying time for beds consisting of coarse particle wastes at different regimes has been verified through some experimental drying time of beds of glass beads.
1 10 100
-500 -400 -300 -200 -100 0 100 200 300
Effect
P (
%
)
Fig. 5. Normal probability of the effects.
TABLEV
MAIN EFFECTS OF VARIABLES AND INTERACTIONS ON DRYING TIME
Effects Values
Main 1 -52.23
2 -176.23
3 -54.43
4 -479.56
Two-variable interactions 12 5.80
13 1.79
14 15.78
23 6.04
24 53.25
34 16.45
Three-variable interactions 123 306.42
124 -1.75
134 -0.54
234 -1.83
Four-variable interactions 1234 18.30 TABLEIV
DESIGN MATRIX AND EXPERIMENTAL RESULTS OF DRYING TIME
Run Mean 1 2 3 4 td
1 + - - - - 1226.48
2 + + - - - 1148.32
3 + - + - - 981.31
4 + + + - - 918.78
5 + - - + - 1145.14
6 + + - + - 1072.16
7 + - + + - 916.23
8 + + + + - 857.84
9 + - - - + 657.25
10 + + - - + 615.37
11 + - + - + 525.87
12 + + + - + 492.36
13 + - - + + 613.66
14 + + - + + 574.56
15 + - + + + 491.00
16 + + + + + 459.71
4
123
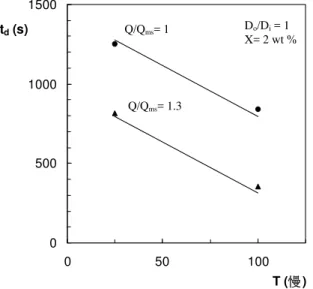
The good agreement of the experimental values of drying time is shown in Figure 6 as an example. In this Figure, the experimental values of drying time of beds consisting of wet coarse particles (points) and calculated ones (lines) have been plotted against the inlet gas temperature for two different values of gas flow to minimum spouting gas flow ratio (at the minimum spouting and at a moderately spouting 30% higher than the minimum spouting), as they are the factors of major influence on drying time. As it is observed, drying time is shorter for greater values of gas flow to minimum spouting gas flow ratio and drying time decreases as inlet gas temperature is increased from 25 to 100 ºC.
Finally, the validation of the drying model has been analyzed by experimental measurements in the different regimes and related with experimental results of cycle times in each regime to improve drying process.
IV. CONCLUSION
Operation regimes of beds consisting of wet glass beads and of wet sludge at inlet gas temperatures of 25 and 100 ºC
have been determined quantitatively by the changes of the standard deviation of pressure fluctuations signals in each regime. Minimum spouting velocity and jet spouting (dilute spouted bed) velocity increase with stagnant bed height and with inlet gas temperature.
Parameters of a novel conical spouted bed of major influence on drying process time are obtained by varying the levels of the influence factors using a two-level factorial experimental design.
The factor of major influence on drying time is inlet gas temperature followed by gas flow to minimum spouting gas flow ratio and initial solid moisture content. An increase in inlet gas temperature, in gas flow to minimum spouting gas flow ratio and a decrease in initial solid moisture content give way to a decrease in drying time. Influence of gas inlet diameter to diameter of the dryer ratio is not as noticeable, and it is explained by random noise.
Analysis modelling results are verified, by using this experimental design, through some experimental drying times for different regimes (static, spouted bed and jet spouted bed), corresponding to different cycle times, at different inlet gas temperature from room temperature to 120 ºC, and values of parameters for optimum drying time are obtained.
ACKNOWLEDGMENT
This work was carried out with the financial support of the Spanish Ministry of Science and Innovation (Project TRA2009-0318 and Project CTQ2010-18697) and of the Ministry of the Basque Country (Project SA-2010/00097).
NOMENCLATURE
Db, Dc, Di, Do diameter of the top diameter of the stagnant bed, of the column, of the dryer bottom, and of the bed inlet, respectively, m
dp particle diameter, m
Ho height of the stagnant bed, m
T temperature, ºC
c
t , tc, ti average cycle time and cycle time corresponding to the frequency fi, s
td drying time, s
u gas velocity referred to Di, m s-1 X moisture content (dry basis), wt % Greek Letters
o loose bed voidage
angle of the dryer, deg
s density of solid, kg /m3
g density of gas, kg /m3
air viscosity, kg m-1 s-1
REFERENCES
[1] M. Olazar, M.J. San José, A.T. Aguayo, J.M. Arandes and J. Bilbao, “Stable operation conditions for gas-solid contact regimes in conical spouted beds”, Ind. Eng. Chem. Res., vol. 31, pp. 1784-1791, 1992. [2] M. Olazar, M.J. San José, F.J. Peñas, A.T. Aguayo and J. Bilbao,
“The Stability and Hydrodynamics of Conical Spouted Beds with Binary Mixtures”, Ind. Eng. Chem. Res., vol. 32, 2826-2834, 1993. TABLEVI
RESIDUALS OF VARIABLES AND INTERACTIONS ON DRYING TIME
td tˆd td-tˆd
1226.48 1021.7 204.78 1148.32 1275.9 -127.58 981.31 1151.9 -170.59 918.78 793.26 125.52 1145.14 1273.7 -128.56 1072.16 915.06 157.10 916.23 791.06 125.17 857.84 1045.26 -187.42 657.25 541.74 115.51 615.37 795.94 -180.57 525.87 671.94 -146.07 492.36 313.3 179.06 613.66 793.74 -180.08 574.56 435.1 139.46 491.00 311.1 179.90 459.71 565.3 -105.59
0 500 1000 1500
0 50 100
T (慢) td (s)
Fig. 6. Drying time vs. temperature. Experimental values (points), calculated values (lines). Experimental systems: Do/Di = 1, X= 2 wt %
wet coarse particles for different Q/Qms ratios.
Q/Qms= 1 Do/Di = 1
X= 2 wt %
[3] M. Olazar, M.J. San José, R. Llamosas and J. Bilbao, “Hydrodynamics of sawdust and mixtures of wood residues in conical spouted beds”, Ind. Eng. Chem. Res., vol. 33, pp. 993-1000, 1994.
[4] M.J. San José, M. Olazar, F.J. Peñas, and J. Bilbao, “Segregation in Conical Spouted Beds with Binary and Tertiary Mixtures of Equidensity Spherical Particles”, Ind. Eng. Chem. Res., 33, 1838-1844, 1994.
[5] M.J. San José, S. Alvarez, R. Aguado and J. Bilbao, “Combustión de serrín y residuos agroforestales en lechos de borboteo cónicos (Conical Spouted Beds)”, Inf. Tecnol., vol. 13(2), pp. 127-131, 2002.
[6] M. Olazar, M.J. San José, and J. Bilbao Conical Spouted Beds. In Spouted and Spout-Fluid Beds. Fundamentals and Applications, Editors: Norman Epstein and John R. Grace. United Kingdon: Cambridge University Press, Chapter 5, 82-104, 2011.
[7] M.J. San José, S. Alvarez, M.A. Izquierdo and A. Ortiz de Salazar, “Fluidodinámica de los lechos de borbor cónicos (spouted beds) para el tratamiento de residuos plásticos”, Inf. Tecnol., vol. 13(5), pp.
21-24, 2002.
[8] M.J San José., S. Alvarez, A. Ortiz de Salazar, A. Morales and J. Bilbao 2006, “Treatment of Cork Wastes in a Conical Spouted Bed Reactor”, Int. J. Chem. React. Eng., vol. 4, A15, pp. 1-7.
[9] M.J San José, Aguado, R., Alvarez, S., Olazar, M. "Combustion of Sawdust and Agroforestal Wastes in Conical Spouted Beds”. Inf. Tecnol., 13(2), 127-131(2002).
[10] M.J San José., Ortíz de Salazar, A., Alvarez S., Olazar, M. “Conical Spouted Beds for the Treatment of Coal”. Inf. Tecnol., 13(2), 133-137(2002).
[11] M.J. San José, Álvarez, S., Ortiz de Salazar, A., Olazar, M., Bilbao, J. “Operation Conditions in the Treatment of Biomass Wastes by Combustion in a Conical Spouted Bed” In: Science in Thermal and Chemical Biomass Conversion, Bridgwater, A.V., Boocock, D.G.B., Newbury Berks, UK: CPL press. vol. 1, 228-236, 2006.
[12] M.J San José, Alvarez S, Lopez LB, Olazar M., Bilbao J. "Conical spouted beds contactors for drying of sludge from the paper industry“. In: Drying 2010, Tsotsa E., Metzeger T., Peglow M., eds. Magdeburg: Docupoint GmbH, 1242-1248.
[13] M. Olazar, Aguado, R., San Jose, M.J, Bilbao J. "Kinetic Study of Fast Pyrolysis of Sawdust in a Conical Spouted Bed Reactor in the 400-500 °C Range" J. Chem. Technol. Biotechnol., 76(5), 469-476,
2001.
[14] M Olazar., Aguado, R., Arabiourrutia, M., Lopez, G., Barona, A., Bilbao, “Catalyst effect on the composition of tyre pyrolysis products”,
J. Ener. Fuels 22(5) 2909-2916, 2008.
[15] M Olazar., M.J. San José, A.T. Aguayo, J.M. Arandes and J. Bilbao, ”Stable Operation conditions for gas-solid contact regimes in conical spouted beds” Ind. Eng. Chem. Res., 31, 1784-1791, 1992.
[16] M. J. San José , M. Olazar, A.T. Aguayo, J.M. Arandes, and J. Bilbao. ”Hydrodynamics correlations of conical jet spouted beds”, In Fluidization VII, New York, pp. 381-388, 1992.
[17] D. C. Montgomery, “Design of experimentals & statistica modeling”, McGraw Hill In Corporation, New York, 2005.
[18] M. Olazar, M. J. San José, S. Alvarez, A. Morales and J. Bilbao 2004, “Design of conical spouted beds for the handling of low density solids”, Ind. Eng. Chem. Res., 43, 655-661.
[19] J., Xu, X., Bao, W., Wei, G., Shi, S., Shen, H. T., Bi, 2004. „ tatistical and frequency analysis of pressure fluctuations in spouted beds”. Powder Technol., 140, 141–154.
[20] M. S., Bacelos, J. T. Freire, 2006. “Stability of spouting regimes in conical spouted beds with inert particle mixtures”. Ind. Eng. Chem. Res., 45(2), 808–817.
[21] D.C. Montgomery and G.C. Runger, “Applied Statistics and probability for engineers”, 3rd ed., New York: John Wiley & Sons,
2003
[22] M.J. San José, S. Alvarez, F.J. Peñas, L.B. López “Modelling of analysis of influence parameters on cycle time in a novel conical spouted bed dryer with a draft tube”. In: World Congress on Engineering, ICMEEM, Abstract 113, 2011.
[23] M. J. San José, M. Olazar, A.T. Aguayo, J.M. Arandes, and J. Bilbao 1992, Hydrodynamics correlations of conical jet spouted beds, in Fluidization VII, New York, 381-388.