Abstract—Process monitoring is important for the laser welding system, especially for the weld seam deviation monitoring. A 10kW high power fiber laser butt joint welding of type 304 stainless steel was performed. By combing two different band pass filters, high speed photography was employed to capture the near-infrared images of molten pools. Image difference algorithm was used to obtain the weld seam position. By accumulating numbers of near-infrared image, the weld deviation could be monitored. Three different kinds of welding trajectory were employed in testing the effectiveness of weld seam deviation monitoring by using image difference algorithm. The experimental results showed that the accumulation of difference images could be used in laser welding seam deviation monitoring. The maxima gray-value of accumulated image indicated the weld seam position while the laser beam focus position in the image was constant.
Index Terms— image difference algorithm, laser welding, monitoring, near-infrared image
I. INTRODUCTION
ASER welding has been widely used for its conspicuous advantage in small heat-affected zone, high processing speed, high aspect ratio, high quality beam profile, capability of welding at atmospheric pressure and automate process [1,2]. Despite the fact that tight focus attainable with laser beams has such advantages as to deliver heat efficiently and minimize the heat affected zone, it also leads to problems of join alignment and fit up. Since the laser beam diameter is very small (normally from 0.1 mm to 0.6 mm), small misalignment may cause large changes in welding conditions, and even narrow gaps can result in a lack of coupling of laser radiation and reduce heating efficiency [3]. It is still a challenge to guarantee the laser beam focus on weld seam accurately, especially in long weld seam condition and high thickness. Consequently, on-line monitoring of laser welding process is prerequisite for high quality welding.
Effective method for monitoring the welding process is essential to improve welding quality [4-6]. For instance, seam tracking system LPF from Precitec, welding monitor from Prometec, and RoboFind from Servo Robot have been
Manuscript received March 19, 2012; revised May 11, 2012. This work was supported in part by the National Natural Science Foundation of China under Grant 51175095, in part by the Guangdong Provincial Natural Science Foundation of China under Grant 10251009001000001 and 9151009001000020, and in part by the Specialized Research Fund for the Doctoral Program of Higher Education under Grant 20104420110001.
D. You is with the Guangdong University of Technology, Guangzhou, Guangdong Province 510006 China (e-mail: [email protected]).
X. Gao is with the Guangdong University of Technology, Guangzhou, Guangdong Province 510006 China (corresponding author, e-mail: [email protected]).
commercialized for several years [7]. Also, the laser focus deviations from the desired path can be estimated by coaxially monitoring the optical signals emitted from the weld pool area [8]. The way of reconstructing a three-dimensional model of a molten pool and detecting the welding state has been a research focus at the present time [9,10]. Some research has been conducted on infrared temperature measurement of hybrid laser-TIG welding process [11]. Several fundamental studies on plasma monitoring have been performed to evaluate the stability of laser welding [12]. High-speed photography has been proved to be an effective method in analyzing the structure and dynamic behavior of a keyhole during laser welding process [13]. In order to optimize the productivity of laser welding, electromagnetic emissions from the weld zone, such as reflected light, thermal radiation and plasma radiation, are the most important information during on-line monitoring [14]. Recently, using near-infrared sensing technology in seam tracking and monitoring of laser welding process have been investigated [15,16].
This paper proposes a method of seam deviation monitoring during laser welding process. A laser-welding head was fixed to a robot which was controlled by the computer system. A high speed near-infrared sensitive camera was used to capture the molten pool images, and difference image processing techniques were applied to obtain the weld seam position. By accumulating the difference image, the weld seam deviation between laser-beam focus and weld seam could be monitored. The proposed method provides an effective way for laser-welding automation by monitoring the weld seam deviation from near-infrared image of a molten pool.
II. EXPERIMENTAL SETUP
The experimental system consisted of an IPG fiber laser welding equipment (laser power 10 kW), the shielding gas (argon), a 6-axis robot and a welding platform equipped with a high-speed camera, servo motors and fixing device. The schematic drawing of the system is shown in Fig.1. The welding material was stainless steel plates of 10 mm in thickness, 150 mm in length and 100 mm in width. The welding speed was 2.5 m/min, with a beam diameter of 200 m. In order to eliminate interference and obtain clear near-infrared image of a molten pool, two narrow band pass filters at designated frequency were placed ahead of the camera lens. By analyzing the spectrum of a molten pool, it was observed that the heat radiation of a molten pool mainly covered the near infrared band, while the plume radiation
Monitoring of High Power Laser Welding
Process by Using Image Difference Algorithm
Deyong You, Xiangdong Gao
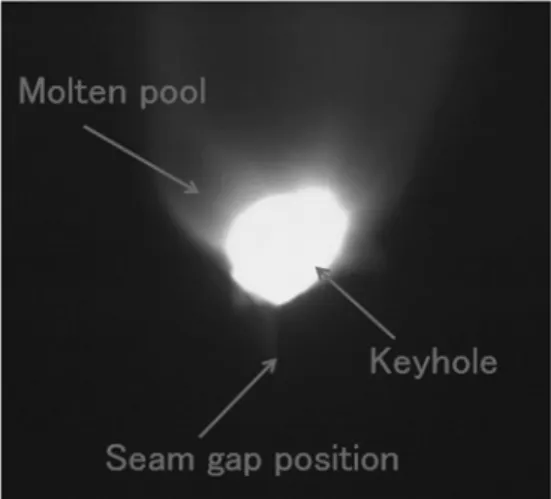
gathered at the ultraviolet band. By using a combination of the two filters resulting in a spectral band of 960-990 nm, the camera was made sensitive to the molten pool emissions (thermal radiation). The response curves and combing results of various filters are shown in Fig. 2. Molten pool image recording was carried out at 1000 frames /second by a high speed CMOS camera. A near-infrared image of molten pool captured by high speed camera is shown in Fig. 3.
Fig. 1. Experimental setup of high power fiber laser welding monitoring system with high speed near-infrared sensing
Fig. 2. Optical filter response curves and the result of optical filters combination
Fig. 3. Near-infrared image of a molten pool captured by high speed camera with filter combination
III. IMAGE DIFFERENCE PROCESS
A. Difference Image Accumulation
The near-infrared images contained three primary information of laser welding process, which were molten pool, keyhole and seam gap position. As seen from Fig.3, it is difficult to accurately identify seam gap position from the image. Considering that the exact position of laser beam spot in the image can be obtained from the guiding laser before welding process, the welding deviation between laser beam focus and weld seam can be monitored from the gray-value variation of seam gap area in near-infrared image.
Suppose the near-infrared image at time t is ft (x, y). The difference images between near-infrared image at time t and time t+1 is Ft (x, y). By accumulating difference images from time t to time t+n, the maxima gray-value variation of near-infrared images, which indicated the weld seam position, could be obtained. The image difference process is shown by Fig.4.
Fig. 4. Image difference process of near-infrared images of molten pool
Considering the gray-value of gray-scale image arrange from 0 to 255, accumulating more than 100 difference image would lead to huge gray-value, which cannot be shown in the gray-scale image after the image process. So the difference images would be divided by the number of m. In this case, 1000 near-infrared images would be accumulated to obtain the laser welding deviation and m would be set on 100. The difference images accumulation Gt (x, y) is expressed as
n
i
i t i
t n
i i t t
m
y
x
f
y
x
f
y
x
F
y
x
G
0 1 0
)]
,
(
)
,
(
[
)
,
(
)
,
(
(1)
(a)
(b)
(c)
(d)
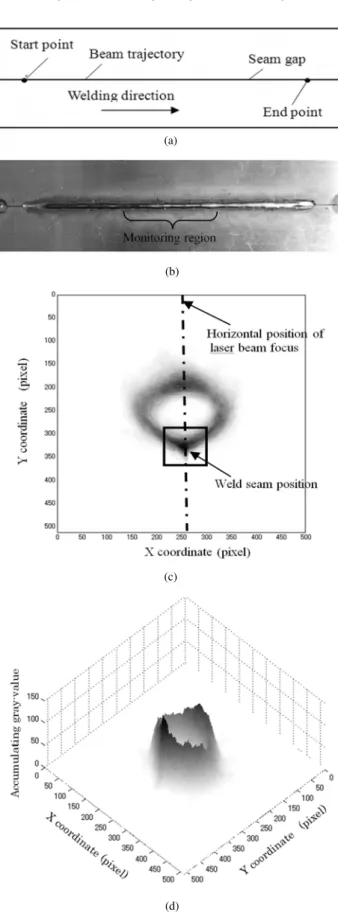
Fig. 5. Difference images accumulation results during laser beam focus on the weld seam center (a) schematic of beam trajectory on weld seam center (b) weld bead surface (c) 2D view of accumulation results of 1000 difference images (d) 3D view of accumulation results of 1000 difference images
B. Laser Beam Focus on Weld Seam
In the first experiment, 1000 continuous near-infrared images were used to perform image difference algorithm. The monitoring region of welding process is shown by Fig.5 (b). Because the laser head and high speed camera maintained a relatively constant position, the laser beam horizontal
position in the near-infrared image wasfixed, which is shown by Fig.5 (c). As shown in Fig.5 (c) and (d), the maxima gray-value of accumulation image of 1000 difference images appeared in the weld seam area, which was the same horizontal position of laser beam focus in the first welding experiment.
(a)
(b)
(c)
(d)
(a)
(b)
(c)
(d)
(e)
(f)
(g)
(h)
C. Laser Beam Deviated from Weld Seam
In the second welding experiment, the maxima gray-value of accumulation image of 1000 difference images appeared in the weld seam area as laser beam focus deviated to the right. The monitoring results of second experiment were shown by Fig.6 (c) and (d). As previously mentioned, the laser beam focus position of near-infrared image was fixed and only the weld seam position changes. By using the image difference algorithm, the weld seam position could be distinguished from the laser beam position while laser welding deviation appeared.
D. Laser Beam Deviated from Weld Seam Gradually
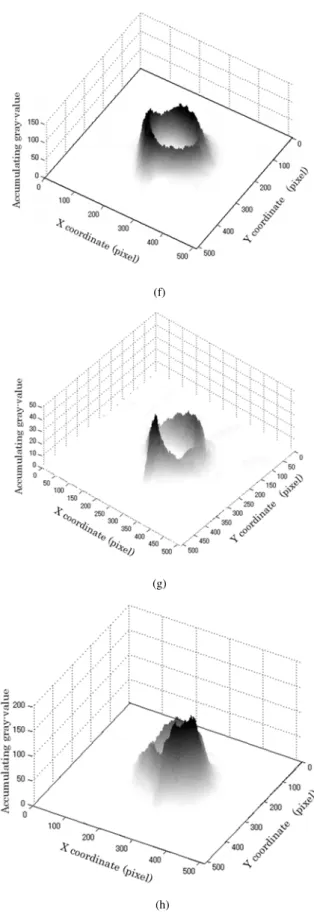
In the third experiment, the laser beam focus moved from the right of weld seam to the left gradually. Therefore three different types of monitoring region were selected. There were 1000 near-infrared images selected for monitoring the right deviation and another 1000 near-infrared image for the left deviation. Also, there were 200 near-infrared images used for monitoring the process without deviation. The monitoring regions of welding process are shown by Fig.7 (b). As seen from Fig.7 (c) and (e), the maxima gray-value of accumulation image of 1000 difference images appeared in the weld seam area from which the laser beam focus deviated to the right while monitoring at right deviation. The maxima gray-value appeared at the position from which the laser beam focus deviated to the left while monitoring at left deviation which is shown by Fig.7 (f) and (h). Although there was small deviation (less than 0.056 mm) between laser beam focus and weld seam center in the middle of welding process, it still could be assumed that at this position the laser beam focused on the weld seam center. As shown in Fig.7 (d) and (g), the maxima gray-value appeared at the same horizontal position of laser beam focus.
IV. CONCLUSION
The seam deviation monitoring of high power laser butt joint welding by using image difference algorithm was investigated. Near-infrared sensing technology was applied in welding process monitoring. Three welding conditions with different trajectories were performed. Without welding deviation, the maxima gray-value of accumulating image should appear at the same horizontal position of laser beam focus. During the process of welding deviations, the maxima gray-value of accumulating image should appear at the position which laser beam focus deviated from. The proposed method of image difference has been proved to be useful in laser welding monitoring.
ACKNOWLEDGMENT
Many thanks are given to Katayama Laboratory of Osaka University for their assistance of laser welding experiments.
REFERENCES
[1] S. Katayama, Y. Kawahito, “Laser direct joining of metal and plastic,”
Scripta Materialia, vol. 59, no. 12, pp. 1247–1250, Dec. 2008. [2] Q. Wu, J.K. Gong, G.Y. Chen, L.Y. Xuc, “Research on laser welding of
vehicle body," Optics & Laser Technology, vol. 40, no. 2, pp. 420–426, Mar. 2008.
[3] W. W. Duley, Laser welding. Waterloo, Canada: Wiley, 1998, pp. 3–9.
[4] K. Pal, S. K. Pal, “Monitoring of weld penetration using arc acoustics,”
Materials and Manufacturing Processes, vol. 26, no. 5, pp. 684–693, May. 2011.
[5] B. Fabrice, C. Adolfo, M. L. H. Jose, C. Olivier, A. Pascal, D. Thierry, H.N. Per, J. Peter, D. C. J. Julian, P. H. Duncan, “Optical techniques for real-time penetration monitoring for laser welding,” Applied Optics, vol. 44, no. 19, pp. 3869–3876, Jul. 2005.
[6] T. Sibillano, A. Ancona, V. Berardi, P.M. Lugara, “Real-time monitoring of laser welding by correlation analysis: The case of AA5083,” Optics and Lasers in Engineering, vol. 45, no. 10, pp. 1005–1009, Oct. 2007.
[7] J. Noruk and J. P. Boillot, “Laser vision technology ensures six sigma-level quality is achieved in robotic welding,” Canadian Welding Association Journal, vol. 8 pp. 8–14. 2006.
[8] C. Kratzsch, P. Abels, S. Kaierle, R. Poprawe, “Coaxial process control during laser beam welding of tailored blanks,” In: Proceedings of SPIE 3888. Proceedings AHPLA99. High-Power Lasers in Manufacturing. Proc. SPIE 3888, Osaka, 2000, p. 472-482.
[9] H. S. Song, Y.M. Zhang, “An image processing scheme for measurement of specular weld pool surface,” In Proceedings of Second IEEE Conference on Industrial Electronics and Applications,Harbin, 2007,pp.5-10.
[10] H.S. Song, Y.M. Zhang, “Measurement and analysis of three-dimensional specular gas tungsten arc weld pool surface,”
Welding Journal, vol. 87, no. 8, pp. 85–95, Apr. 2008.
[11] R.S.Huang, L.M.Liu, and G.Song, “Infrared temperature measurement and interference analysis of magnesium alloys in hybrid laser-TIG welding process,” Materials Science and EngineeringA, vol. 447, no. 1-2, pp. 239–243, Feb. 2007.
[12] G. Li, Y. Cai, Y. Wu, “Stability information in plasma image of high-power CO2 laser welding,” Optics and Lasers in Engineering, vol. 47, no. 9, pp. 990–994, Sep. 2009.
[13] X. Jin, “A three-dimensional model of multiple reflections for high-speed deep penetration laser welding based on an actual keyhole,”
Optics and Lasers in Engineering, vol. 46, no. 1, pp. 83–93, Jan. 2008. [14] R. Olsson, I. Eriksson, J. Powell, A.F.H. Kaplan, “Advances in pulsed laser weld monitoring by the statistical analysis of reflected light,”
Optics and Lasers in Engineering, vol. 49, no. 11, pp. 1352–1359, Nov. 2011.
[15] X.D.Gao, D.Y.You, S. Katayama, Y. Kawahito, “Visual Techniques for Real-time Seam tracking Monitoring during Fiber Laser Welding,”
In Proceedings of LAMP2009-the 5th International Congress on Laser Advanced Materials Processing,Kobe, 2009