doi: 10.1590/0101-7438.2016.036.02.0259
CONSIDERATIONS REGARDING THE CHOICE OF RANKING MULTIPLE CRITERIA DECISION MAKING METHODS
Alexandre Bevilacqua Leoneti
Received March 11, 2015 / Accepted April 19, 2016
ABSTRACT.Various methods, known as Multiple Criteria Decision Making Methods (MCDM), have been proposed to assist decision makers in the process of ranking alternatives. Given the variability of available methods, choosing an MCDM ranking method is a difficult task. There are key factors in the process of choosing an MCDM method such as: (i) available time; (ii) effort required by a given approach; (iii) impor-tance of accuracy; (iv) transparency necessity; (v) conflict minimization necessity; and (vi) facilitator’s skill with the method. However, the problem is further increased by the knowledge that the solution of MCDM ranking methods may be sensitive to slight variations in entrance data and, in some cases, might replace the best alternative for the worst when the weightings for the criteria are changed. Some researchers have addressed this problem through different approaches, including the evaluation of MCDM ranking methods in the sense of predicting the initial rankings given by the decision maker. The objective of this study is to propose an empirical experiment to evaluate the propensity for initial ranking prediction of the principal MCDM ranking methods, namely: SAW, TOPSIS, ELECTRE III, PROMETHEE II and TODIM. The study also aimed to assess possible common ranking problems in MCDM methods, such as reversibility, found in the literature. It was found that just up to 20% of initial ranking order was predicted entirely correct by some of the methods. It was also found that just a few methods did not present internal ranking inconsistency. The results of this study and those found in the literature give a warning regarding the choice of MCDM ranking methods. It is suggested that special care must be taken in the choice of methods and, besides axiomatic comparisons, ranking comparisons could be a useful way to enhance the decision making process, since MCDM methods are tools for learning about the problem and do not prescribe solutions.
Keywords: Ranking comparison, Ranking similarity, Predicting propensity, SAW, TOPSIS, ELECTRE III, PROMETHEE II, TODIM.
1 INTRODUCTION
Various methods, known as Multiple Criteria Decision Making Methods (MCDM), have been proposed to assist decision makers in the process of ranking alternatives (ROY, 1985). The most notable MCDM methods for ranking alternatives are the Simple Additive Weighting (SAW)
(Churchman; Ackoff, 1954), theElimination et Choice Traduisant la Realit´e(ELECTRE) II, and III methods (Roy, 1968), the Technique for Order Preference by Similarity to Ideal Solution (TOPSIS) (Hwang & Yoon, 1981), the Preference Ranking Organization Method for Enrichment Evaluations (PROMETHEE) II (Brans & Vincke, 1985), and the Tomada de Decis˜ao Intera-tiva Multicrit´erio(TODIM) (Gomes & Lima, 1992). These methods have been used in a wide range of complex problems including forestry decisions (Diaz-Balteiro; Romero, 2008); energy planning (Pohekar; Ramachandran, 2004); water resource planning and management (Hajkow-icz; Collins, 2007); broadband Internet (Rangel et al., 2011); oil refining (Meirelles & Gomes, 2009); and water supply systems (Morais, et al., 2010) among others.
However, given the variability of available methods, choosing an MCDM ranking method is a difficult task. Almeida (2013) asserts that there are key factors in the process of choosing an MCDM method, such as: (i) available time; (ii) effort required by a given approach; (iii) im-portance of accuracy; (iv) transparency necessity; (v) conflict minimization necessity; and (vi) facilitator’s skill with the method. Almeida (2013) complements by saying that the choice of an MCDM method should be aligned with the preference structure and the rationality assumption of the decision makers. The problem is further increased by the knowledge that solution of MCDM ranking methods may be sensitive to slight variations in entrance data, e.g. small changes in the weighting vector based on the decision maker’s preferences, or to the computational algorithm employed (Yoon & Hwang, 1995; Buede & Maxwell, 1995; Zanakis et al., 1998; Yeh, 2002; Maxwell, 1995). There is also the fact that MCDM ranking methods, in some cases, might re-place the best alternative for the worst when the weightings for the criteria are changed (Tallarico, 1990; Wang & Triantaphyllou, 2008; Brunner & Starkl, 2004).
Some researchers addressed this problem through different approaches. For example, Mareschal (1988) defines stability intervals for the weightings of the different criteria in order to study the stability of the results generated by the PROMETHEE method. Buede & Maxwell (1995) used the Monte Carlo approach to study MCDM inconsistency in the Analytic Hierarchy Process (AHP) and TOPSIS methods. Zanakis et al. (1998) verified the ranking inconsistency of ELEC-TRE, TOPSIS, SAW, and four versions of AHP, also using the Monte Carlo approach based on twelve consistency measures. Yeh (2002) performed sensitivity analysis and proposed a measure for the degree of consistency, based on Shannon’s entropy concepts, for evaluating the SAW and TOPSIS methods. Moshkovich et al. (2012) evaluated the stability of the results obtained through the SAW and TODIM methods. Gomes & Costa (2015) used a set of methods, including ELECTRE I, II and PROMETHEE II, in order to evaluate the differences between the rankings generated by these different methods in the choice of an electronic payment system. In turn, Yoon & Hwang (1995, p.68) suggested that MCDM ranking methods should be evaluated in the sense of predicting the initial rankings given by the decision maker, that is “how well a method predicts unaided decisions made independently of the judgments used to fit the model”.
common ranking problems in MCDM methods, such as reversibility, found in the literature. For this purpose, a multicriteria decision problem regarding the choice of a travel destination was ap-plied to an experimental group using SANNA1software (Jablonsk´y, 2009) and with the help of a spreadsheet for the calculations of the TODIM method. In total, 20 undergraduate students from the Ribeir˜ao Preto School of Economics, Business Administration and Accounting, participated in the experiment in order to verify the adherence of the rankings proposed by the methods with the participants’ initial rankings suggestion.
As with other studies in the literature, the present study does not intend to make an axiomatic, numerical or deterministic comparison between the methods, but to make considerations regard-ing the choice of MCDM rankregard-ing methods by applyregard-ing and evaluatregard-ing different methods. The study is justified because none of the related studies in the literature carried out comparisons among all of the most notable MCDM ranking methods at the same time.
2 THEORETICAL FRAMEWORK
In the context of solving multiple criteria problems, the possibility of different rankings by the application of different MCDM ranking methods occurring is a factor that should be taken into consideration by the users who opt for this kind of approach. Buede & Maxwell (1995) have already identified problems related to final ranking inconsistency in some well-known multiple criteria methods. According to the authors, although these methods have been developed based on a different number of theories and algorithms, the decision is always made considering the preferences on a set of weighting criteria (Buede & Maxwell, 1995).
In their research, Buede & Maxwell (1995) chose the AHP and TOPSIS ranking methods, among others, to verify whether there were differences in the results when using Monte Carlo experi-ments. According to the authors, the selected methods have two common characteristics: (i) they require the decision maker to give a weighting to a set of data; and (ii) they produce alternative rankings indicating the best among them (Buede & Maxwell, 1995). The authors hypothesized that there would be a risk in the misapplication of these algorithms, given that the literature mentions ranking problems in methods such as AHP. The authors conducted a series of simu-lation experiments that allowed them to compare the best alternative indicated by each of the algorithms. Experiments have shown that the AHP method often does not present ranking dis-agreement with other compared methods, which was not the case of TOPSIS. The situations in which the most significant differences occurred were often associated with this last method (Buede & Maxwell, 1995).
Mareschal (1998) states that the problem of assessing the relative importance of different criteria is commonly performed by sensitivity analysis. Alternatively, the author proposed stability in-tervals for the weights of the different criteria in additive methods, such as PROMETHEE II, for improving the technique of sensitivity analysis, reducing the time of this procedure. According
1SANNA is Excel add-in open source software that covers MCDM ranking methods used most often, such as TOPSIS,
to Marechal (1998, p. 54), such stability intervals are “values that the weighting of one criterion can take without altering the results given by the initial set of weightings, all other weightings being kept constant”. Marechal (1998) studied the sensitivity of the results inducing variations of the strictly positive weightings normalized to one. The author proposed changes to the total weighting while the relative importance of other criteria were kept constant. Finally, the use of the method in a didactic example using the PROMETHEE II outranking method where the cri-teria intervals were calculated (Mareschal, 1998) was presented. Mareschal (1998) affirmed that the intervals provide a deeper knowledge of the decision problem to the users, which can prevent them from ranking changes.
In turn, Zanakis et al. (1998) noticed that ranking methods might produce different rankings even when applied to the same problem, apparently under the same conditions. According to the authors, this inconsistency occurs because: (i) each method uses different weighting calculations; (ii) the algorithms differ in their approach to selecting the best solution; and (iii) some algorithms introduce additional parameters that affect the chosen solution. Moreover, this situation can be intensified by differences in weighting extraction among different decision makers, even with similar preferences (Zanakis et al., 1998).
Therefore, according to Zanakis et al. (1998), the wide variety of available methods with com-plexity and varying solutions might confuse potential users. Thus, according to the authors, the decision maker must first face the task of selecting the most suitable method among the many possible alternatives. According to Zanakis et al. (1998), users could compare these methods considering different dimensions, such as simplicity, reliability, robustness and quality. An ex-tensive literature review carried out by Zanakis et al. (1998) revealed that only a limited num-ber of studies were devoted to comparing different methods. Zanakis et al. (1998) subsequently concluded that it is very difficult to answer questions such as “which method is the most appro-priate for a specific type of problem and what are the advantages and disadvantages of using one method rather than another?”
number of criteria increases (Zanakis et al., 1998). Based on the results obtained, the authors argue that these methods should help the user learn more about the problem and possible solu-tions for reaching a final decision, and thus do not advocate the use of MCDM for a prescriptive solution (Zanakis et al., 1998).
As reported by Yeh (2002), there is no best method for multiple criteria decision problems, and the validity of the ranking results remains an open question. In some particular cases, the so-lutions produced by different MCDMs are the same. However, in situations where the decision ranking of all alternatives is necessary, the author states that it is important to take into account that different methods produce different results for the same problem. In other words, for the same weighting vector the ranking order may vary depending on the method used, and this mis-match increases as the number of alternatives increases (Yeh, 2002). Consequently, choosing a method from a variety of MCDM methods has also become a multicriterial problem (Yeh, 2002).
Based on his postulation, Yeh (2002) proposed a new approach to the selection of MCDM meth-ods via sensitivity analysis of attribute weightings, seeking to determine to what degree the rank-ing of the alternatives provided by the evaluated methods could vary when changes occur in the weightings of the criteria. Yeh (2002) also used the concept of Shannon’s entropy to pro-pose a measure for the degree of consistency of the rankings. Three methods were selected to be applied to a case study in which a college needed to select students to be awarded a schol-arship. The methods chosen were SAW, MEW and TOPSIS. In the case study developed, the most suitable method identified was TOPSIS. According to the author, the proposed approach is particularly useful for large-scale problems where the ranking produced by different methods differ significantly (Yeh, 2002).
Wang & Triantaphyllou (2008) also stated that different multiple criteria methods suffer from the disadvantage of providing different answers to exactly the same problem. According to Wang & Triantaphyllou (2008), some of the MCDM methods use the sum of the priorities of the alternatives, such as the AHP method (American school), while others use classification rela-tionships, such as the ELECTRE method and its derivatives (French school). Irregularities in AHP ranking have been reported by many researchers and for the first time the authors also point out these irregularities for ELECTRE (Wang & Triantaphyllou, 2008).
were developed, to generate simulated decision problems and test the performance of ELECTRE II and III evaluating the three requirements listed. As a result, it was found that the best alterna-tive remained the same for both methods, but there was a significant difference in the ranking of other alternatives (Wang & Triantaphyllou, 2008)2.
Moshkovich et al. (2012, p. 523) affirmed that “multiple criteria decision aiding techniques are used to construct an aggregation model on the basis of preference information provided by the decision maker”. The authors analyzed the differences in the implementation and the stability of the results obtained by TODIM and SAW through direct preferential information. Moshkovich et al. (2012) compared a set of 15 residential properties available for rent in the city of Volta Redonda in Brazil, against eight criteria using both aggregation methods. The authors concluded that it is difficult to select an appropriate multiple criteria ranking method because “criterion weightings and scale transformations for criterion values produced significant differences in the ranking of alternatives when two different methods are used for the aggregation of the prefer-ential information” (Moshkovich et al., 2012, p. 538). The SAW method produced a significant different ranking when compared to the ranking produced by the TODIM method.
Gomes & Costa (2015) also studied why there is difference between the results when different MCDM ranking methods are applied to the same problem. In this sense, the objective of their research was to map the possible differences among the rankings provided by the application of THOR, ELECTRE I and II, and PROMETH ´EE II to the problem of choosing three different kinds of electronic payment by credit card (fourteen criteria were considered). Based on the results obtained by the application of the four different multicriteria methods and the use of sensitivity analysis, the authors claim that a decision maker could enhance his decision process with greater knowledge of the problem by considering a different method solution.
3 RESEARCH METHOD
In order to propose an empirical experiment to evaluate the propensity for initial ranking predicting of the principal MCDM ranking methods, namely: SAW, TOPSIS, ELECTRE III, PROMETHEE II and TODIM, twenty students from different years and courses from Ribeir˜ao Preto School of Economic, Management and Accounting, were invited to evaluate a decision matrix containing five travel destinations (alternatives A to E) performed with eight different cri-teria, namely: (i) Hotel rating, which is the rating for a hotel (ranging from 1, worst to 5, the best); (ii) Time distance – distance in hours from the destination; (iii) Day length – the amount of days in the travel; (iv) Cost – the price of accommodation and flight ticket (in US$); (v) Shopping – the index for the amount and diversity of shopping places (ranging from 1, worst to 10, the best);
2In contrast to Wang & Triantaphyllou (2008), Figueira & Roy (2009, p. 731) stated that “the objective of decision aiding
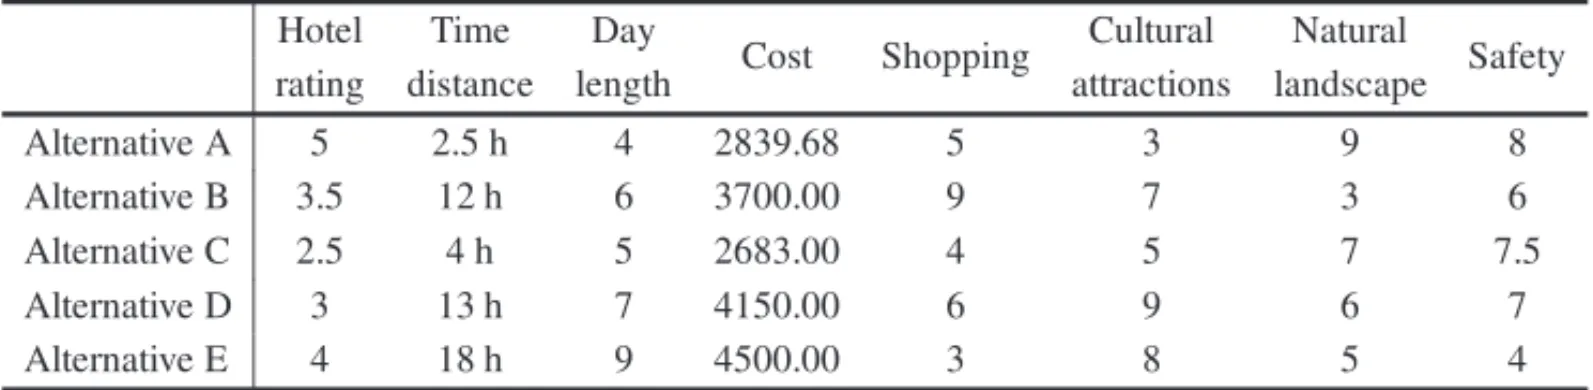
(vi) Cultural attractions – the index for the amount and diversity of cultural attractions (ranging from 1, worst to 10, the best); (vii) Natural landscape – the index for the presence of natural landscape (ranging from 1, worst to 10, the best); and (viii) Safety – whether it is safe in terms of health conditions, violence or terrorism (ranging from 1, most unsafe to 10, the safest). Ta-ble 1 presents the decision matrix whose performance criteria was derived from Brazilian travel agency packages (Leoneti et al., 2015).
Table 1–Decision matrix for participants evaluation.
Hotel Time Day
Cost Shopping Cultural Natural Safety
rating distance length attractions landscape
Alternative A 5 2.5 h 4 2839.68 5 3 9 8
Alternative B 3.5 12 h 6 3700.00 9 7 3 6
Alternative C 2.5 4 h 5 2683.00 4 5 7 7.5
Alternative D 3 13 h 7 4150.00 6 9 6 7
Alternative E 4 18 h 9 4500.00 3 8 5 4
The participants were required to evaluate the matrix and to rank all alternatives, which was stored as their respective initial ranking. The participants were also required to rank all criteria from which the respective weighting vectors were calculated using the eliciting Rank Ordered Centroid (ROC) method. The decision matrix was processed by SANNA software (Jablonsk´y, 2009) and for each participant the respective weighting vector was inserted manually in order to calculate the ranking generated by the SAW, TOPSIS, ELECTRE III and PROMETHEE II methods. The TODIM method was modeled using the Visual Basic Application in an Excel spreadsheet and was used to calculate the ranking related to this approach.
Subsequently, the output data from SANNA (SAW, TOPSIS, ELECTRE III and PROMETHEE II methods) and from the spreadsheet (TODIM method) were analyzed through descriptive statis-tics. Firstly, the rank-order correlation coefficientrs of Spearman, which is considered a
mea-sure for the association between the rankings of N objects generated by two observers (Siegel & Castellan JR., 1988), was applied to measure the correspondence between the initial ranking (defined by the participants) and the ranking calculated by each of the five MCDM ranking meth-ods. The value ofrs ranges from –1 to 1 and is compared with tabulated values for a two-sided
or one-sided test. The decision criterion is to reject H0whenrs is greater than the critical value,
meaning that the ranking varies similarly. Equation 1 presents the calculation for thers Spearman coefficient.
rs =1− 6
di2
N3−N (1)
where,
N = number of objects,
Here theNobjects are the five alternatives under evaluation. According to Siegel & Castellan Jr. (1988), a highrs value indicates that the two rankings are associated (proportionately when the value is close to 1 and inversely, when the value is close to –1).
Secondly, the output rankings from all MCDM methods were compared with each other for all participants. In order to verify the degree of similarity between rankings ofNobjects generated bykobservers or judges (forkgreater than 2), the W Kendall coefficient concordance can be used as a measure of dependence between the rankings (Siegel & Castellan JR., 1988). A high value ofW can be interpreted as the degree to which kobservers or judges ranked N objects similarly. The value ofW ranges from 0 to 1 and is compared with tabulated values for a one-sided test. The decision criterion is to reject H0whenW is closer to one, meaning the rankings
are dependent. Equation 2 presents the calculation of the W Kendall coefficient.
W =12
R2i −3k2N(N+1)2
k2N(N2−1) (2)
where,
k= number of ranking sets,
N = number of objects,
Ri = average position of the criterioni from each ranking.
Here thek “judges” are the five MCDM methods, each one generating a ranking over the N
objects, which are the five alternatives being evaluated. The W Kendall significance can be deter-mined based on the probability associated with each occurrence. According to Siegel & Castellan Jr. (1988), forNandkequal to five, H0is rejected whenW is greater than 0.571 for the
signifi-cance level of 1%.
Thirdly, the participants were questioned regarding the comparison between their initial ranking and that provided by the methods. A question, namely “Do you regret your initial ranking of alternatives?” was responded by the participants at the end of the application using a Likert-type scale with seven levels (one, strongly disagree, and seven, strongly agree). The output data were then evaluated using descriptive statistics in graphic form and then compared to ranking problems identified in the literature. Additionally, the participant with the highest score for this question among those with the highest value forW Kendall significance was selected for sensi-tivity analysis using their initial weighting vector. The weighting vector of the chosen participant suffered variations of 20% in the value of a single criterion, selected randomly obeying a uniform distribution. There were 100 iterations and in each iteration, due to the distortions caused by the criterion that suffered the variation, the relationships with the other criteria were recalculated using Equation 3 according Ensslin et al. (2001).
wn∗= wn(1−w ∗
i)
(1−wi)
(3)
wi = original weighting for criterioni,
w∗
i = ten percent changed weighting for criterioni,
wn= original weighting for criterionn,
w∗
n= recalculated weighting for criterionn.
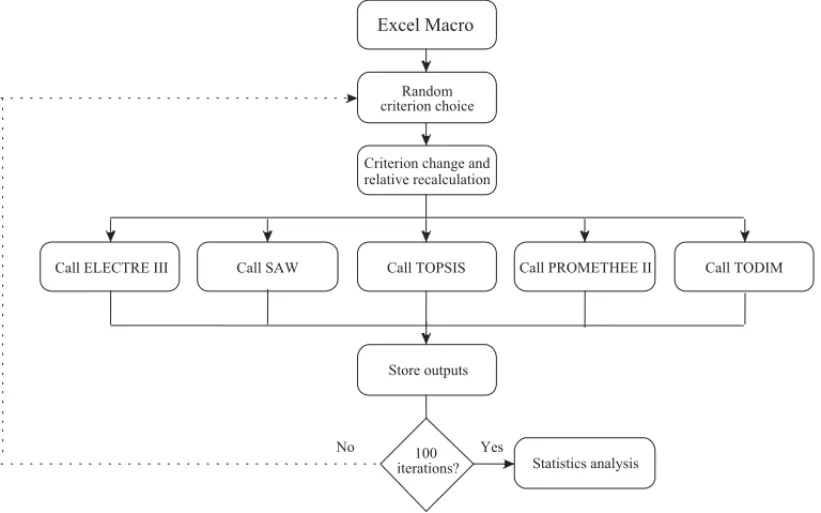
Finally, with the new weighting vector generated in each of the 100 iterations, the macro called all classes of SAW, TOPSIS, ELECTRE III and PROMETHEE II algorithms from SANNA and stored the output in a separate spreadsheet. An additional step was performed simultaneously in order to calculate the results from the TODIM method, the output also being stored. The flowchart depicted in Figure 1 summarizes all steps included in the Excel macro for sensitivity analysis.
Excel Macro
Random criterion choice
Criterion change and relative recalculation
Call ELECTRE III Call SAW Call TOPSIS Call PROMETHEE II Call TODIM
Store outputs
Statistics analysis 100
iterations? Yes No
Figure 1–Flowchart for the sensitivity analysis programmed in Excel macro.
4 RESULTS AND DISCUSSION
4.1 Decision matrix set up and results generation
In other words, it was decided that for all criteria the alternative should be classified as the larger the criteria values the higher the ranking order in the ranking. Figure 2 shows the decision matrix settled into the SANNA considering all criteria as benefit criteria.
Figure 2–Decision matrix set up as input for the various methods available in SANNA.
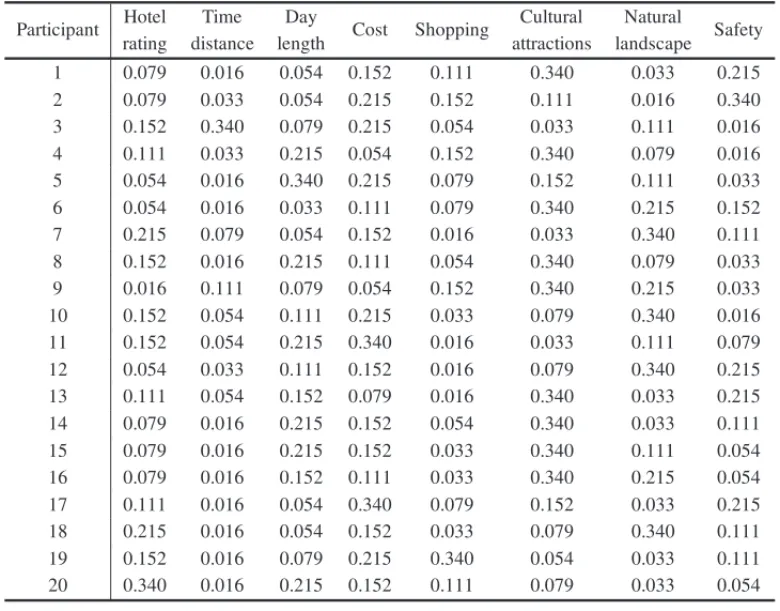
Subsequently, each weighting vector calculated by the ROC method for each participant (Ta-ble 2) was manually inserted into the SANNA and for each one all classes of SAW, TOPSIS, ELECTRE III and PROMETHEE II algorithms were run. In order to calculate the results from ELECTRE III the criteria were all considered as true-criteria (without pseudo-criteria), hence the parameters veto, indifference, and preference were set to zero. In order to calculate the results from PROMETHEE II the value for preference (p) to the function of linear preference (), as shown in Equation 4 and Figure 3, was settled at 0.6 for each criterionk. At the end, the out-puts were stored in a separate spreadsheet. The same procedure was carried out with the Excel spreadsheet containing the TODIM method, in this case using the parameterθ(the attenuation factor of the losses) settled at 10.
i,j =
⎧ ⎪ ⎨
⎪ ⎩
0 d ≤0
d/pk 0≤d ≤ pk
1 d ≥ pk
(4)
4.2 Accuracy and ranking similarity evaluation
Table 2–Weighting vectors for the participants.
Participant Hotel Time Day Cost Shopping Cultural Natural Safety
rating distance length attractions landscape
1 0.079 0.016 0.054 0.152 0.111 0.340 0.033 0.215
2 0.079 0.033 0.054 0.215 0.152 0.111 0.016 0.340
3 0.152 0.340 0.079 0.215 0.054 0.033 0.111 0.016
4 0.111 0.033 0.215 0.054 0.152 0.340 0.079 0.016
5 0.054 0.016 0.340 0.215 0.079 0.152 0.111 0.033
6 0.054 0.016 0.033 0.111 0.079 0.340 0.215 0.152
7 0.215 0.079 0.054 0.152 0.016 0.033 0.340 0.111
8 0.152 0.016 0.215 0.111 0.054 0.340 0.079 0.033
9 0.016 0.111 0.079 0.054 0.152 0.340 0.215 0.033
10 0.152 0.054 0.111 0.215 0.033 0.079 0.340 0.016
11 0.152 0.054 0.215 0.340 0.016 0.033 0.111 0.079
12 0.054 0.033 0.111 0.152 0.016 0.079 0.340 0.215
13 0.111 0.054 0.152 0.079 0.016 0.340 0.033 0.215
14 0.079 0.016 0.215 0.152 0.054 0.340 0.033 0.111
15 0.079 0.016 0.215 0.152 0.033 0.340 0.111 0.054
16 0.079 0.016 0.152 0.111 0.033 0.340 0.215 0.054
17 0.111 0.016 0.054 0.340 0.079 0.152 0.033 0.215
18 0.215 0.016 0.054 0.152 0.033 0.079 0.340 0.111
19 0.152 0.016 0.079 0.215 0.340 0.054 0.033 0.111
20 0.340 0.016 0.215 0.152 0.111 0.079 0.033 0.054
p
k1
d
Φ
i, jFigure 3–PROMETHEE II function for indifference and preference.
TODIM, the value ofrs Spearman coefficient was calculated. Figure 4 shows the average of the rs Spearman coefficient calculated for the twenty participants.
0 0,1 0,2 0,3 0,4 0,5 0,6
ELECTRE III SAW TOPSIS PROMETHEE II TODIM
Figure 4–Average correlation with the initial ranking among the 20 participants.
best scores were achieved by the TOPSIS method3. TOPSIS accuracy reached 50% of at least
three matches in rank-orders for all twenty participants, followed by PROMETHEE II (40%), ELECTRE II (30%), and TODIM and SAW, both with 25%. It should be noted however that the number for ranking prediction (five correct matches) for TOPSIS was the same as ELECTRE III, both with 20%, followed by SAW and PROMETHEE II with 10% each and TODIM with 0%. This result can be explained considering that TOPSIS, according to Buede and Maxwell (1995), is subject to larger alteration of the rank-order including ranking reversal problems. In this sense, when a modification of rank-order occurs it tends to be very distinct. Finally, the prediction regarding the first alternative (best alternative) in the ranking was also checked. In this criterion, TOPSIS again had good performance. Together with PROMETHEE II, TOPSIS correctly predicted 15 times the first alternative ranking, which means 79% of accuracy. Both methods are followed by SAW (74%), ELECTRE III (57%) and TODIM (37%). Likewise to the case presented by Yeh (2002), TOPSIS performance attracted attention in terms of accuracy.
In terms of ranking similarity, which is how much ranking order varies according to the method used, the output rankings were tested using the W Kendall coefficient concordance. The hypoth-esis tested whether the ranking varies depending on the method used (independence condition). The calculated W Kendall coefficient is compared with the critical value of 0.571 and the null hypothesis of independency is rejected if the coefficient is larger than the critical value. In this application, just for eight cases the null hypothesis was rejected, meaning that the decision maker obtained significantly different rankings with the application of the five methods for 55% of the cases. This result is in accordance with Wang & Triantaphyllou (2008), Yeh (2002), and Zanakis
3The number of correct rank-order prediction is the number of matches between the initial ranking order and that provided
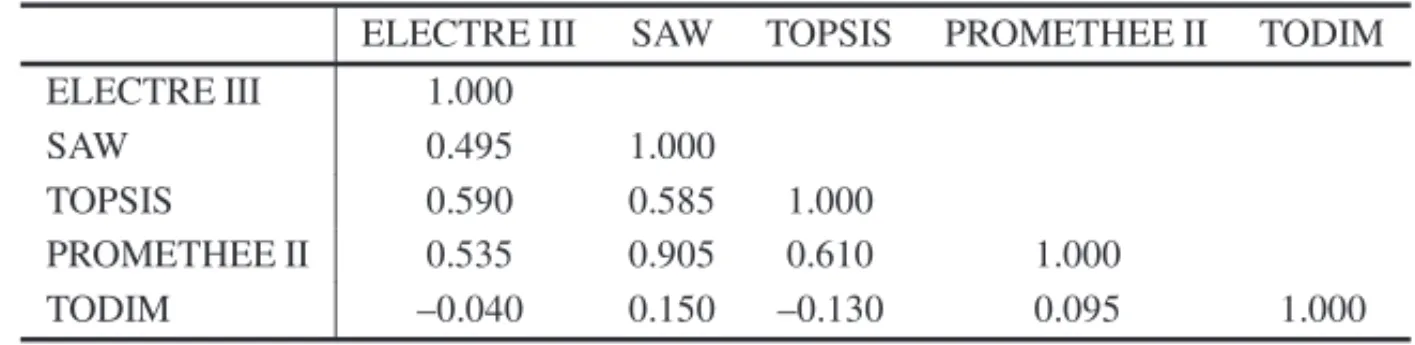
et al. (1998) that for the same weighting vector, the ranking order may vary depending on the method used. Finally, the correlation between each method using the value of rsSpearman
coef-ficient was evaluated. The results are shown in Table 3.
Table 3–Correlation table.
ELECTRE III SAW TOPSIS PROMETHEE II TODIM
ELECTRE III 1.000
SAW 0.495 1.000
TOPSIS 0.590 0.585 1.000
PROMETHEE II 0.535 0.905 0.610 1.000
TODIM –0.040 0.150 –0.130 0.095 1.000
The results presented in the correlation table corroborate the verification of Zanakis et al. (1998) that ELECTRE is one of the methods least similar to SAW, and that TOPSIS behaves more differently to ELECTRE. Considering the approach that belongs to each of the evaluated methods (SAW and TOPSIS from the utility based approach – American school, and ELECTRE III and PROMETHEE II from the outranking methods approach – French school), this result would be indeed expected. However, it is worth noting that the highest correlation value occurred between SAW and PROMETHEE II, followed by the correlation between TOPSIS and PROMETHEE II. It is also noteworthy that TODIM has no significant correlation with the other methods. This result had been previously reported by Moshkovich et al. (2012) for the comparison between the TODIM and SAW methods. It is possible that this difference is because the TODIM method differs significantly from the other ranking methods, for its structure is based on the principles of boundary rationality proposed by the Prospect Theory of Kahneman & Tversky (1979). In fact, risk aspects are not present in the decision matrix, making the evaluation of the matrix more adherent with the realm of certainty.
Some participants make comments regarding the use of the methods. One participant who had the independency condition rejected, stated that “all the rankings were similar and the first choice was the same”. For another participant in a similar condition of ranking dependency the com-mentary was: “I still prefer my initial ranking, but if I had the option to evaluate the alternatives for longer and more deeply, perhaps the methods made me change my mind”. It was revealed that four of the participants from the eight, who had the conditional of independency rejected, had had previous contact with MCDM methods, which might explain more coherency on the initial ranking proposal (evaluation of the matrix) with the MCDM ranking methods. In fact, Almeida (2013) states that knowledge of the MCDM methods is one of the key factors for suc-cess implementation.
T H E CHO ICE O F R A N K ING M U LT IP L E CRIT E RIA D E C IS IO N M A K ING M E T H O D S
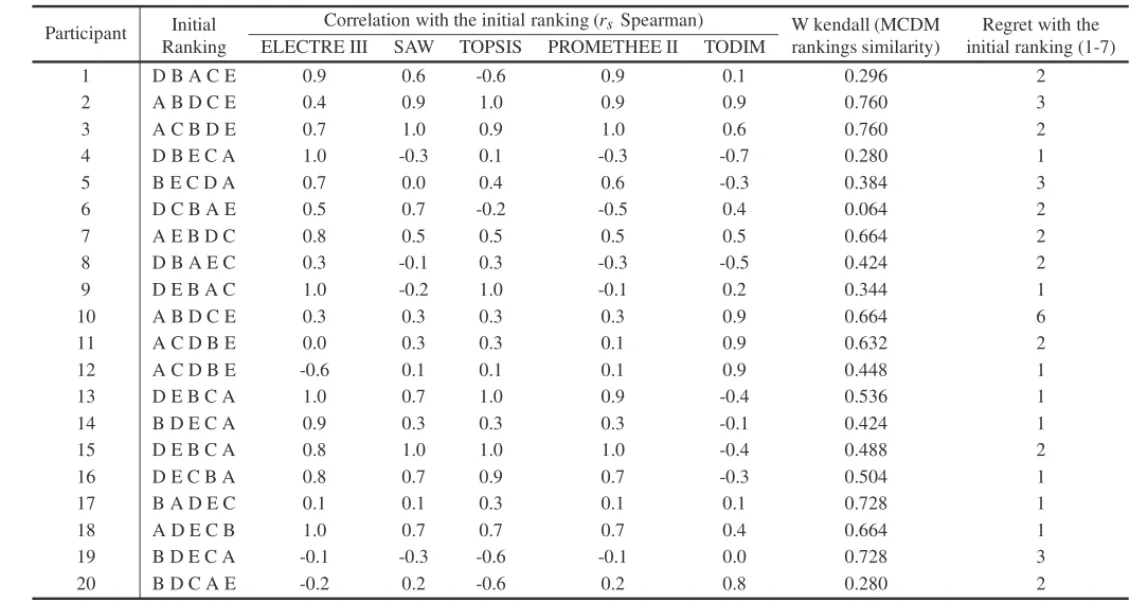
Table 4–Summary of the data used in the descriptive analysis.
Participant Initial Correlation with the initial ranking (rs Spearman) W kendall (MCDM Regret with the Ranking ELECTRE III SAW TOPSIS PROMETHEE II TODIM rankings similarity) initial ranking (1-7)
1 D B A C E 0.9 0.6 -0.6 0.9 0.1 0.296 2
2 A B D C E 0.4 0.9 1.0 0.9 0.9 0.760 3
3 A C B D E 0.7 1.0 0.9 1.0 0.6 0.760 2
4 D B E C A 1.0 -0.3 0.1 -0.3 -0.7 0.280 1
5 B E C D A 0.7 0.0 0.4 0.6 -0.3 0.384 3
6 D C B A E 0.5 0.7 -0.2 -0.5 0.4 0.064 2
7 A E B D C 0.8 0.5 0.5 0.5 0.5 0.664 2
8 D B A E C 0.3 -0.1 0.3 -0.3 -0.5 0.424 2
9 D E B A C 1.0 -0.2 1.0 -0.1 0.2 0.344 1
10 A B D C E 0.3 0.3 0.3 0.3 0.9 0.664 6
11 A C D B E 0.0 0.3 0.3 0.1 0.9 0.632 2
12 A C D B E -0.6 0.1 0.1 0.1 0.9 0.448 1
13 D E B C A 1.0 0.7 1.0 0.9 -0.4 0.536 1
14 B D E C A 0.9 0.3 0.3 0.3 -0.1 0.424 1
15 D E B C A 0.8 1.0 1.0 1.0 -0.4 0.488 2
16 D E C B A 0.8 0.7 0.9 0.7 -0.3 0.504 1
17 B A D E C 0.1 0.1 0.3 0.1 0.1 0.728 1
18 A D E C B 1.0 0.7 0.7 0.7 0.4 0.664 1
19 B D E C A -0.1 -0.3 -0.6 -0.1 0.0 0.728 3
20 B D C A E -0.2 0.2 -0.6 0.2 0.8 0.280 2
4.3 Ranking disagreement through sensitivity analysis
The participant chosen for ranking disagreement evaluation through sensitivity analysis was Par-ticipant 2, since he had the highest score for W Kendall (similar rankings from different MCDM ranking methods) and the stronger propensity for assuming the solutions provided by the MCDM ranking methods (higher value for initial ranking regret). The parameters for the sensitivity anal-ysis were the five criteria and alternatives from the decision matrix and the weighting vector was [0.079; 0.033; 0.054; 0.215; 0.152; 0.111; 0.016; 0.340], according to the weights calculated by the ROC method for Participant 2 in Table 2. Table 5 presents the results for Participant 2 for each MCDM ranking method using his weigh vector.
Table 5–Initial ranking, and MCDM rankings using the weigh vector of Participant 2. Ranking Initial ranking ELECTRE III SAW TOPSIS PROMETHEE II TODIM
1 ˚ A D A A A A
2 ˚ B A C B C C
3 ˚ D C D D D D
4 ˚ C B B C B B
5 ˚ E E E E E E
As noted in Table 5, even using the same decision matrix and weighting vector, the five methods showed different rankings and indicated different best alternatives. As expected, this variability is common to many MCDM ranking methods (Buede & Maxwell, 1995; Zanakis et al., 1998; Yeh, 2002). However, the value of W Kendall to Participant 2 was 0.760 (one of the highest found), which indicates high concordance among the MCDM ranking methods. Therefore, in order to test the stability of the rankings proposed by the methods, sensitivity analysis was carried out.
The first step of the sensitivity analysis was the random choice of a criterion. The second step was a change in the selected criterion by 20 % (more or less) and the recalculation of all relations with other criteria using Equation 3. The third step was the call of all methods in SANNA and the calculation of the TODIM method in its particular spreadsheet. Finally, the outputs were stored for all iterations, 100 in total. The sensitivity analysis lasted 14 minutes on an Intel Core 2 Duo of 2.93 Ghz with 3 GB of RAM memory. Figure 5 presents the average of correlation for each method among the hundred iterations with the rankings presented in Table 5 (MCDM rankings for Participant 2).
0,92 0,93 0,94 0,95 0,96 0,97 0,98 0,99 1
ELECTRE III SAW TOPSIS PROMETHEE II TODIM
Figure 5–Average correlation with the first MCDM ranking among the 100 iterations.
internal ranking inconsistency. Regarding the choice of the best alternative, only TOPSIS did not maintain the indication of the best alternative for all iterations, counting five changes of the best alternative for this method. This result is in accordance with those of Buede & Maxwell (1995). Therefore, although TOPSIS had good performance in descriptive analysis, it is subject to rank-ing disagreement. No method suffered from rankrank-ing reversal in this application experiment.
As with the conclusions of Gomes & Costa (2015) it is here pointed out that the decision maker should consider a different method solution to enhance his decision process for greater knowl-edge of the problem.
5 CONCLUSIONS
The study also aimed to assess common ranking problems in the use of MCDM ranking meth-ods. Considering that a significant part of these ranking problems are associated with the process of extracting decision makers’ preferences, a participant with the highest similar rankings was chosen for testing whether slight changes in his weighting vector would cause deviation in the solution of the different MCDM ranking methods. By means of sensitivity analysis it was found that TOPSIS and SAW presented internal ranking inconsistency. Therefore, although TOPSIS had good performance for predicting the initial ranking, it suffered considerable ranking dis-agreement, also presenting the problem of replacing the best alternative in some iterations. The reversibility problem did not occur for any method.
Although this research being an experimental study from which it is not appropriate to conduct general or universal inferences, the results demonstrate that the most common errors found in the literature regarding the use of MCDM ranking methods are easily found. Therefore, considering the results of this study and those found in the literature it is difficult to advocate the use of a unique MCDM ranking method for ranking alternatives. In this sense, this research is a warning for the choice of MCDM ranking methods. It is suggested that special care must be taken in the choice of ranking methods and, besides axiomatic comparisons, ranking comparisons could be a useful way to enhance the decision making process, since MCDM methods are tools for learning about the problem and do not prescribe solutions that necessarily translate to the real state of the world.
The use of spreadsheets or software that perform the calculations for different methods is rel-evant to reducing the impacts of such ranking inconsistency, such as the examples of software mentioned in this paper.
ACKNOWLEDGMENTS
The author acknowledges the helpful comments of three anonymous referees. Thanks also to John Carpenter, Ribeir˜ao Preto, SP, Brazil for the English revision.
REFERENCES
[1] ADAMSE & FAGOTR. 1958. A Model of Riskless Choice, Behavioral Science,3(4): 1–10. [2] ALMEIDAAT. 2013. Processo de Decis˜ao nas Organizac¸˜oes: Construindo modelos de decis˜ao
mul-ticrit´erio. Ed. Atlas: S˜ao Paulo. 2000.
[3] BANA ANDCOSTAC & VANSNICKJ. 1994. MACBETH – An Interactive Path Towards the Con-struction of Cardinal Value Functions. International Transactions In Operational Research, v. 1.
[4] BAKER D, BRIDGES D, HUNTER R, JOHNSON G, KRUPA J, MURPHY J & SORENSON K. 2001. Guidebook to Decision-Making Methods, Department of Energy, USA. Available in: <http://ckmportal.eclacpos.org/caribbean-digital-library/industrial-development/xfer-949>
[6] BRUNNERN & STARKLM. 2004. Decision aid systems for evaluating sustainability: a critical sur-vey. Environmental Impact Assessment Review,24: 441–469.
[7] BUEDEDM & MAXWELLDT. 1995. Rank Disagreement: A Comparison of Multi-criteria Method-ologies. Journal of Multi-Criteria Decision Analysis,4: 1–21.
[8] CHURCHMANCW & ACKOFFRL. 1954. An Approximate Measure of Value. Operational Research, v. 2.
[9] DIAZ-BALTEIROL & ROMEROC. 2008. Making forestry decisions with multiple criteria: A review and an assessment, Forest Ecology and Management, v. 255.
[10] DYERJS, FISHBURNPC, STEUERRE, WALLENIUSJ & ZIONTSS. 1992. Multiple Criteria Deci-sion Making, Multiattribute Utility Theory: The next ten years. Management Science,38(5): 645– 654.
[11] ENSSLINL, MONTIBELLERNETOG & NORONHASM. 2001. Apoio `a Decis˜ao: Metodologias para Estruturac¸˜ao de Problemas e Avaliac¸˜ao Multicrit´erio de Alternativas. Editora Insular.
[12] FIGUEIRAJR & ROYBERNARD. 2009. A note on the paper,“Ranking irregularities when evaluat-ing alternatives by usevaluat-ing some ELECTRE methods”, by Wang and Triantaphyllou, Omega (2008). Omega,37(3): 731–733.
[13] GOMESCFS & COSTAHG. 2015. Aplicac¸˜ao de m´etodos multicrit´erio ao problema de escolha de modelos de pagamento eletrˆonico por cart˜ao de cr´edito. Production Journal,25(1): 54–68.
[14] GOMESLFAM & LIMAMMPP. 1992. TODIM: basics and application to multicriteria ranking of projects with environmental impacts. Foundations of Computing and Decision Sciences,16(4): 113– 127.
[15] GOMESLFAM, GOMESCFS & ALMEIDAAT. 2006. Tomada de decis˜ao gerencial: Enfoque mul-ticrit´erio. 2. Ed. S˜ao Paulo: Atlas. 289 p.
[16] HAJKOWICZS & COLLINSK. 2007. A review of multiple criteria analysis for water resource plan-ning and management. Water Resources Management,21(9): 1553–1566.
[17] HWANGCL & YOONK. 1981. Multiple attribute decision making: methods and applications. New York, NY, USA: Springer.
[18] JABLONSKY´ J. 2009. MS Excel based system for multicriteria evaluation of alternatives. University of Economics Prague, Department of Econometrics, Available in:<http://nb.vse.cz/∼jablon/>
[19] KAHNEMAND & TVERSKYA. (1979). Prospect theory: An analysis of decision under risk. Econo-metrica,47: 263–292.
[20] KEENEYR & RAIFFAH. 1976. Decision with multiple objectives: preferences and value tradeoffs. Wiley, New York.
[21] LEONETI AB. 2014. Inconsistˆencias na classificac¸˜ao de alternativas em m´etodos multicrit´erios de apoio `a tomada de decis˜ao. In: XLVI Simp´osio Brasileiro de Pesquisa Operacional, 2014, Salvador. Anais do XLVI Simp´osio Brasileiro de Pesquisa Operacional.
[23] MARESCHALB. 1988. Weight stability intervals in multicriteria decision aid. European Journal of Operational Research,33(1): 54–64.
[24] MEIRELLES CLDA & GOMES LFAM. 2009. O apoio multicrit´erio `a decis˜ao como instrumento de gest˜ao do conhecimento: uma aplicac¸˜ao `a ind´ustria de refino de petr´oleo. Pesquisa Operacional, 29(2): 451–470.
[25] MORAISDC, CAVALCANTECAV & ALMEIDAATD. 2010. Priorizac¸˜ao de ´areas de controle de perdas em redes de distribuic¸˜ao de ´agua. Pesquisa Operacional,30(1): 15–32.
[26] MOSHKOVICHHM, GOMESLFAM, MECHITOVAI & RANGELLAD. 2012. Influence of models and scales on the ranking of multiattribute alternatives. Pesquisa Operacional.32(3): 523–542. [27] POHEKARSD & RAMACHANDRANM. 2004. Application of multi-criteria decision making to
sus-tainable energy planning – A review, Renewable and Sussus-tainable Energy Reviews,8(4): 365–381. [28] PORTORLL & AZEVEDOLGT. 1997. Sistemas de Suporte a Decis˜oes aplicados a problemas de
Recursos H´ıdricos. In: PORTORLL. (Org.). T´ecnicas quantitativas para o gerenciamento de Recur-sos H´ıdricos. Porto Alegre: Editora Universidade / UFRGS / Asssociac¸˜ao Brasileira de RecurRecur-sos H´ıdricos, p. 43–95.
[29] RANGELLAD, GOMESLFAM & CARDOSOFP. 2011. An application of the TODIM method to the evaluation of Broadband Internet plans. Pesquisa Operacional.31(2): 235–249.
[30] ROYB. 1968. Classement et choix en pr´esence de points de vue multiples: La m´ethode ELECTRE. Revue Francaise d’Informatique et de Recherche Op´erationnelle,2(1): 57–75.
[31] ROYB. 1985. Methodologie Multicritere d’Aide a la Decision, Economica. Economica, Paris.
[32] ROYB & BOUYSSOUD. 1993. Aide Multicrit`ere `a la D´ecision: M´ethodes et Cas. Economica.
[33] SAATYTL. 1980. The Analytic Hierarchy Process, New York, NY, USA: McGraw Hill.
[34] SIEGELS & CASTELLANJRNJ. 1988. Nonparametric Statistics for behavioral Sciencies. McGraw-Hill. 2nd edition. New York.
[35] TALLARICO MCF. 1990. Revers˜ao de ordem em alguns m´etodos multicriteriais de decis˜ao. Dissertac¸˜ao Mestrado. 1990. 127f. Dissertac¸˜ao (Mestrado em Engenharia Industria). Pontif´ıcia Uni-versidade Cat´olica do Rio de Janeiro. Departamento de Engenharia Industrial, Rio de Janeiro.
[36] WALLENIUSJ, DYERJS, FISHBURNPC, STEUERRE, ZIONTSS & DEBK. 2008. Multiple Criteria Decision Making, Multiattribute Utility Theory: Recent Accomplishments and What Lies Ahead. Management Science,54(7): 1336–1349.
[37] WANGX & TRIANTAPHYLLOUE. 2008. Ranking irregularities when evaluating alternatives by us-ing some ELECTRE methods. Omega,36: 45–63.
[38] YEHCH. 2002. A problem-based selection of multi-attribute decision-making methods. Intl. Trans. in Op. Res.9: 169–181.
[39] YOONK & HWANGCL. 1995. Multiple Attribute Decision Making: An Introduction. Sage Univer-sity Papers Series. Quantitative Applications in the Social Sciences.