Abstract— In this work, a refractometric fiber sensor for the liquid
fuels sector is described. The use of etched FBGs produced in multimode fibers is proposed to overcome the drawbacks associated with sensing high refractive index samples employing fiber transducers. The transducer sensitivity can be tailored by adjusting the final diameter of the etched Bragg grating. Due to a trade-off between the signal-to-noise ratio and the sensitivity, operational parameters of the sensor must be designed to match the expected refractive index dynamic range for specific applications. Metrological properties of the sensor are determined, resulting in resolution from 5.6 % v/v to 0.4 % v/v for refractive indexes ranging from 1.4562 to 1.4729. Specific applications regarding the quality assessment of biodiesel and conformity analysis of diesel-biodiesel blends are discussed.
Index Terms—Optical fiber transducer, chemical sensor, refractometric
sensor, biodiesel analysis.
I. INTRODUCTION
In recent years, the Brazilian government has increased incentives for the research and development
of renewable energy sources. Within this scenario, biodiesel plays an important role, as biofuel can
either be incorporated as part of or even replace diesel - the liquid fuel most produced,
commercialized and consumed in Brazil [1, 2]. Besides the renewability, biodiesel combustion brings
less impact to the environment than the use of other fossil fuels. From 2005 on, the addition of
biodiesel to diesel was mandatory and the biodiesel percentage in biodiesel-diesel blend has been
increased in the long run [3]. According to the Brazilian law number 13.033/2014, biodiesel
percentage in biodiesel-diesel blend commercialized in Brazil must reach 7 % until the end of 2014,
and in the following years it is expected to reach an upper limit of 27.5 %. As a new technology, its
production as well as quality and conformity monitoring still presents few methods and instruments to
assess standards, for both production and commercialization sectors [4 – 6].
The biodiesel is produced by a chemical reaction known as transesterification, with the conversion
of a fatty acid into an ester and generating glycerin as a by-product. Some authors [7, 8] showed that it
is possible to monitor the ester conversion by the determination of the sample refractive index. Such
possibility instigated studies about the performance of optical fiber devices as long period gratings
Etched FBG written in multimode fibers:
sensing characteristics and applications in the
liquid fuels sector
Raquel de Paiva Corotti, Juliana Thaler, Hypolito José Kalinowski, Marcia Muller, José Luís Fabris and Ricardo Canute Kamikawachi
(LPG) and LPG based interferometers to analyze biodiesel and biodiesel-diesel blends quality and
conformity, not only along the production but also during the commercialization stage [8 – 10].
Operation of this kind of sensor relies on the measurement of the sample refractive index, which may
indicate both the presence of remaining products from the transesterification reaction in biodiesel
samples and the percentage of biodiesel in biodiesel-diesel blend. However, an important setback for
the application of this sensing technology is the effective refractive index of the optical fiber cladding.
When the measurand is more refractive than the fiber cladding, LPG shows low sensitivity and the
interferometric transducer stops working properly. This limitation compromises the analysis of
biodiesel and biodiesel-diesel blends which refractive indexes are equal to or higher than the fiber
cladding one.
As attempts to work out such drawbacks, approaches taking advantage of samples thermo-optic
coefficients, employing the addition of low refractive index solvents to the sample or providing partial
immersion of the transducer, have been proposed [9]. An alternative solution not yet explored is the
use of cladding-less optical fiber transducers, as the core refractive index is higher than the fiber
cladding one. Such approach could make possible sensing samples more refractive than the cladding
of such fibers. In a recent work, Tsigaridas et al [11] showed the effective refractive index of a wet
etched single-mode fiber becomes more affected by the refractive index of the external medium as the
fiber radius decreases. This increase in the sensitivity is more noticeable when the etching process
evolves beyond the cladding-core boundary, however at expense of the fiber integrity and the light
guiding capability. Shivananju et al [12] showed that etched Fiber Bragg Gratings (FBG) could be
more effective than SPR (Surface Plasmon Resonance) based techniques, provided the etching
process is developed until the final fiber radius is 2 µm or less.
In this work, we propose the development and application of a fiber optic refractometric sensor
based on etched multimode instead of single-mode fiber, assuring the sensor operation without the
need for an auxiliary approach to guarantee the fiber integrity. The transducer comprises an etched
FBG written in a multimode fiber. Metrological characteristics of the proposed sensor are
demonstrated for application in the field of liquid fuels.
II. METHODOLOGY
Bragg gratings were written in multimode fiber (50 µm core, 125 µm cladding diameters) with an
excimer ArF laser (Coherent Xantos XS, at 193 nm) by direct exposition through a phase mask
(1075.5 µm pitch). Wet etching was employed to reduce the diameter of the fiber containing the FBG.
Cladding was gradually corroded by immersing the fiber in a hydrofluoric acid solution at 40%. After
reached the desired diameter, etching process was stopped by the subsequent immersion of the fiber in
a NaOH solution. FBGs were interrogated by an optical spectrum analyzer (OSA - Yokogawa
AQ6375, ± 5 pm of wavelength stability), by using an ASE as optical source and an optical circulator
microscopy (SEM – EVO MA 15, Carl Zeiss Microscopy).
For determining the etched-FBGs response curves and sensitivities to the external medium
refractive index at a temperature of (22.0 ± 1.0) °C, the device was immersed in samples containing
different proportions of water and glycerin. Glycerin concentration in samples ranged from 0.0 % to
100.0 % in steps of 10.0 % and uncertainty of 0.1 % v/v. In order to study the sensor ability to
quantify the presence of remaining vegetable oil in biodiesel, the device response curve was also
obtained in the presence of samples containing soybean oil and biodiesel in different proportions.
Concentrations of oil in the samples ranged from 0.0 % to 100.0 % in steps of 10.0 % and 0.1 % v/v
of uncertainty. Grating response curve results from five measurements done under reproducibility
conditions. Samples refractive indexes were measured with an Abbe refractometer (Atago DR-A1, 0.5
x 10-4 resolution operating at sodium D line 543.5 nm).
III. RESULTS AND DISCUSSIONS
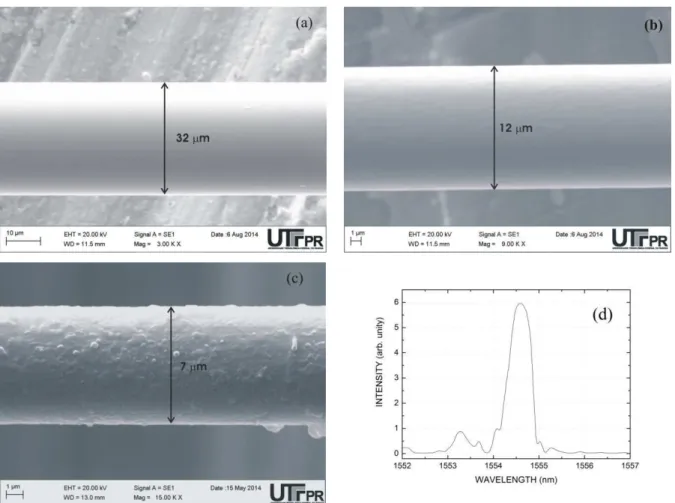
Figures 1 (a), (b) and (c) show images obtained with SEM for three produced etched FBGs with
final diameters of 32 µm, 12 µm and 7 µm. Figure 1 (d) shows FBG reflection spectrum for fiber with
diameter of 32 µm, when the sample containing 0.00 % of glycerin and 100.00 % of water (1.3328
refractive index at 22.0 °C) is the external medium.
Fig. 1. SEM images of etched FBGs with diameter of: (a) 32 µm, (b) 12 µm and (c) 7 µm; (d) Reflection spectrum of FBG with fiber diameter of 32 µm in water.
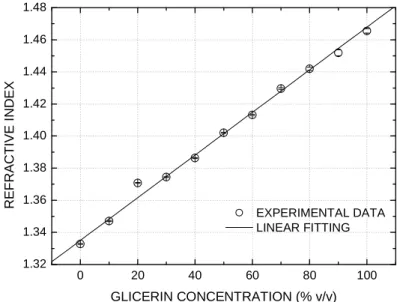
refractometer. Experimental data provide a linear response curve from 1.3328 (100 % water) to about
1.4656 (100 % glycerin) with a slope of (1.330 ± 0.005) x 10-4 % v/v-1.
0 20 40 60 80 100
1.32 1.34 1.36 1.38 1.40 1.42 1.44 1.46 1.48 R E F R A C T IV E I N D E X
GLICERIN CONCENTRATION (% v/v)
EXPERIMENTAL DATA LINEAR FITTING
Fig. 2. Refractive index of water-glycerin samples at 22.0 °C.
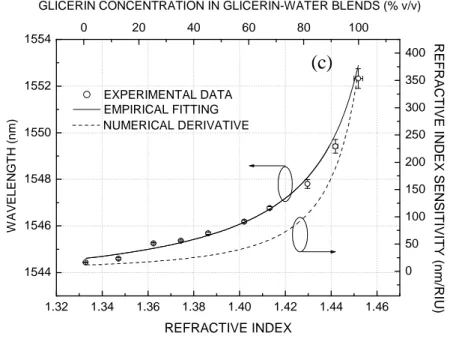
Etched FBGs sensitivities to the external medium refractive index were obtained from the gratings
responses to the water-glycerin samples. Response curves (left axis) and sensitivities (right axis) are
presented in Figure 3 (a), (b) and (c). Solid curves depict the best fittings to the empirical equation
(1):
=
−
( )
(1)
where n is the external medium (water-glycerin samples) refractive index and a1, a2 and a3 are the
fitting parameters given in Table I.
1.32 1.34 1.36 1.38 1.40 1.42 1.44 1.46 1.48 1554.55 1554.60 1554.65 1554.70 1554.75 1554.80 1554.85 1554.90
0 20 40 60 80 100
W A V E L E N G T H ( n m ) REFRACTIVE INDEX EXPERIMENTAL DATA EMPRICAL FITTING 0 2 4 6 8 R E F R A C T IV E IN D E X S E N S IT IV IT Y ( n m /R IU ) NUMERICAL DERIVATIVE (a)
GLICERIN CONCENTRATION IN GLICERIN-WATER BLENDS (% v/v)
1.32 1.34 1.36 1.38 1.40 1.42 1.44 1.46 1.48 1543 1544 1545 1546 1547 1548 1549 1550 1551
0 20 40 60 80 100
0 20 40 60 80 100 120 140 160 180 RE
F R A C T IV E IN D E X S E N S IT IV IT Y ( n m /R IU ) NUMERICAL DERIVATIVE W A V E L E N G T H ( n m ) REFRACTIVE INDEX EXPERIMENTAL DATA
EMPIRICAL FITTING (b)
1.32 1.34 1.36 1.38 1.40 1.42 1.44 1.46 1544
1546 1548 1550 1552
1554 0 20 40 60 80 100
W
A
V
E
L
E
N
G
T
H
(
n
m
)
REFRACTIVE INDEX
EXPERIMENTAL DATA EMPIRICAL FITTING
0 50 100 150 200 250 300 350 400
R
E
F
R
A
C
T
IV
E
IN
D
E
X
S
E
N
S
IT
IV
IT
Y
(
n
m
/R
IU
)
NUMERICAL DERIVATIVE
(c)
GLICERIN CONCENTRATION IN GLICERIN-WATER BLENDS (% v/v)
Fig. 3. FBG response curve (left) and refractive index sensitivity (right) as function of the external medium refractive index for fiber diameter of: (a) 32 µm, (b) 12 µm and (c) 7 µm.
Dashed curves represent gratings sensitivities to the external refractive index, obtained by
numerical derivative of the fitted response curves.
For the FBG with diameter of 7 µm, Figure 3(c), uncertainties in the Bragg wavelength position are
larger for samples with glycerin concentration of 70%, 80% or 90% (± 0.18, ±0.29 and ± 0.42
respectively) than for the other concentrations. Such feature is noticed for FBG with diameter of 12
µm, Figure 3 (b), just for concentrations close to 90 % (± 0.49 nm uncertainty).
TABLE I.FITTING PARAMETERS OF EQUATION (1) FOR FIGURES 3(a),(b) AND (c)
Fiber diameter (µm) a1 (nm) a2 (nm) a3
32 1545.54 ± 0.01 -0.003 ± 0.001 1.5739 ± 0.0368 12 1542.13 ± 0.19 -0.312 ± 0.031 1.5075 ± 0.0035 7 1543.05 ± 0.18 -0.216 ± 0.018 1.4734 ± 0.0016
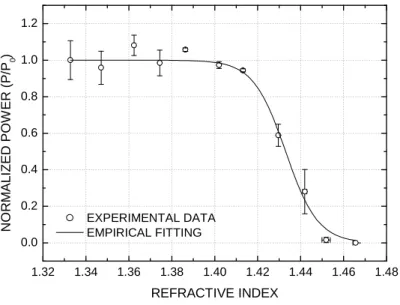
When the refractive index of the external medium increases toward the fiber core one, both fiber
guiding capability and transmitted power decrease accounting for large uncertainties. The degradation
in the signal-to-noise ratio (SNR) becomes more restrictive for sensing purposes as the fiber radius
decreases. Figure 4 shows the normalized power reflected by the FBG with diameter of 7 µm
1.32 1.34 1.36 1.38 1.40 1.42 1.44 1.46 1.48 0.0
0.2 0.4 0.6 0.8 1.0 1.2
N
O
R
M
A
L
IZ
E
D
P
O
W
E
R
(
P
/P
0
)
REFRACTIVE INDEX
EXPERIMENTAL DATA EMPIRICAL FITTING
Fig. 4. reflected power for the FBG with 7 µm of diameter as a function of the external medium refractive index.
Another feature that can be responsible for the degradation of the signal-to-noise ratio (SNR) when
the glycerin concentration is close to 90 % is the appearance of adjacent modes in the FBG reflection
spectrum. This behavior can be observed by comparing spectra of figures 5 (a) and (b) obtained for
the FBG with diameter of 7 µm immersed in external media with refractive indexes of 1.3328 (100%
water) and 1.4729 (90% glycerin), respectively. The same behavior was observed for the FBG with
diameter of 12 µm.
1538 1540 1542 1544 1546 1548 1550 0.0
0.2 0.4 0.6
(a)
IN
T
E
N
S
IT
Y
(
a
rb
.
u
n
it
y
)
WAVELENGTH (nm)
1544 1546 1548 1550 1552 1554
0.004 0.005 0.006 0.007 0.008 0.009 0.010
adjacent modes
(b)
IN
T
EN
SI
T
Y
(a
rb
.
u
n
it
y
)
WAVELENGTH (nm)
Fig. 5 Reflection spectra for FBG with diameter of 7 µ m, when the external medium refractive index is (a) 1.3328 (100% water) and (b) 1.4512 (90 % glycerin).
No signal degradation was observed for the FBG with diameter of 32 µm within the whole
refractive index dynamic range associated with water-glycerin blends. Such characteristic allows
employing this FBG for sensing samples as soybean oil-biodiesel blends, which present high
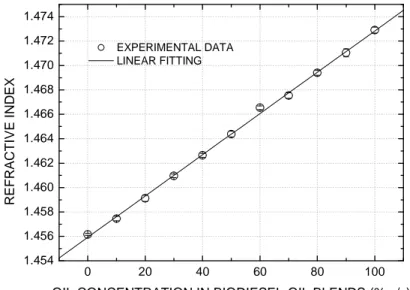
Figure 6 shows the refractive indexes of oil-biodiesel blends at 22.0 °C. Sample refractive index
increases with the oil concentration in the blend from 1.4562 (100 % biodiesel) to 1.4729 (100 % oil)
at a constant rate of (1.690 ± 0.020) x 10-4 (% v/v)-1.
0 20 40 60 80 100
1.454 1.456 1.458 1.460 1.462 1.464 1.466 1.468 1.470 1.472 1.474 R E F R A C T IV E I N D E X
OIL CONCENTRATION IN BIODIESEL-OIL BLENDS (% v/v)
EXPERIMENTAL DATA LINEAR FITTING
Fig. 6 Refractive indexes of oil-biodiesel blends at 22.0 °C.
The response of the FBG with diameter of 32 µm for oil-biodiesel blends is presented in figure 7(a).
Sensor calibration curve (solid curve) relates to a second order polynomial fitting. Sensor sensitivity
curve obtained from the derivative of calibration curve (solid line) as well as the sensor resolution
(dotted curve) obtained from the division of OSA wavelength stability by the sensitivity curve are
shown in figure 7 (b).
0 10 20 30 40 50 60 70
1554.70 1554.75 1554.80 1554.85 1554.90 1554.95 1555.00 (a) W A V E L E N G T H ( n m )
OIL CONCENTRATION IN BIODIESEL-OIL BLENDS(% v/v) EXPERIMENTAL DATA
POLYNOMIAL FITTING
0 10 20 30 40 50 60 70
0.000 0.001 0.002 0.003 0.004 0.005 0.006 0.007 0.008 0 1 2 3 4 5 6 S E N S IT IV IT Y ( n m / % v /v )
OIL CONCENTRATION IN BIODIESEL-OIL BLENDS (%v/v)
(b) R E S O L U T IO N ( % v /v )
Fig. 7(a) Calibration curve of the sensor based on an FBG with diameter of 32 µm, and (b) sensor sensitivity (left axis) and resolution (right axis).
From the sensor resolution curve, it is inferred that the device is not able to determine oil
concentrations smaller than 30 % v/v with resolution less than 1 % v/v. Such characteristic makes the
sensor not adequate to assess the biodiesel quality regarding the presence of residual oil in the final
product. On the other hand, for oil concentrations above 30 %, oil concentration can be determined
(1.4729), biodiesel-diesel and biodiesel-oil blends show similar refractive indexes for equivalent
constituent proportions. These features allow determining large amounts of oil in biodiesel and,
markedly, suggest the use of the sensor in the conformity assessment of biodiesel-diesel fuel to be
commercialized in Brazil. Metrological characteristics of the proposed sensor are presented in
Table II [13].
TABLE II.METROLOGICAL CHARACTERISTICS OF THE PROPOSED SENSOR
Metrological Characteristic (%v/v)
Oil Concentration 70%
Resolution 0.40
Reproducibility 2.02
Conformity 0.64
Combined Uncertainty 2.15
IV. CONCLUSIONS
The results obtained in this work show that chemically etched FBG produced in multimode fiber
presents high potential to be employed as sensor for highly refractive fuels. Lower diameter FBGs are
more sensitive and suitable for high resolution sensors, but the degradation in the SNR, mainly caused
by the strong attenuation in the guided optical signal, decreases the upper limit of the refractive index
dynamic range. As a result, these devices are more adequate for quality assessment of biodiesel
concerning to the presence of remaining vegetable oil in biodiesel.
On the other hand, higher diameters FBGs present lower sensitivity, despite being effective
transducers with expanded upper limit in the refractive index dynamic range, only accessible
nowadays by means of auxiliary techniques. Its use is more adequate for conformity analysis of
diesel-biodiesel blends.
As the transducer was produced in a multimode-fiber, the cladding reduction by chemical etching
did not impair its robustness. The sensor head was employed under laboratory conditions for three
months without reduction of its mechanical strength.
ACKNOWLEDGMENT
The authors thank FINEP, CAPES, CNPq and Fundação Araucária (Brazilian Agencies) for
scholarships and funding support. FBGs were fabricated at the Photo Refractive Devices Unit of
Federal University of Technology - Paraná, associated laboratory of INCT Fotonicom.
REFERENCES
[1] L. A. H. Nogueira, B. Pikman, “Biodiesel: as novas perspectivas de sustentabilidade”, ANP Informe conjuntura &
Informação, vol. 19, pp. 1-4, 2002.
[2] ANP Agência Nacional do Petróleo, Gás Natural e Biocombustíveis – Brasil, Anuário Estatístico Brasileiro do
Petróleo, Gás Natural e Biocombustíveis, 2012.
[3] http://www2.camara.leg.br/legin/fed/lei/2014/lei-13033-24-setembro-2014-779372-publicacaooriginal-1450.
[4] L. L. Guarieiro, M. N. Ribeiro, A. C. Pinto, “Desenvolvimento de metodologias para a quantificação das misturas
[5] R. C. M. Faria, M. J. C. Rezende, A. C. Pinto, “Quantificação das misturas Biodiesel:Diesel: Desenvolvimento,
Validação e Aplicação de uma nova metodologia Empregando Cromatografia Gasosa-Espectrometria de Massas”, in 4º
Congresso Brasileiro de P&D em Petróleo e Gás Natural, 8.4.0057, pp.1-10, 2007.
[6] F. P. Fagundes, A. S. Silva, S. R. O. Souto, R. B. Garcia, M. Costa, “Utilização de Técnicas Espectroscópicas na
Determinação do Percentual do Biodiesel em Misturas Binárias com o Diesel”, in 4º Congresso Brasileiro de P&D em
Petróleo e Gás Natural, 4.4.0413, pp.1-9, 2007.
[7] W.L. Xie and H.T. Li “Hydroxyl content and refractive index determinations on transesterified soybean oil”, Journal of
the American Oil Chemists' Society, vol. 83, pp. 869–872, 2006.
[8] R. Falate, K. Nike, P. R. C. Neto, E, Cação Jr., M Muller, H. J. Kalinowski, J. L. Fabris, “Alternative technique for
biodiesel quality control using an optical fiber long-period grating sensor”, Química Nova, v. 30, p. 1677-1680, 2007.
[9] M. S. Kawano, B. R. Heidemann, T. K. M. Cardoso, G. R. C. Possetti, R. C. Kamikawachi, M. Muller, J. L. Fabris,
“Tailoring fiber grating sensors for assessment of highly refractive fuels”, Applied Optics, v. 51, p. 2015-2022, 2012.
[10]G. R. C. Possetti, R. C. Kamikawachi, M. Muller, J. L. Fabris, “Optical fiber sensor temperature coded for
concentration measurement of oil-biodiesel blends”, Optical Fiber Technology, v. 19, p. 543-548, 2013.
[11]G. Tsigaridas, D. Polyzos, A. Ioannou, M. Fakis, P. Persephonis, “Theoretical and experimental study of refractive
index sensors basedon etched fiber Bragg gratings”, Sensors and Actuators A, vol. 209, pp. 9-15, 2014.
[12]B. N. Shivananju, M. Renilkumar, G. R. Prashanth, S. Asokan, and M. M. Varma, “Detection Limit of Etched Fiber
Bragg Grating Sensors”, Jounal of Lightwave Technology, vol. 31, pp. 2441-2447, 2013.
[13]G. R. C. Possetti, R. C Kamikawachi, M. Muller and J. L. Fabris, "Metrological evaluation of optical fiber