www.atmos-meas-tech.net/9/553/2016/ doi:10.5194/amt-9-553-2016
© Author(s) 2016. CC Attribution 3.0 License.
A two-channel thermal dissociation cavity ring-down spectrometer
for the detection of ambient NO
2
, RO
2
NO
2
and RONO
2
J. Thieser1, G. Schuster1, J. Schuladen1, G. J. Phillips1,a, A. Reiffs1, U. Parchatka1, D. Pöhler2, J. Lelieveld1, and J. N. Crowley1
1Max-Planck-Institut für Chemie, Division of Atmospheric Chemistry, Mainz, Germany 2Institute of Environmental Physics, University of Heidelberg, Heidelberg, Germany anow at: Department of Natural Sciences, University of Chester, Chester, UK
Correspondence to:J. N. Crowley ([email protected])
Received: 23 September 2015 – Published in Atmos. Meas. Tech. Discuss.: 3 November 2015 Revised: 4 January 2016 – Accepted: 28 January 2016 – Published: 17 February 2016
Abstract. We describe a thermal dissociation cavity ring-down spectrometer (TD-CRDS) for measurement of ambi-ent NO2, total peroxy nitrates (6PNs) and total alkyl nitrates
(6ANs). The spectrometer has two separate cavities operat-ing at∼405.2 and 408.5 nm. One cavity (reference) samples NO2continuously from an inlet at ambient temperature, the
other samples sequentially from an inlet at 473 K in which PNs are converted to NO2or from an inlet at 723 K in which
both PNs and ANs are converted to NO2, difference signals
being used to derive mixing ratios of6PNs and6ANs. We describe an extensive set of laboratory experiments and nu-merical simulations to characterise the fate of organic rad-icals in the hot inlets and cavity and derive correction fac-tors to account for the bias resulting from the interaction of peroxy radicals with ambient NO and NO2. Finally, we
present the first measurements and comparison with other in-struments during a field campaign, outline the limitations of the present instrument and provide an outlook for future im-provements.
1 Introduction
Reactive nitrogen oxides are centrally important trace gases in atmospheric chemistry as they affect air quality, climate and ecosystem nutrients. Nitrogen oxides are involved in the photochemical production/loss of ozone (O3); they interact
with ROxradicals (ROx≡OH+HO2+RO2, where R is an
organic fragment) to either catalyse ozone formation or ter-minate the HOx catalytic chain and thereby suppress ozone
formation. Nitrogen oxides are largely emitted to the atmo-sphere as NO which is then oxidised to NO2. Beside
inor-ganic NOx (NOx≡NO+NO2)there are several classes of
organic nitrogen oxides including peroxy nitrates (RO2NO2)
and alkyl nitrates (RONO2)which have an important
influ-ence on atmospheric composition. Peroxy nitrates and alkyl nitrates are produced as by-products in the photochemical oxidation of volatile organic compounds (VOCs) in the pres-ence of NOx, the same processes and reactions that produce
the pollutant and greenhouse gas ozone. In addition to be-ing indicators of photochemical ozone production, organic nitrates exert a direct influence on regional ozone levels and can have a large impact on the global distribution of NOxand
thus ozone (Singh and Hanst, 1981; Roberts, 1990).
Peroxy nitrates are formed in the reaction of RO2 with
NO2 (Reaction R1) and their lifetime with respect to
ther-mal decomposition (Reaction R2) is strongly temperature-dependent.
RO2+NO2+M→RO2NO2+M (R1)
RO2NO2+M→RO2+NO2+M (R2)
Peroxy nitrates such as peroxyacetic nitric anhydride (PAN, CH3C(O)O2NO2), which possess an acyl group adjacent to
the peroxy group, have thermal decomposition lifetimes that vary from less than an hour at the surface at temperatures close to 295 K, to more than a month at the low temperature of e.g. the upper troposphere. Consequently, peroxyacetic ni-tric anhydrides are important reservoirs of NOx and
HO2NO2or CH3O2NO2)are much shorter lived and are only
found in significant abundance in cold regions of the tropo-sphere such as in the Antarctic boundary layer (Slusher et al., 2002) and the upper troposphere (Murphy et al., 2004; Kim et al., 2007; Browne et al., 2011; Nault et al., 2015). In the lowermost troposphere, other losses of RO2NO2such as
photolysis or reaction with OH are vastly reduced in impor-tance compared to thermal decomposition (Talukdar et al., 1995). Throughout this paper, we use the term “PN” to refer to peroxy nitrates.
During daytime, alkyl nitrates (RONO2)are formed in a
minor branch of the reaction between organic peroxy radi-cals (RO2)and NO (Reaction R3). The dominant reaction
channel (Reaction R4) leads to the formation of NO2 and
therefore (via its photolysis) to ozone.
RO2+NO+M→RONO2+M (R3)
RO2+NO→RO+NO2 (R4)
The fractional flux through Reaction (R3) (relative to Reac-tions R3 and R4) depends on the carbon chain and also the pressure and temperature and can vary from very low values (< 2 %) for small hydrocarbons to > 50 % for longer chain hydrocarbons such as heptane (Lee et al., 2014).
Alkyl nitrates can also be formed at night in the NO3
-induced degradation of unsaturated VOCs, which proceeds via addition of NO3across the double bond to form (in the
presence of O2)a nitrooxyalkyl peroxy radical that can
fur-ther react to form an alkyl nitrate with e.g. hydroxyl or car-bonyl groups:
NO3+R=R(+O2)→R′RONO2. (R5)
Yields of alkyl nitrates from these reactions can be large, es-pecially for biogenic organics such as isoprene or terpenes (Atkinson and Arey, 2003). Hereafter, we use the term “AN” to refer to alkyl nitrates, irrespective of their mode of gener-ation.
ANs which do not contain double bonds or hydroxyl groups generally have a low affinity for surfaces and react only slowly with oxidants such as OH (Talukdar et al., 1997) so that they can sequester a significant fraction of reactive nitrogen (Perring et al., 2013).
The organic nitrate content of ambient air comprises a mixture of many structurally distinct compounds in gener-ally low individual abundance, which makes their quantita-tive determination challenging. Organic nitrates have been measured on many occasions using gas chromatography. The advantage of this technique is a limit of detection of a few parts per trillion volume (pptv) and the possibility to distin-guish between individual organic nitrates (see e.g. Roberts et al., 2003). The disadvantages are the requirement of calibra-tion for many trace gases (usually not commercially avail-able) and low time resolution (Hao et al., 1994; Flocke et al., 2005). Recently, PAN and other peroxycarboxylic nitric
anhydrides such as MPAN (peroxymethacrylic nitric anhy-dride) and PPN (peroxypropionic nitric anhyanhy-dride) have been identified and measured with sub-second time resolution us-ing thermal dissociation chemical ionisation mass spectrom-etry (TD-CIMS) (Slusher et al., 2004; LaFranchi et al., 2009; Wolfe et al., 2009; Roiger et al., 2011; Zheng et al., 2011; Mielke and Osthoff, 2012; Phillips et al., 2013).
The first measurements of alkyl nitrates in the atmosphere were made by Atlas et al. (1988), and subsequent calcu-lations and measurements suggested that the atmosphere should contain a wide suite of individual alkyl and multi-functional nitrates (Calvert and Madronich, 1987; Atherton and Penner, 1988; Schneider and Ballschmiter, 1999) and that hydroxy alkyl nitrates derived from isoprene oxidation could constitute as much as 12–26 % of tropospheric NOy
(Trainer et al., 1991). Recent measurement of speciated ANs by chemical ionisation mass spectrometry (Beaver et al., 2012) has shown that biogenic derived ANs may represent a substantial fraction of the total AN mixture.
Total measured NOy has frequently been found
to exceed the sums of different nitrogen com-pounds (NO+NO2+PAN+HNO3+HONO+NO3+
2N2O5+. . .), the range of the “missing” NOy being 10–
20 %. In most of these observations the total alkyl nitrate content was not measured or only partially (e.g. Fahey et al., 1986; Buhr et al., 1990; Ridley et al., 1990; Parrish and Buhr, 1993; Singh et al., 1996; Williams et al., 1997). These considerations led to the development of instruments (Day et al., 2002) which make use of the thermal instability of RO2NO2 and RONO2 at elevated temperatures and which
report measurements of the sum of peroxy nitrates (6PN) or the sum of alkyl nitrates (6AN) by monitoring the NO2
product of the thermal decomposition of PNs and ANs at different temperatures.
RO2NO2→RO2+NO2(>420 K) (R6)
RONO2→RO+NO2(>630 K) (R7)
These studies have helped to confirm that ANs and PNs rep-resent a significant fraction of atmospheric NOyand confirm
their role in e.g. HOx radical chain termination, or as
indi-cators of photochemical O3generation (see e.g. Day et al.,
2003; Rosen et al., 2004; Perring et al., 2013).
Here we describe a recently constructed TD-CRD instru-ment to measure ambient NO2and also that formed from the
thermal decomposition of ANs and PNs via cavity ring-down spectroscopy. Our instrument operates under similar condi-tions of pressure flow, oven temperature and laser wavelength to those described in Paul et al. (2009) and Paul and Os-thoff (2010).
2 Principal of Operation and Instrument set-up
been reviewed in detail (Berden et al., 2000; Brown, 2003). CRDS is based on direct absorption spectroscopy in which the absorption path length is enhanced by a high finesse cav-ity formed by a set of two highly reflective mirrors. Most applications use pulsed or intensity-modulated continuous-wave (CW) lasers as a light source with direct coupling into the cavity via one (front) mirror. The present experiment uses a square-wave, on/off-modulated CW laser. During the “laser on” phase the light intensity in the cavity builds up to a level determined by mirror reflectivity and transmission. The light leaking out through the back mirror during “laser off” mode is analysed to derive an exponential decay constant, which is reduced in the presence of an absorbing or scattering gas. This provides an absolute measurement of optical extinction, as given in Eq. (1).
σ[A]=α= l cd
1 τ −
1 τ0
, (1)
whereσ is the absorption cross section of the absorber, av-eraged over the laser spectrum, [A]is the concentration of the absorber, αis the optical extinction coefficient (units of inverse length),cis the speed of light,τ andτ0are the
ex-ponential decay constants with and without the absorber in the cavity and l/d is the ratio of the length over which the absorber is present to the distance between the two resonator mirrors. In order to deriveτ0the cavity is flushed with zero
air (see Sect. 2.1.1).
Essential features of the TD-CRDS instrument described here are displayed in Fig. 1. Our two-channel CRDS utilises two laser diodes (Laser Components, optical power: 120 mW) in commercially available laser diode heads (Thor-labs) with current and temperature controller units (Thorlabs ITC 510 and ITC 502). The use of two lasers rather than one increases the light intensity at the detector and thus improves the signal-to-noise ratio, but brings with it the added com-plexity of needing to measure two-laser spectra (see below) and using two different NO2absorption cross sections.
The lasers are modulated on and off at 1666 Hz (duty cy-cle 50 %) by a 6 V square-wave signal. The rise and fall time of the intensity is less than 1 µs, which, under normal con-ditions (NO2< 1 ppm), is rapid on the timescale of the
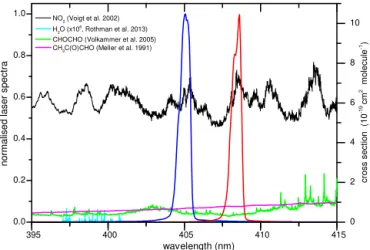
de-cay of intensity from the optical cavities. Optical isolators (consisting of a linear polariser and a quarter-wave plate) are used to prevent back reflections from the front mirror from entering the lasers. The laser diodes are stabilised at about 40◦C and about 50◦C resulting in wavelengths centred at about 405.2 and 408.5 nm, respectively. The laser emission is monitored at regular intervals by coupling weak specular reflection from either of the front mirrors via an optical fibre into a spectrometer (∼0.1 nm resolution, OMT, temperature-regulated CCD detector with 3648 pixels). Small variations in the laser wavelength are observed (peak-to-peak variabil-ity of < 2 % over consecutive, 10 min averaging intervals), which result in the same variability of the effective absorp-tion cross secabsorp-tion. Figure 2 shows the laser emission
spec-tra (blue and red) along with the NO2absorption spectrum
(black line, righty axis, (Voigt et al., 2002). The relatively broad laser emission ensures the passive mode matches with resonant frequencies of the cavity, avoiding the need for ac-tive mode-matching (Ayers et al., 2005). Effecac-tive absorption cross sections were obtained by multiplying the normalised laser emission spectra by the structured absorption of NO2.
The cavity mirrors (1 inch diameter, 1 m radius of curva-ture) have a nominal reflectivity of 0.999965 (Advanced Thin Films). The mirrors are mounted in a self-made mirror holder system, the ∼70 cm distance between them being rigidly fixed using three hollow carbon fibre rods (outer diameter 15 mm) per cavity. This combination of mirror reflectivity and separation results in ring-down times under typical con-ditions (830 mbar air) of aboutτ0=38 µs when no absorber
is present, or optical path lengths of > 10 km. A purge flow, 100 cm3(STP) min−1(hereafter sccm), of zero air protects
each mirror from contamination by ambient air and subse-quent loss of reflectivity.
The light transmitted through the back mirror of the cavity is detected by a photomultiplier, located behind a lens and an interference filter (10 nm full width at half maximum height centred at 405 nm) to reject stray light. The preamplified sig-nal is digitised by a USB digital oscilloscope (PicoScope 3000, 12 bit vertical resolution, 5 Mhz sampling rate), with 1344 ring-down traces being averaged in order to achieve the desired signal-to-noise ratio. This number results from min-imising read-out time from the PicoScope by measuring se-quential 42 ring-down traces (filling internal memory) before reading out the data. This cycle is repeated 32 times, result-ing in a time resolution of about 4 s per data point for both channels.
The two-channel CRDS consists of two nominally iden-tical cavities (both thermostatted to 308 K) and sample in-lets. The cavities are made of 10 mm inner diameter Duran glass, which was coated with a thin film of Teflon (DuPont, FEP TE9568) to minimise interaction of traces gases with the walls, which could potentially result in loss or produc-tion of NO2. Aerosols are prevented from entering the inlets
and cavities using a 47 mm diameter, 2 µm PTFE filter (PAL Teflon).
The cavities are operated at sub-ambient pressure (typi-cally 800–850 mbar) which is held constant using an addi-tional, mass-flow-controlled branch, linking the inlet mani-fold to a pump. This line also contains a relative humidity and temperature sensor to enable corrections for laser light scattering by H2O vapour to be made (see Sect. 2.1.3).
Am-bient air enters the centre of the cavities at a flow rate of 2.0 L min−1(STP) in each channel, resulting in a cavity resi-dence time of about 1.2 s. However, as concentrations are in-tegrated over the entire cavity length, the average residence time of a molecule of detected in the cavity will be less than this.
Values ofτ0 were obtained at regular intervals (every 5–
pe-Figure 1.Schematic diagram of the two cavities (reference and TD) and associated inlets (quartz tubes at ambient temperature, 473 or 723 K). The reference cavity samples continuously via a quartz tube at ambient temperature, the TD cavity samples sequentially from quartz tubing at ambient temperature, 473 or 723 K. Both cavities are held at 308 K and at constant pressure (usually 800 mbar). M: mirror, WP: quarter-wave plate, Pol: polariser, QT: quartz tubing, P: pressure transducer, FC: mass flow controller, PC: computer, RH: relative humidity and temperature sensor, IF: interference filter, PMT: photomultiplier, PG: purge gas, Ex: exhaust.
395 400 405 410 415
0 2 4 6 8 10
NO
2 (Voigt et al. 2002)
H2O (x10
6, Rothman et al. 2013)
CHOCHO (Volkammer et al. 2005)
CH3C(O)CHO (Meller et al. 1991)
c
ro
s
s
s
e
c
ti
o
n
(1
0
-1
9c
m
2
m
o
le
c
u
le
-1)
wavelength (nm) 0.0
0.2 0.4 0.6 0.8 1.0
n
o
rm
a
li
e
d
l
a
s
e
r
s
p
e
c
tr
a
s
Figure 2.Laser emission spectrum (leftyaxis) measured in the ref-erence cavity (blue) and the TD cavity (red). The absorption spec-tra (Meller et al., 1991; Voigt et al., 2002; Volkamer et al., 2005b; Rothman et al., 2013) are associated with the rightyaxis. The H2O
spectrum is scaled by a factor of 1×10⁶.
riod (1–2 min). Three-way Teflon valves (NResearch) which have been shown not to permanently remove PNs, ANs or NO2were used. This frequency of zeroing was found to be
sufficient to track drifts in the ring-down constant (see later). One of the cavities (reference cavity in Fig. 1) continu-ously measures ambient NO2; the second cavity (TD cavity)
samples alternatively from three separate, quartz tubes of i.d. 1.5 cm and length 42 cm. Fifteen centimetre sections of two of the quartz tubes were placed in commercial ovens
(Car-bolite) and heated up to 473 and 723 K, whereby these are oven temperatures and do not necessarily reflect the temper-ature of gas flowing through the quartz tubing. The cavity attached to the heated quartz inlets thus measures the sum of NO2plus NO2generated from the thermal dissociation of
or-ganic nitrates. We refer to the NO2measurements when
sam-pling from these inlets as [NO2]ref, [NO2]TD, [NO2]TD 473
and [NO2]TD 723.
The strength of the NO2 bond within the parent
com-pound defines the temperature at which thermal dissociation (to form NO2)is feasible. The ROO–NO2bond strengths for
peroxy nitrates lie between∼85 and 115 kJ mol−1(Kirchner
et al., 1999) which is significantly weaker than the RO–NO2
bond strength for alkyl nitrates (160–170 kJ mol−1, Roberts, 1990). For comparison, the HO–NO2bond strength for
ni-tric acid is∼200 kJ mol−1 (Atkinson et al., 2004). As dis-cussed by Day et al. (2002) efficient thermal dissociation to NO2 occurs at temperatures > 420 K for peroxy nitrates,
> 630 K for alkyl nitrates and > 900 K for HNO3. Based on
purely thermodynamic considerations, and following Day et al. (2002), we do not expect to convert significant amounts of HNO3 to NO2 in either of our inlets. However, the
re-cent data set of Wild et al. (2014) indicates that in their in-let at 723 K, substantial decomposition (∼70 %) of HNO3to
NO2takes place. As HNO3is a significant and highly
vari-able fraction of boundary-layer NOy, this may represent a
potential artefact for our measurements of ambient6ANs. In order to assess this, we conducted some experiments to check whether HNO3is detected as NO2in our TD 723 inlet.
small flow of air (≈20 sccm) through a metre of 1/16′′PFA tubing immersed in 66 % HNO3solution at room
tempera-ture and diluting this to∼5 L (STP) min−1(hereafter SLM)
before adding the resultant flow directly to the inlets. Figure S1 of the Supplement shows the efficiency of de-tection of HNO3as a function of oven temperature at a
rel-ative humidity (measured at 298 K) of 40 %. Assuming that we detect 100 % of HNO3at∼950 K (about 2 ppbv) we can
derive an efficiency of∼10 % at the normal inlet tempera-ture of 723 K, which is substantially less than the 70 % at 723 K reported by Wild et al. (2014). The reduction of NO2
at T> 900 K is seen for additions of both HNO3 and pure
NO2and may reflect its surface catalysed decomposition at
these elevated temperatures. Based on this single measure-ment, ambient levels of 2 ppb for HNO3 would result in a
0.2 ppb bias to the measurements of the6ANs. However, the true size of a bias to the ambient measurements of6ANs pre-sented later is much smaller as HNO3transmission through
the long (∼10 m), unheated, Teflon inlets and filter used is expected to be poor (Neuman et al., 1999). For the purpose of this paper we assume, as has been done in numerous previ-ous studies (Day et al., 2002), that HNO3does not impact the
measurements of our6ANs significantly. Strictly speaking, in the absence of independent HNO3measurements, the
am-bient6ANs mixing ratios we present later are thus to be re-garded as upper limits. In a similar vein, we assume through-out that we have 100 % inlet transmission for all PNs and all ANs but recognise that some loss of “sticky” hydroxynitrates may occur.
The cavity which normally samples from the 473 or 723 K inlets can also be switched to sample at ambient tempera-ture (via the “bypass” inlet shown in Fig. 1), enabling di-rect comparison of NO2 measurements in the two cavities.
As this method for detection of6ANs and6PNs relies on the difference in NO2mixing ratios when sampling from the
heated and unheated inlets, tests were carried out to estab-lish that equal concentrations of NO2are measured in each
cavity when only NO2is present. This data set, displayed as
Fig. S2, yields slopes of unity when the TD cavity sampled NO2(2–80 ppb) from the 473 and 723 K inlets.
The residence time inside the heated quartz tubes and the connection tubing after splitting the air stream is about 2.5 s before reaching the cavities. The temperature profile inside the heated part of the quartz tube is non-uniform and the op-erating temperature was chosen to ensure complete dissoci-ation of the organic nitrates. Figure 3 displays the relative NO2signals measured when ramping the temperature of the
ovens from 323 to 803 K and passing dilute samples of either PAN, 2-propyl nitrate or i-butyl nitrate through the heated inlets. This shows clearly that the thermal decomposition of PAN is complete at oven temperatures greater than 443 K. For the two alkyl nitrates tested, very similar profiles are ob-tained, indicating that decomposition is negligible at temper-atures < 493 K but that tempertemper-atures above∼693 K are suf-ficient for complete decomposition to NO2. These
observa-300 350 400 450 500 550 600 650 700 750 800
-0.2 0.0 0.2 0.4 0.6 0.8 1.0 1.2
2-propyl nitrate
i-butyl nitrate
PAN
R
e
la
ti
v
e
N
O2
y
ie
ld
Temperature (K)
Figure 3.Efficiency of thermal dissociation of PAN and the ANs 2-propyl nitrate andi-butyl nitrate. PAN (≈500 pptv) was formed by the photolysis of acetone/NO/air sample (see text for details). The purple and black data points were measured before and after a campaign (≈2 months separation in time). The ANs were available as diluted samples (several parts per million by volume, ppmv) in air which were diluted to≈10 ppbv for these tests. The vertical lines indicate the nominal oven temperatures finally used.
tions are consistent with those reported for similar TD set-ups to determine peroxy and alkyl nitrates (Day et al., 2002; Wooldridge et al., 2010; Zheng et al., 2011). Based on these results, the ovens were set to temperatures of 473 and 723 K (vertical lines in Fig. 3).
For initial estimates of the conversion efficiency of PNs and ANs to NO2we conducted tests using samples of PAN
and 2-propyl nitrate of known concentration. For PAN we used a photochemical source (Phillips et al., 2013) in which NO is converted to PAN via a series of oxidation steps involv-ing the photolysis of acetone in air. The PAN source is simi-lar to those reported e.g. in Warneck and Zerbach (1992) and Flocke et al. (2005) who have shown that NO is converted with > 90 % efficiency to PAN. A plot of the NO2signal from
the TD-CRDS vs. the calculated concentration of PAN (150 to 600 pptv) is given in Fig. S3. In this case, PAN was cal-culated by multiplying the NO mixing ratio (itself calcal-culated from the manufacturer’s specification and dilution factors) by 1.1. In this range of PAN mixing ratios, the response of the TD-CRDS to various NO (and thus PAN) concentrations is linear, with a gradient close to unity, initially suggesting that PAN detection as NO2is quantitative in our TD-CRDS.
Samples of alkyl nitrates in air of known concentrations (∼3 and ∼6 ppb) were prepared manometrically and used to derive the stoichiometry of conversion of 2-propyl ni-trate to NO2. The results are also displayed in Fig. S3 and
indicate that at 723 K, 2-propyl nitrate in air is quantita-tively converted to NO2. Later we discuss the effects of
non-stoichiometric conversion of PAN and ANs to NO2 due to
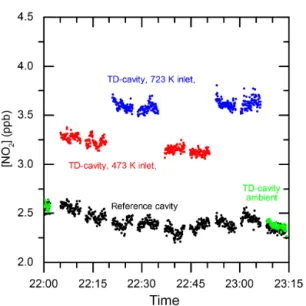
Figure 4.Example of a typical measurement cycle (showing raw data) when sampling ambient air. The black data points show the continuously measured NO2mixing ratios measured by the
refer-ence cavity. The green, red and blue data points were recorded in the TD cavity when sampling from the inlets at ambient tempera-ture, 473 and 723 K, respectively.
A typical measurement sequence (in this case with an am-bient air sample) is illustrated in Fig. 4 which displays NO2
mixing ratios in both cavities. The black data points show NO2measurements in the reference cavity; the blue and red
data points were obtained when the TD cavity sampled from the 723 and 473 K ovens, respectively. The green data points were obtained in the TD cavity when the gas was sampled via the bypass and serve as a check for consistency between the two cavities. The gaps in the data indicate zeroing peri-ods when the inlet was filled with synthetic air. Zeroing was conducted at the same pressure as the measurement to avoid changes in ring-down due to changes in Rayleigh scattering by air. Note that the change in ring-down time at 405 nm caused by a 3.3 mbar change in pressure of air is the equiv-alent of ∼100 pptv of NO2. As we discuss later, the use of
dry zero air to deriveτ0also requires correction for the
dif-ference in scattering cross section of dry and humid (i.e. am-bient) air. Experiments to derive correction factors for this effect are described in Sect. 2.1.
Subtraction of the NO2mixing ratio measured when
sam-pling from the reference cavity ([NO2]ref)from that obtained
in the cavity sampling from the 473 K inlet ([NO2 ]473)in
principal yields the summed mixing ratio of PNs that decom-pose thermally at this temperature. The main contributor will usually be CH3C(O)O2NO2(PAN), with contributions from
larger PNs and other NO2-containing trace gases (e.g. N2O5,
see later) which also readily decompose at this temperature. In order to derive the6ANs mixing ratio we first have to in-terpolate [NO2]TD 473(red data points) and then subtract this
from [NO2]TD 723(blue data points). The need to interpolate
the data from the 473 K channel means that the accuracy of the measurement of the6ANs is impacted by variability of the mixing ratio of the6PNs.
2.1 Data corrections
2.1.1 ltodratio
Owing to the use of purge gas flows at the mirrors, the physi-cal distance between the mirrors (d)is longer than the length through which optical absorption takes place (l). The ratio of dtolwas obtained by flowing a constant amount of NO2/N2
though the cavity and varying the purge gas flow from 0 to 500 sccm as shown previously for our red-laser instrument for measuring NO3and N2O5(Schuster et al., 2009). The
re-duction in NO2signal at a purge gas flow of 100 sccm
com-pared to when the complete volume between the mirrors was flushed with NO2(no mirror purge) was 5 %, indicating ad
tolratio of 1.06.
2.1.2 Inlet and filter loss of NO2, PNs and ANs
The inlet transmission and filter losses were investigated in the laboratory for NO2,6PNs and6ANs. The response to
concentration changes was nearly instantaneous, suggesting that wall losses or associated memory effects on the inlet and cavity tubing are insignificant. Transmission through a fresh PTFE filter (2 µm pore size) housed in a PFA filter holder was, within measurement precision, quantitative. Daily re-placement when sampling ambient air was found to be suffi-cient to maintain this high transmission.
2.1.3 Relative humidity
Use of dry zero air to derive τ0 requires correction for
the fact that the Rayleigh scattering cross section of water vapour is smaller than that of dry air. The size of this effect was investigated in the laboratory by comparingτ0(obtained
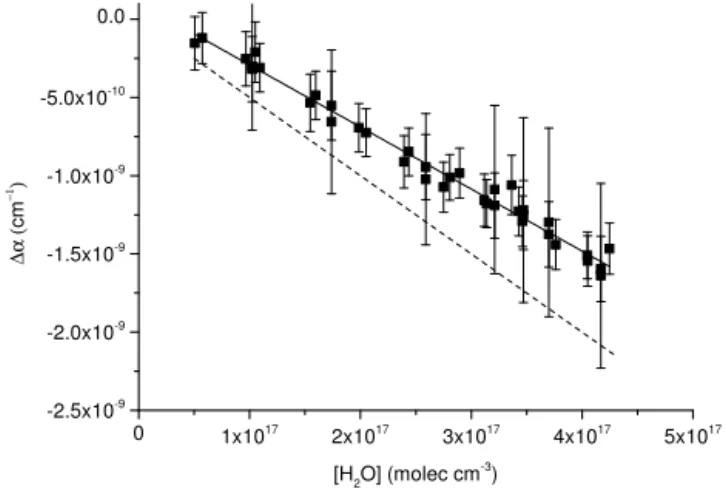
in dry zero air) toτ in zero air at various relative humidities (RHs) between 10 and 70 % (Delta Ohm, HD49T) at room temperature. The results are displayed in Fig. 5 which, at constant total pressure, shows a linear decrease in ex-tinction with increasing water vapour concentration. This confirms that, in contrast to the conclusions of Hargrove and Zhang (2008) who found a large, positive interference caused by water vapour at 405 nm, the effect of H2O in
ambient air is to reduce extinction due to its lower Rayleigh scattering cross section. The slope of the fit in Fig. 5 yields a cross section difference between water vapour and dry air of 1σRayleigh405−409 nm=(−4.0±0.4)×10−27cm2molecule−1. This is somewhat lower than the value of 1σRayleigh405−409 nm=(−5.0±0.2)×10−27cm2molecule−1 obtained at 404±0.5 nm by Fuchs et al. (2009). To put this in context, the correction applied for an ambient relative humidity of 70 % at 22◦C is equivalent to 130 pptv NO2
ra-0 1x10¹⁷ 2x10¹⁷ 3x10¹⁷ 4x10¹⁷ 5x10¹⁷
-2.5x10⁻⁹
-2.0x10⁻⁹
-1.5x10⁻⁹
-1.0x10⁻⁹
-5.0x10⁻¹⁰
0.0
∆α (
c
m
−1)
[H2O] (molec cm-3)
Figure 5.Determination of the scattering cross section of H2O at
405 nm. 1α is the change in measured extinction when H2O is
added to dry air (1α=α(RH=0) –α(RH > 0)). The dashed line is the calculated value of1αwhen using the difference in scattering cross sections in dry and humid air reported by Fuchs et al. (2009).
tios the correction is therefore large (e.g. 100 % at 100 pptv). We discuss the impact of this later when assessing the total uncertainty.
2.1.4 Presence of NO2in zero air
The presence of NO2in the zero air used would lead to an
underestimation of the ambient NO2concentrations. In order
to check for NO2impurity in bottled zero air
(hydrocarbon-free) we constructed and characterised an efficient, all-quartz blue-light converter (BLC) (Kley and McFarland, 1980) to remove NO2. The BLC consisted of a thin (ID 10 mm) quartz
tube of∼30 cm length with the light from two LED arrays operating at a central wavelength of∼390 nm coupled into the tube via quartz end windows. NO2entered and exited the
BLC via side arms located close to the end windows and, at a flow rate of 1 SLM, was removed with an efficiency of
∼60 %, independent of NO2mixing ratios up to about 1 ppb.
The use of quartz rather than Teflon for the construction of the BLC reduces memory effects related to NO2degassing
from or being formed on UV-illuminated Teflon surfaces. The level of NO2in the zero air could thus be monitored with
the CRDS by flowing the air through the BLC and modulat-ing the light on and off over several 1 min cycles. In all bot-tles tested during a field campaign (PARADE; see Sect. 3) no change in NO2signal was observed, placing an upper limit
of about 20 pptv of NO2in the zero air, implying a maximum
bias of−20 pptv in the NO2measurements. 2.1.5 Formation of NO2via O3+NO
Common to several established instruments that measure NO2, its formation in a dark reaction between NO and O3in
e.g. an inlet line has to be considered (Ryerson et al., 2000).
NO+O3→NO2 (R8)
Laboratory experiments were thus conducted to examine the formation of NO2via the reaction of O3with NO, in which
mixing ratios of NO (0–10 ppbv) and O3(25, 48 or 80 ppbv)
were varied systematically. NO was taken from a bottled standard, O3was formed by passing synthetic air over a
Pen-Ray®lamp and its concentration was monitored using a pho-tometric O3 analyser (Thermo Environmental Instruments,
model 49).
Under conditions of low conversion of NO and O3,
the amount of NO2 formed [NO2]t can be calculated
from the initial concentrations of NO and O3 and the
reaction time (t ): [NO2]t=k8[NO][O3]t, where k8 is
the rate coefficient for Reaction (R8) and is given as 2.07×10⁻¹²exp(
−1400/T) cm3molecule−1s−1(Atkinson
et al., 2004) which results in a room temperature rate coeffi-cient of about 1.9×10⁻¹⁴cm3molecule−1s−1. For the NO2
reference channel (inlet at 298 K, cavity at 308 K) the amount of NO2formed was entirely consistent with the kinetic
pa-rameters and reaction time used. This is demonstrated in Fig. 6 (upper panel).
The expression above indicates that the rate coefficient in-creases significantly with temperature so that an increase in the formation of NO2would be expected in the ovens of the
TD cavity. Indeed, in order to explain the formation of NO2
in the 473 and 723 K channels, “effective” rate coefficients ofk8eff=2.5×10⁻¹⁴ and 6.2×10⁻¹⁴cm3molecule−1s−1,
respectively were necessary. These effective rate coefficients are substantially lower than those derived from the param-eterisation given above (1.1×10⁻¹³cm3molecule−1s−1at
473 K and 3.0×10⁻¹³cm3molecule−1s−1 at 723 K) and
correspond to lower effective or average temperatures (∼320 and 400 K, respectively) experienced by gas passing through the inlets and cavities. Numerical simulations of the reaction between NO and O3 taking place in the oven and cavities
were conducted using a measured temperature profile (see below). The amount of NO2formed in the simulation of
Re-action (R8) was converted to an effective rate coefficient us-ing the expression above. The result for the 723 K cavity was a value of k8eff ∼(6.4±0.5)×10−14cm3molecule−1s−1
where the scatter in the retrieved effective rate constant was the result of simulations using different initial amounts of O3. This is entirely consistent with the experimental
obser-vations.
The effective rate coefficients (k8eff)are thus appropriate
for making corrections for NO2formed from O3+NO in this
particular system. In order to illustrate the size of this cor-rection, we assume O3=50 ppb, NO=1 ppb, NO2=5 ppb,
which are typical of a semi-polluted environment during day-time. The amount of NO2 formed in the reference (cold)
channel via this route is 0.1 ppbv or 2 % of ambient NO2.
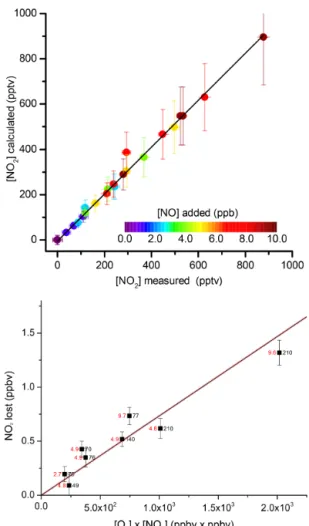
Figure 6.Upper panel: NO2formation in the reaction of O3(25, 48 or 80 ppbv) with NO in the inlet (in this case at ambient tempera-ture), and reference cavity (at 308 K) and connecting tubing. The er-ror bars on the calculated NO2formed are derived from the∼20 %
error in the rate coefficient given for the rate coefficient (Atkinson et al., 2004). The fit to the data (black line) yields a slope of 1.04±
0.08. Lower panel: loss of NO2as a result of the thermal
decom-position of O3to O atoms and Reaction (R11). The black numbers to the right of each symbol indicate the O3mixing ratio (ppbv); the
red numbers to the left represent the initial NO2amount (in ppbv). The straight black line is a weighted fit to the data with a slope of 7.34×10⁻⁴ppbv−1. The transparent red line is the NO2loss (in
ppbv) calculated as described in the text with [O]ss=[O3]/276.
2.1.6 Pyrolysis of O3
The potential for the reduction of NO2 to NO via
reac-tion with O(3P) atoms (henceforth O) formed in the thermal degradation of O3 has been discussed by Day et al. (2002)
who showed that it is of negligible importance for measure-ments of PNs and ANs at the temperatures of their heated inlets and their residence times. However, more recently, the same group has shown that at slightly higher oven tempera-tures, this effect may be significant (Lee et al., 2014). Peukert et al. (2013) have recently provided a parameterisation for the
thermal decomposition rate coefficient of O3(k9)that results
in a value of 0.2 s−1at 473 K, increasing to 520 s−1at 723 K,
the temperatures of the two ovens used here. The fate of O atoms formed is almost exclusively recombination with O2
(with rate coefficientk10).
O3→O+O2 (R9)
O+O2+M→O3+M (R10)
This leads to a steady-state expression for the O atom con-centration of [O]ss=k9 [O3]/k10 [O2]. At 723 K, the
for-ward and back reactions are both fast (several 100 s−1)and a steady state is rapidly acquired. Thus at an ambient O3
level of 50 ppbv, the O atom concentration in a steady state at 723 K would be 2.6×10¹¹atom cm−3; i.e. O atoms repre-sent a substantial fraction (> 20 %) of odd oxygen (O+O3)
at 723 K.
The lifetime for NO2 loss with respect to reaction with
O (Reaction R11) at 723 K is given by (k11×[O])−1and is
equal to∼0.6 s. Thus, the loss of NO2due to reaction with O
from the thermal decomposition of O3depends sensitively on
the residence time in the oven and on the temperature profile in the oven.
O+NO2→NO+O2 (R11)
We have examined the impact of this reaction in laboratory experiments in which NO2 (in varying amounts) was
de-tected simultaneously in both the TD cavity with the oven at 473 or 723 K and the ambient temperature inlet/cavity whilst O3(also in varying amounts) was added. At 473 K no
mea-surable effect was observed, which is consistent with the ob-servations of Day et al. (2002) and a calculated O atom con-centration of 2×10⁷atom cm−3.
In contrast, at 723 K, a loss of NO2is indeed observed at
high O3 concentrations and the results are displayed in the
lower panel of Fig. 6 where we plot the measured loss of NO2vs. the product of the NO2and O3mixing ratios. The
individual NO2(red) and O3(black) mixing ratios (in ppbv)
are listed to the left and right of the symbols.
The solid black line is a least squares fit to the data with the amount of NO2lost, LNO2(ppbv), given by
LNO2=7.34×10−
4
[NO2][O3], (2)
where the mixing ratios of O3 and NO2 are also given in
ppbv.
The rationale for representing the data this way is that the loss rate of NO2 is given by the expression −d[NO2]/dt=k11[NO2][O]ss, where [O]ss is
pro-portional to [O3] (see above). k11 displays a weak
k11=7×10⁻¹²cm3molecule−1s−1, we calculate the loss
of NO2by adjusting the value of [O]ss/[O3] until agreement
with the experimental results is observed. This procedure returns a value of [O]ss=[O3]/276 and is represented by
the thick, transparent red line in Fig. 6. This effective ratio of [O] to [O3] is much smaller than that indicated above which
is partly a result of using an average transport time through the oven and cavity and thus an average temperature, and partly via loss of O atoms (see below).
Equation (2) thus enables us to perform a simple correc-tion to account for NO2 loss though O3 decomposition in
the 723 K oven and TD cavity. The size of the correction de-pends sensitively on the O3 concentration. For example, at
[O3]=50 ppbv we calculate that from an initial NO2mixing
ratio of 5 ppbv, we would lose 0.18 ppbv, i.e. less than 4 %. To further our understanding of the processes involved, we have also conducted numerical simulations of a simple reac-tion scheme in which various amounts of O3and NO2pass
through the hot oven and piping, and are thereby exposed to the temperature profile displayed in Fig. S4. The simulations, which included Reactions (R8)–(R11) and also the reaction of O with O3, showed that at high O3 levels, > 10 % of the
NO2passing through the 723 K oven would be consumed by
the reaction with O, clearly overestimating the measured ef-fect. The results of the series of simulations are summarised in Fig. S5 which also shows the experimental data. Good agreement (green data points) is obtained when an extra loss term (e.g. wall loss) for the O atoms of≈70 s−1was incorpo-rated in order to reduce their steady-state concentration. This is in accord with the observations of Day et al. (2002), who also invoked a loss of O atoms to account for observed NO2
loss rates which were also much lower (factor of 4) than cal-culated. In our system, the predicted loss of NO2without O
atom wall loss (purple symbols) is a factor of∼2 too large. This may be partially a result of loss of O atoms to walls, but may also be related to the fact that the pyrolysis rate constant for O3is highly temperature-dependent and a change in oven
temperature from 723 K to e.g. 703 K would reduce the O atom concentration by a factor of∼1.5.
2.1.7 Reactions of organic radicals with NO and NO2
The method of thermal dissociation of PNs or ANs to NO2 and subsequent monitoring of NO2 requires
knowl-edge of the stoichiometry of the conversion factor under op-erating conditions. As discussed already (Day et al., 2002; Wooldridge et al., 2010), deviation from an ideal conversion factor of unity occurs when the NO2formed in the thermal
dissociation recombines with the organic radical, or when the organic radical can react with other atmospheric substituents (such as NO) to form NO2. The reactions which take place
in the 473 and 723 K inlets are discussed below.
473 K inlet
Alkyl nitrates pass through the 473 K inlet without dissocia-tion so we need only to consider the fate of PNs. For PAN (CH3C(O)O2NO2)the major reactions that either form or
consume NO2are
CH3C(O)O2NO2+M→CH3C(O)O2+NO2+M (R12)
CH3C(O)O2+NO2+M→CH3C(O)O2NO2+M (R13)
CH3C(O)O2+NO(+O2)→NO2+CH3O2+CO2 (R14)
CH3O2+NO(+O2)→HCHO+HO2+NO2. (R15)
HO2+NO→OH+NO2 (R16)
OH+NO2→HNO3 (R17)
Note that Reactions (R14) and (R15) are composite reactions in which the initially formed CH3CO2and CH3O either
de-compose and/or react with O2to give the products listed.
Reaction (R13) results in underestimation of RO2NO2
mixing ratios, whereas Reaction (R14) and subsequent Re-actions (R15) and (R16) of organic radical fragments result in an overestimation by oxidising a fraction of any ambient NO. These reactions compete with loss of the organic radical to the wall of the hot quartz tubing or their thermal decompo-sition so that the size of the artefact will depend non-linearly on ambient levels of NO and NO2as well as the
concentra-tion of RO2NO2. The reaction scheme above indicates that
when wall losses of the radicals are neglected, the presence of sufficient NO can result in the generation of three extra NO2for each one formed directly in PAN decomposition.
Such effects can be reduced by operating the instrument at very low pressures (and absolute trace gas concentrations) as described by the Berkeley group (Wooldridge et al., 2010). As discussed by Paul et al. (2009), this option is not available for a CRDS instrument which generally operates at higher pressures in order to maintain sufficient sensitivity.
Initial observations of an unchanging mixing ratio when flowing samples of PAN or 2-propyl nitrate at levels of 1– 2 ppb through the inlet and cavities at flow rates of between 1 and 3 L (STP) min−1(SLM), and thus varying the reaction time by a factor of 3 indicated that such effects are small, in accord with the observations of Paul et al. (2009) and the data shown in Fig. S3. A detailed experimental investigation of this artefact was conducted in a set of experiments in which known amounts of NO or NO2were added to a PAN sample
(between 500 and 5000 pptv) and the resultant NO2formed
by thermal decomposition was monitored.
The results of experiments in which various concentrations of NO2were added to three different concentrations of PAN
are displayed in Fig. 7. In these experiments, PAN was sup-plied from a diffusion source of PAN in tridecane held at 273 K.
In the absence of a recombination of CH3C(O)O2
rad-icals and NO2, the difference between [NO2]TD 473 and
0 4 8 12 16 20 0.1
1 10
PAN = 0.79 ppbv
PAN = 2.45 ppbv
[N
O2 ]TD
4
7
3
[
N
O2 ]ref
[NO2] added (ppbv) PAN = 7.50 ppbv
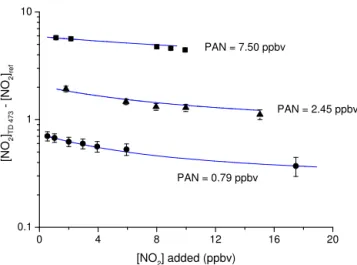
Figure 7.Measurements of the difference signal (TD cavity sam-pling from the 473 K inlet – NO2 reference cavity) with various
amounts of NO2added and at three different PAN concentrations
(0.79, 2.45 and 7.50 ppbv). The error bars represent standard devi-ation and were derived by propagating errors in the NO2signals in
the TD and reference cavities. The blue lines show the results of numerical simulations as described in Sect. 2.1.7.
concentration. The effect of reformation of PAN is clearly seen in the data; therefore, at an initial concentration of about 700 pptv of PAN, only 460 pptv would be detected as [NO2]473−[NO2]ref if 8 ppb NO2 were also present. Even
in the absence of added NO2, [NO2]TD 473−[NO2]ref is
smaller than the amount of PAN added as some of the 700 pptv of the NO2formed in the thermal dissociation
re-gion can also recombine with CH3C(O)O2.
In Fig. 8 we display the results of a similar set of experi-ments in which NO was added instead of NO2. As expected
from the reaction scheme above, by adding NO we convert CH3C(O)O2 radicals into NO2 and thus observe a positive
bias in the [NO2]TD 473–[NO2]refsignal. For an initial PAN
concentration of about 1000 pptv, the result of adding 4 pbbv of NO is to overestimate the PAN concentration by about 180 %. These results are similar to those presented in Paul and Osthoff (2010) who used a warmer TD temperature of 523 K (at 450 Torr) and found a roughly linear (negative) de-pendence on NO2. They used a second-order polynomial
ex-pression to correct the non-linear, positive bias caused by the presence of NO. However, as ambient air contains NO and NO2in greatly varying amounts and ratios, there is no
sim-ple analytical expression that can provide a correction for the opposing effects of PN underestimation due to NO2
recom-bination or PN overestimation as a result of peroxy-radical-induced oxidation of ambient NO. The sign and size of the bias depends on the concentrations of PN, NO and NO2and
also the rate of wall loss of the peroxy radicals involved (Wooldridge et al., 2010). In order to gain insight into the reactions taking place in the ovens and in the piping leading to the cavities and in the cavities themselves, we conducted
0 1 2 3 4 5 6 7 8
1 10
PAN = 1.05 ppbv PAN = 7.40 ppbv
[N
O2 ]TD
4
7
3
[
N
O2 ]ref
[NO] added (ppbv)
Figure 8.Measurements of the difference signal (TD cavity sam-pling from the 473 K inlet – NO2 reference cavity) with various
amounts of NO added and at two different PAN concentrations (0.74 and 7.40 ppbv). The error bars represent standard deviation and were derived by propagating errors in the NO2signals in the TD and
reference cavities. The blue lines show the numerical simulations as described in Sect. 2.1.7. The apparent worsening of the agreement between the model and the experiment at [NO] > 2.5 ppbv is the re-sult of drifts in the PAN mixing ratio during this experiment. By normalising to the PAN concentration (as in Fig. 10), the deviation disappears.
a detailed set of numerical simulations (FACSIMILE, Curtis and Sweetenham, 1987) of the laboratory experiments de-scribed above.
The simulations were initialised with position-dependent temperature gradients in the oven and subsequent piping and cavities (see Fig. S4), which were derived by inserting a ther-mocouple into the quartz tubing and measuring the temper-ature of the inner wall at different distances from the cold, front edge of the oven. As the 473 K oven and cavities were maintained at 800 mbar, the large variation in temperature resulted in significant gradients in the gas density and flow velocity in hot and cold parts of the apparatus, which were also accounted for in the simulations. The gas-phase reac-tions accounted for in the chemical scheme are listed as sup-plementary information, the temperature-dependent rate con-stants being taken mainly from IUPAC (2015). The goal of the simulations was to mimic the observed dependence of the PN–NO2signals on the amounts of NO and NO2added (i.e.
the data in Figs. 7 and 8).
Initial simulations confirmed that the bias due to adding NO and NO2 was dependent on the assumed wall loss rate
constant (kwall)of the HO and peroxy radicals. Simulations
with unrealistically large wall loss rates such as to make all other radical reactions insignificant removed the bias com-pletely and thus could not reproduce the observations. The use of very small (or zero) values ofkwallresulted in an
determining the size of the bias, the use of a single value of kwallwas not able to reproduce the observed effect for
differ-ent initial PAN concdiffer-entrations, with lower values ofkwall
re-quired for experiments in which PAN was large. This obser-vation is consistent with the radicals being lost to the surface via a Langmuir–Hinshelwood-type mechanism, in which the rates of surface reactions are inversely dependent on radical densities, often described in terms of surface passivation.
The uptake coefficient (γ )for a gas to a surface can be de-scribed by the following expression (Crowley et al., 2010a):
1 γ =
1 α+
1 Ŵs+
1 Ŵd
. (3)
Here,αis the accommodation coefficient, which in this case we assume not to be rate-limiting and set as 1.Ŵdis related
to diffusive limitation to the uptake and, in tubular geometry, is approximated by
Ŵd=
3.66(2Dg) ¯
cr , (4)
wherer(cm) is the radius of the tube,c¯(cm s−1)is the mean
thermal velocity and Dg a diffusion coefficient (cm2s−1).
Temperature- and pressure-dependent diffusion coefficients for HO, HO2, CH3O2and CH3C(O)O2were calculated from
D (R,air)= 1.0868T 1.75 √
M(R,air) √3V
R+√3Vair
2, (5)
whereM is the reduced mass ofR in air,R is one of HO, HO2, CH3O2or CH3C(O)O2andV is the diffusion volume,
which can be calculated from diffusion volumes for the indi-vidual atoms of each radical (Fuller et al., 1966).
In the case of a Langmuir–Hinshelwood reaction, we have Ŵs=A
KLangC
(1+KLangC[R])
. (6)
Ais a composite term: A= 4ks[Y]Nmax
¯
c , (7)
whereksis the rate constant for the accommodated trace gas
reacting with a surface siteY, andKLangCandNmaxdescribe
the equilibrium partitioning of RO2to the surface.
We treat A as a variable for optimising agreement be-tween observations and the numerical simulation. In doing this we make some broad simplifications: we take into ac-count the temperature and molecular mass dependence of the mean thermal velocity of HO2, CH3O2and CH3C(O)O2
but do not consider the unknown temperature dependence of terms such as ks andKLangC. We further assume that these
terms have the same value for all the peroxy radicals in-volved and sum the concentrations of the peroxy radicals at each time step, so that [RO2] in expression (Eq. 8) is equal to
[CH3C(O)O2]+[CH3O2]+[HO2].
We derive temperature and pressure and thus time-dependent values ofγfor each peroxy radical involved. This is then converted to individual wall losses using
kwall(RO2)=
γc¯
2r. (8)
The time-dependent values of kwall varied between 0.3
and 0.8 s−1 with an average value (over the transport time through the ovens and cavities) of∼0.5 s−1, which is similar to the values of 0.2 and 0.3 s−1derived for Teflon and quartz surface reported previously (Wooldridge et al., 2010).
The results of the simulations are shown by the solid blue lines in Figs. 7 and 8. In all cases the same reaction scheme has been applied with only the initial concentration of PAN varied to reproduce the data set. The simulations reproduce the experimental data reasonably well over large variation in PAN (∼700 to∼7000 pptv) and NO/NO2, indicating that
the reaction scheme is a reasonable representation of the pro-cesses taking place. Some deviation (at [NO] >∼3 ppb) be-tween the measurement and model for the experiment with PAN=1.05 ppbv is observed which (at 7 ppbv) amounts to
∼25 %. This was largely due to fluctuations in the PAN source during this particular experiment and the apparent dis-crepancy disappears when normalised to the PAN amount, as shown below for the same data set.
The results of one experiment in which both PAN (∼560 pptv) and NO (500 pptv) were initially present, and in which NO2was varied, are also captured well by the
sim-ulations, showing that multicomponent mixtures are also cor-rectly represented (Fig. S6).
One further test was conducted using a photochemical source of PAN which converts NO to NO2and then to PAN at
a yield of > 90 % (see above). This source is free of NO and NO2in significant amounts and can deliver a calibrated PAN
amount if the NO mixing ratio is well characterised. The lack of NO2in this source was confirmed by observation of (no)
NO2in the unheated, reference cavity. The cavity sampling
from the 473 K oven displayed the expected increase in NO2,
whereas the cold channel showed negligible amounts. The re-sults are displayed in Fig. S7 in which we plot [NO2]TD 473–
[NO2]ref(solid squares) against that calculated from the
con-version factor of NO to PAN and the degree of dilution (solid line). The results indicate that the amount of PAN detected is slightly less than calculated at the lowest mixing ratio and that the bias is enhanced at high PAN mixing ratios, consis-tent with the recombination of CH3C(O)O2with NO2
com-peting with wall loss of CH3C(O)O2. The open circles
rep-resent the results of a set of simulations (random amounts of PAN) using the same model as described above and ini-tialised with NO and NO2mixing ratios of zero. The model
In summary, the model simulations yield correction factors for the amount of NO2formed by PAN decomposition, which
depends on the mixing ratios of PAN, NO and NO2. For
ex-ample, ambient mixing ratios of∼550 pptv PAN,∼520 pptv NO and 2100 pptv NO2would result in detection of 518 pptv
NO2in the TD channel, which thus has a bias of – 32 pptv,
requiring a correction factor of 1.06 (i.e. 6 %). For similar PAN and NO2concentrations, but with NO reduced to close
to zero (e.g. at night) the correction factor increases to 1.28. Correction factors less than unity are only found when NO is in excess of NO2; e.g. for 550 pptv of PAN with 5100 pptv
NO and 1600 pptv NO2, the correction factor is 0.55.
In Sect. 4 we apply PAN, NO and NO2
concentration-dependent correction factors to a set of data from a field campaign (PARADE, 2011). In order to do this, the results of > 90 000 simulations were stored in a look-up table from which correction factors for triads of PAN–NO–NO2mixing
ratios could be read. The results of the full set of simulations are summarised in Fig. S8. As expected, correction factors greater than unity are associated with high NO2mixing
ra-tios and those less than unity with large NO mixing rara-tios. In both cases, the correction factor is smallest when PAN is low (at the limit of zero PAN, there are no RO2to recombine
with or generate NO2). 723 K inlet
At the higher temperatures of the 723 K inlet, the chemistry of acetyl and acetyl peroxy radicals is significantly modified compared to that detailed above. The main difference is that the CH3C(O)O2radical initially formed in PAN
decomposi-tion is thermally instable and can decompose to the acetyl radical (CH3CO) and O2 (Reaction R18a) or isomerise to
CH2C(O)OOH (Reaction R18b) (Lee et al., 2002; Carr et al.,
2011):
CH3C(O)O2+M →CH3CO+O2+M (R18a)
→CH2C(O)OOH. (R18b)
The major fate of CH2C(O)OOH is thermal decomposition
to OH and a singletα-lactone (Carr et al., 2011).
CH2C(O)OOH→OH+1C2H2O2 (R19)
The acetyl radical formed in (Reaction R18a) can decompose to CH3+CO (Reaction R20) or react with O2to reform the
peroxy radical (Reaction R21a) or form OH (Reaction R21b) and the singlet α-lactone (Tyndall et al., 1995; Carr et al., 2007, 2011; Chen and Lee, 2010; Groß et al., 2014; Papadim-itriou et al., 2015):
CH3CO→CH3+CO (R20)
CH3CO+O2+M→CH3C(O)O2+M (R21a)
CH3CO+O2→OH+1C2H2O2 (R21b)
CH3+O2+M→CH3O2+M. (R22)
CH3formed in Reaction (R20) will react with O2to form the
methyl peroxy radical (Reaction R22).
At 723 K, Reactions (18)–(21) proceed on timescales of milliseconds or shorter, the net effect being the destruction of CH3C(O)O2on a timescale that is short relative to its other
loss processes including loss at the wall, recombination with NO2 or reaction with NO. The radical products formed in
these steps are OH and CH3O2. The loss of CH3C(O)O2at
723 K will obviously reduce the potential for reformation of PAN via Reaction (R13) so that the effect of adding NO2
should be significantly reduced when compared to the inlet at 473 K. The reaction of CH3O2with NO2also forms a
per-oxy nitrate (CH3O2NO2), but one which is unstable with
re-spect to decomposition back to reactants even at moderate temperatures and this reaction does not lead to significant se-questering of NO2.
The effect of adding NO2was explored in a set of
experi-ments with different initial PAN mixing ratios and with NO2
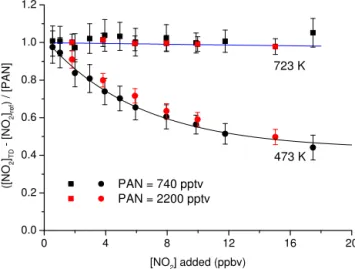
varied up to∼20 ppbv. The results are displayed in Fig. 9 which plots the ratio of NO2from PAN thermal dissociation
to the amount of PAN added vs. [NO2] added. Ideally, in the
case of complete dissociation of PAN to NO2and no
subse-quent recombination, this should be close to a value of unity and independent of the mixing ratio of NO2added and this
is indeed what is observed when sampling from the 723 K inlet. We conclude that at 723 K, there are insufficient per-oxy radicals to remove NO2, and that measurements using
this inlet are insensitive to variations in ambient NO2up to
about 20 ppbv. By way of comparison we also plot the data obtained using the 473 K inlet in the same manner to empha-sise the significant dependence on added NO2 in the cooler
inlet as described above. This is consistent with the measure-ments of Paul et al. (2009) who also observed a lack of de-pendence on added NO2using a 723 K oven operated at a
similar pressure (450 Torr).
A similar set of experiments was carried out with NO added instead of NO2, in this case to investigate potential
bias from the oxidation of ambient NO to NO2 as seen for
the 473 K inlet. The results are presented in Fig. 10, which plots the ratio of NO2from PAN thermal dissociation to the
amount of PAN added vs. [NO] added. In the absence of any unwanted NO2 formation resulting from NO oxidation, the
result should be a flat line with an intercept of 1. Figure 10 shows that NO is converted to NO2in the 723 K inlet, though
the effect is much reduced when compared to the 473 K in-let. For example, the effect of adding 10 ppb NO is to bias the PAN measured by a factor 2.75 sampling from the 473 K inlet and 1.5 when sampling from the 723 K inlet. There is no significant difference in the bias when PAN was varied between 1 and 2.5 ppb. Note that the data plotted here for the 473 K inlet are the same as those in Fig. 8.
As described in detail above, the large bias seen when sam-pling from the 473 K inlet results mainly from reactions of CH3C(O)O2with NO. As CH3C(O)O2decomposes rapidly
0 4 8 12 16 20 0.0
0.2 0.4 0.6 0.8 1.0 1.2
723 K
PAN = 740 pptv PAN = 2200 pptv
([
N
O2 ]TD
[
N
O2 ]ref
)
/
[P
A
N
]
[NO2] added (ppbv)
473 K
Figure 9.Measurements of the difference signal (TD cavity sam-pling from the 473 (squares) or 723 K inlet (circles) – NO2
refer-ence cavity) when adding different amounts of NO2to PAN
sam-ples (740 or 2200 pptv). [NO2]TDrefers to the mixing ratio of NO2
measured in the TD cavity sampling from either the 473 or 723 K inlet. The blue line denotes the model prediction of the effect of adding NO2to the 723 K inlet. The black line shows an exponential
fit to the NO2measured when sampling from the 473 K inlet and is
added to guide the eye. The error bars represent standard deviation and were derived by propagating errors in the NO2signals in the
TD and reference cavities.
is expected to be via the CH3O2 radicals formed in
Re-actions (R20)–(R22) and also via conversion of CH3O2 to
HO2in the presence of NO/O2(Reaction R15). This could
be qualitatively confirmed by extending the simulations de-scribed above to cover the temperatures of the 723 K in-let. In order to do this, we scaled the temperature profile to peak at 723 K (instead of 473 K) and also added Re-actions (R18)–(R22). The rate coefficients used were from Baulch et al. (2005) (Reaction R20), (Papadimitriou et al., 2015) (Reaction R21a and R21b) with the dissociation and isomerisation rate constants taken from Lee et al. (2002). We note that, as these rate constants are poorly characterised at 723 K and that, even at 298 K, there is disagreement con-cerning e.g. the yield of OH from CH3CO+O2 (Carr et
al., 2007; Groß et al., 2014; Papadimitriou et al., 2015), per-fect agreement between observation and simulation is not ex-pected. The simulation shown in Fig. 10 (blue line, labelled A) does however capture the observed reduction in oxidation of NO to NO2in the 723 K inlet compared to the 473 K inlet
(blue line, labelled “C”). Simulation C was obtained using the same simulation but with the temperature profile for the 473 K inlet.
The amount of NO2 formed depends on the abundance
of CH3O2 and HO2, so that the simulated NO2
genera-tion is favoured by higher rates of CH3C(O)O2dissociation
to CH3CO rather than isomerisation to CH2C(O)OOH, and
higher rates of CH3CO dissociation to CH3relative to
reac-0 2 4 6 8 10 12
0.5 1.0 1.5 2.0 2.5 3.0
723 K C
B 1050 pptv PAN
2500 pptv PAN
([
N
O2 ]TD
[
N
O2 ]ref
)
/
[P
A
N
]
[NO] added (ppbv)
A
1 + 0.9(1-exp(-0.08*NO)) 473 K
Figure 10.Measurements of the difference signal (TD cavity sam-pling from the 473 (squares) or 723 K inlet (circles) – NO2 ref-erence cavity) when adding various amounts of NO to PAN sam-ples (1000 or 2500 pptv). [NO2]TD refers to the mixing ratio of
NO2measured in the TD cavity sampling from either the 473 or
723 K inlet. The simulations (blue lines) labelled A and B are model predictions of the effect of adding NO2 to the 723 K inlets using
different rate constants for the rearrangement of CH3C(O)O2 to
CH2C(O)OH (see text for details). The simulation labelled C cor-responds to the 473 K inlet. The error bars represent standard devi-ation and were derived by propagating errors in the NO2signals in the TD and reference cavities. The black lines show exponential fits to the data as described by the expressions given.
tion with O2, which ultimately leads to OH (which can
re-move NO2by forming HNO3)rather than CH3O2or HO2.
An improved match between the observation and the model (Fig. 10, blue curve marked “B”) was achieved by reducing the rate of isomerisation of CH3C(O)O2 to CH2C(O)OOH
to 20 % of the value reported by Lee et al. (2002) at 723 K. This value is strongly dependent on calculated barrier heights and is particularly uncertain, as has been noted by Carr et al. (2011). We do not seek to imply that our data constrain such kinetic parameters as there are certainly other factors that can affect the NO2production rate, including the rates of
wall losses of radicals and the relative rates of decomposition and isomerisation of CH3C(O)O2and the thermal stability of
CH3CO.
In summary, in the absence of ANs, the experiments sam-pling PAN via the 723 K inlet reveal that there is no signif-icant bias when adding NO2, and that the (positive) bias
in-troduced by the addition of NO is independent of the amount of PAN, at least up to 2–3 ppbv PAN. This simplification of the chemistry compared to the 473 K inlet removes the need for complex simulations to correct the data set. The NO2
∼10 ppbv NO and is valid for NO mixing ratios up to about 10 ppbv. These NO-dependent factors must be applied to the PAN mixing ratios prior to subtracting them from the total NO2signal (from6ANs+6PANs) when sampling from the
723 K inlet.
We now consider the chemistry taking place when ANs are present. For the 723 K inlet and considering 2-propyl nitrate, the additional reactions are
2-C3H7ONO2→2-C3H7O+NO2 (R23)
2-C3H7O+O2→CH3C(O)CH3+HO2 (R24)
2-C3H7O+M→CH3+CH3CHO+M (R25)
HO2+NO→NO2+OH. (R26)
The CH3radical is immediately converted to CH3O2so that
the radical pool is again a mixture of CH3O2and HO2, both
of which may convert NO to NO2. As neither CH3O2NO2
nor HO2NO2 are sufficiently thermally stable to sequester
NO2 these radicals should not lead to loss of NO2 via
re-combination. In the 723 K inlet, this chemical system should therefore behave similarly to the one described above for PAN, i.e. should suffer from positive bias when adding NO but no negative bias when adding NO2.
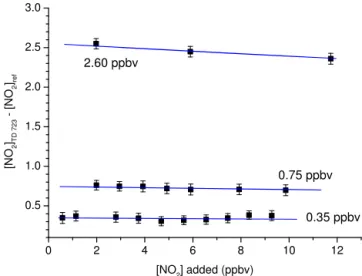
The results from a set of experiments to explore the effects of adding NO2to various amounts of 2-propyl nitrate are
dis-played in Fig. 11. NO2was varied between∼0.5 and 12 ppb
for 2-propyl nitrate mixing ratios of 0.35, 0.75 and 2.6 ppb. The bias from adding NO2at these levels is not measurable at
the lowest 2-propyl nitrate mixing ratios, though the data at 2.6 ppb indicate a weak reduction in the measured AN mix-ing ratio. The model described above was extended with Re-actions (R23) to (R26) and initiated with the 2-propyl nitrate mixing ratios observed in the absence of extra NO2. The
re-sults are shown by the blue lines in Fig. 11. Once again the model satisfactorily predicts the trends observed for each ex-periment, including the weak loss (5 %) of NO2observed at
the highest 2-propyl nitrate mixing ratio. The simulations re-vealed that the sole significant “reservoir” of this missing 5 % of 2-propyl nitrate was in the form of CH3O2NO2.
Experiments with various amounts of added NO are sum-marised in Fig. 12. The positive bias caused by oxidation of NO to NO2is apparent, and at NO mixing ratios of 8 ppb,
re-sults in a∼60 % overestimation of the 2-propyl nitrate mix-ing ratio. The model (blue lines) also indicates that this is expected, the main oxidant of NO being CH3O2. The effect
of adding 5 ppb of NO2is not observable, consistent with the
weak effects described above in the absence of NO2.
A more detailed look at the relative bias caused by adding NO is provided by Fig. 13, which plots the ratio of the AN signal in the presence of NO to that without added NO. There is no clear trend in the data set with the largest effects (i.e. the uppermost and lowermost data points not associated with the extremes of 2-propyl nitrate mixing ratios. The positive bias caused by the presence of NO is adequately described by the expression 1+1.8(1−exp(−0.08∗NO)), with NO being
0 2 4 6 8 10 12
0.5 1.0 1.5 2.0 2.5 3.0
0.35 ppbv 0.75 ppbv
[N
O2 ]TD
7
2
3
[
N
O2 ]ref
[NO2] added (ppbv)
2.60 ppbv
Figure 11.Measurements of the difference signal (TD cavity sam-pling from the 723 K inlet – NO2reference cavity) when adding
different amounts of NO2 to 2-propyl nitrate samples (0.35, 0.75
or 2.6 ppbv). The error bars represent standard deviation and were derived by propagating errors in the NO2signals in the TD and
ref-erence cavities. The blue lines show the model predictions of the effect of adding NO2to the 723 K inlet as described in the text.
0 2 4 6 8
1 10
[N
O2 ]TD
7
2
3
[
N
O2 ]ref
[NO] added (ppbv)
[2-propyl nitrate]
0.55 (ppbv) 0.56 (ppbv) 0.62 (ppbv) 5.78 (ppbv) 2.92 (ppbv)
Figure 12.Measurements of the difference signal (TD cavity sam-pling from the 723 K inlet – NO2reference cavity) when adding
dif-ferent amounts of NO2to 2-propyl nitrate samples (0.55, 0.56, 0.62,
2.92 or 5.78 ppbv). The sample with 0.62 ppbv 2-propylnitrate also contained∼5 ppbv of NO2. The error bars represent standard
devi-ation and were derived by propagating errors in the NO2signals in
the TD and reference cavities. The blue lines show the model pre-dictions of the effect of adding NO to the 723 K inlet as described in the text.

![Figure 13. Relative change in difference signal ([NO 2 ] TD 723 − [NO 2 ] ref ) / [2PN] 0 )) as a function of added NO for six different 2-propyl nitrate (2PN) mixing ratios](https://thumb-eu.123doks.com/thumbv2/123dok_br/18343120.352216/15.918.478.840.95.375/figure-relative-change-difference-signal-function-different-nitrate.webp)

