Correlation between Conductivity and Free Volume in Rubidium and Cesium Silicate Glasses
Marcio Luis Ferreira Nascimento
Vitreous Materials Laboratory, Department of Materials Engineering, Federal University of S˜ao Carlos 13595-905, S˜ao Carlos-SP, Brazil
Received on 4 January, 2007
It is shown that conductivity and molar volume in binary rubidium and cesium silicate glasses, both measured at room temperature, obey a common cubic scaling relation due to increase in alkali content. The drastic drop in conductivity up to 15 orders of magnitude for so many ion-conducting binary alkali silicate glasses (in wide composition range) is mainly caused by the structure and the ion content. In particular, it is suggested that the glass network expansion, which is related to the availablefree volume, is a parameter that could explain the increase in ionic conductivity for these binary systems.
Keywords: Glass; Ionic conduction; Anderson-Stuart model; Free volume; Alkali silicate
I. INTRODUCTION
The interest in glasses with high ionic conductivity is grow-ing rapidly because of their potential applications as solid electrolytes in new electrochemical devices such as solid state batteries, fuel cells, chemical sensors and ‘smart windows’. Varieties of amorphous ionic conductors with conductivities comparable to those in liquid electrolytes have been struc-turally investigated [1], with the aim of understanding the dif-fusion mechanism, which occurs in an otherwise relatively frozen environment. However, despite considerable experi-mental and theoretical efforts, the mechanism is not yet fully understood [1], even in simple systems. Thus, several trans-port models have been proposed, and they vary from thermo-dynamics with principles from liquid electrolytes, such as the weak electrolyte model [2], to models based on solid state concepts such as the jump diffusion model [3], the strong elec-trolyte (Anderson-Stuart) model [4], and the dynamic struc-ture model [5].
Obviously the detailed microscopic structure may be differ-ent for differdiffer-ent kinds of fast ion conducting glasses, as in the present case study. In an ion-conducting glass the ions move via the voids. The void volume is characterized in terms of the free volume. The present paper reports on the ionic con-ductivities and activation enthalpies of glasses in Rb2O-SiO2 and Cs2O-SiO2systems, with the purpose of correlating con-ductiviy with the free volume by means of experimental molar volume. Such molar volumes were calculated frommeasured density data in an attempt to evaluate proposals concerning the role of an open structure for ionic conductivity. Thus we test a general relation between the ionic conductivity enhance-ment and the expansion of the network forming unities, which shows that the alkali-induced volume expansion of the glass network could explain ionic conductivity, and that is related to the shear modulus.
II. BRIEF THEORY
Ionic conductivity σ in glass is a thermally activated process of mobile ions that overcome a potential barrierEA,
according to the Arrhenius equation:
log10σ=log10σ0−(log10e)EA/kBT, (1)
whereσ0is a pre-exponential factor. In the following sections it will be shown thatσ0does not depend on concentration or ion species.
To understand the conduction mechanism it is essential to find structural properties that are common for all amor-phous ionic conductors. In view of the most cited models, the Anderson-Stuart (A-S) [4] is considered to be the most di-rectly related to physically meaning parameters, such as ionic radii, relative dielectric permittivity and the elastic modulus, as described below. For the rubidium and cesium silicate sys-tems only recently has been published an analysis of conduc-tivity considering wide composition range [6].
Anderson and Stuart [4] have provided a picture of the con-duction energetics in an ion-conducting glass. In this model the activation enthalpy for conductivityEAwas considered as
the energy required to overcomeelectrostaticforces (Eb), plus
the energyEsrequired to open up “doorways” in the structure
large enough for the ions (in this case Rb+or Cs+)to pass through (thestrain energy). Thus, Ebrepresents the
neces-sary energy to remove a cation from a non-bridging oxygen site, andEsdescribes the expansion of the structure as the ion
moves from one site to another, where cations sites require only the presence of non-bridging oxygens (Eq. (2)):
EA=Eb+Es=
βzz0e2 ε(r+rO)
+4πGλ(r−rD)2. (2)
In effect,zandz0are the valences of the mobile ion and of the fixed counterion – in this case alkali and oxygen, re-spectively;randrOare the corresponding Pauling ionic radii
for Rb+or Cs+and O2−,λis a jump distance,eis the elec-tronic charge, andrDis the effective radius of the (unopened)
doorway.
McElfresh & Howitt [7], that have reexamined theEs term,
and have suggested such modified form that overcomes cer-tain limitations of the original A-S theory.
Briefly speaking, the McElfresch & Howitt picture is more appropriated to relateσdue to the configuration proposal of a cylindrical hole in the strain energy termEs[7]. It was proved
that the activation enthalpies for diffusion of inert gases in vitreous silica depends on (r−rD)2[7], and the proportional
factor should beλand notrD, as proposed by the A-S model.
Finally, following A-S theory theβparameter was considered asβ=a−r
b , whereris a value given in ˚A, as alsoaandb, that
are fitting parameters as described below.
A. Relation between Conductivity and Free Volume
Extensive studies have recently been made for obtaining a ‘universal’ equation (or “master curve”) from the glass struc-ture standpoint. Swenson and B¨orjesson [8] proposed a com-mon cubic scaling relation ofσwith the expansion volumes of the network forming units in salt-doped and -undoped glasses. This fact suggested that the glass network expansion, which is related to the available free volume, is a key parameter de-termining the increase of the high ionic conductivity in some types of fast ion conducting glasses.
The ion conduction should be determined by the ionic mo-tion within an infinite pathway cluster (see Adams and Swen-son [9]). For various silver ion conducting glasses [10-11], it was found that the cubic root of the volume fractionF of infinite pathways for a fixed valence mismatch threshold is closely related to both the absolute conductivity and the acti-vation enthalpy of the conduction process:
log10σT ≈√3F=log10σ,0−(log10e)EA/kBT, (3)
where σ0’ is the pre-exponential factor (in K/Ω·cm), that seems to be near constant and equal to 50Ω−1cm−1, as re-cently showed [6] for the systems in this work. The cubic root ofF may be understood as proportional to a mean free path length for the mobile ion [10], and could be related to the free volume as explained below.
According to Eqs. (1) and (3), more recently Nascimento et al. verified suchmaster curvein binary silicate [12], borate [13], germanate [14] and tellurite [15] glasses. From these studies, the influence of alkali content and temperature was minor on the pre-exponential terms, considering both expres-sionslog10σorlog10σT.
III. RESULTS AND DISCUSSION
Figures 1a-b present results on conductivity that follows Eq. (1) in almost all rubidium and cesium conductivities measured up to know, respectively [16-30]. As will be de-tailed below, Eq. (1) may be more usefull when one considers σ=σ(EA,T), leading, in fact, to a moregeneralrule, as
pre-sented recently [6].
1.0x10 -3
1.5x10 -3
2.0x10 -3
2.5x10 -3
3.0x10 -3 -16
-14 -12 -10 -8 -6 -4 -2 0
(a)
l
o
g
(
1
c
m
1
)
1/T (K
1
)
Blank Charles
Evstropiev & Pavlovskii
Frischat & Schutz Hakim & Uhlmann
Negodaev et al.
Otto & Milberg
(b)
1.0x10 -3
1.5x10 -3
2.0x10 -3
2.5x10 -3
3.0x10 -3 -16
-14 -12 -10 -8 -6 -4 -2 0
(b)
l
o
g
(
1
c
m
1
)
1/T (K
1
)
Blank
Charles
De Marchi et al.
Hakim & Uhlmann
Negodaev et al.
Otto & Milberg
Terai
Wakabayashi et al.
FIG. 1: Arrhenius plots of ionic conductivities in 22 and 21 binary rubidium (a) and cesium (b) silicate glasses, respectively [16-30].
Thus, differences observed in the activation enthalpies, shown in Figs. 1a-b, are likely to be associated with differ-ences in the chemistry and/or structure of the glass samples. Figs. 2a-b confirm this fact showing molar volumesVmfrom
experimental densities [21-45] of rubidium and cesium sys-tems, respectively. These figures show a markedly increase ofVm with alkali content. Then, the structure expands with
increasing alkali, but it is important to note that conductivity also increases. Authors that measured both conductivity and density are indicated by full symbols in Figs. 1-2. In conse-quence, simple questions arise:a)how the alkali ions move in these systems?b)How do the alkali ions move if the volume expansion could be related to ionic conductivity? Following there are proposed some evidences to answer these questions, the first one related to the A-S theory, and the last to a recent finding relatingσand the free volume.
A. Application of the Anderson-Stuart model
(a)
0 5 1015202530 354045505560 65 26
28 30 32 34 36 38 40
V
m
(
c
m
3
/
m
o
l
)
a
t
2
0
o
C
Rb 2
O (mol%)
Agarwal & Day Alekseeva Brosset Charles
Daemgen & Frischat Evstropiev & Pavlovskii Kassis & Frischat Hakim & Uhlmann McVay & Day Nasu et al. Nemilov Sasek & Lisy Shmidt & Alekseeva Tischendorf et al. (a)
(b)
0 5 1015 202530 3540 455055 6065 26
28 30 32 34 36 38 40 42 44 46
V
m
(
c
m
3
/
m
o
l
)
a
t
2
0
o
C
Cs 2
O (mol%)
Alekseeva Brosset Charles Hakim & Uhlmann Matusita et al. Nemilov Osaka & Takahashi Otto & Milberg Rouse et al. Sasek & Lisy Shmidt & Alekseeva Takahashi & Osaka Terai
Tischendorf et al. Vasiliev & Lisenenkov (b)
FIG. 2: Molar volumes from measured densities at room temperature of 63 and 66 binary rubidium (a) and cesium (b) silicate glasses, respectively [21-45]. Full symbols correspond to the same glasses presented in Fig. 1.
Data from Nemilov [24], Takahashi and Osaka [28] and Terai [29,30] presented the same decreasing behavior with increas-ing cesium content, accordincreas-ing to previous work [6]. In fact, following this recent paper, it was verified thatGpresented a linear fit of formG=G0−dGdnn, wheren is the alkali oxide mol percentage (mol%) andG0is a constant.
The relative dielectric permittivityεfrom Amrhein [47] and Charles [21] showed a small and monotonic increase with in-creasing rubidium content; but Charles’ [21] and Matusitaet al.’s [26] data did not follow the linear increasing as measured by Amrhein [47] and Hakim & Uhlmann [48] in cesium com-position, as presented in Ref. [6]. All linear fits follow the formε=ε0+ddnεn, whereε0is another constant.
Table 1 summarizes the obtainedGandεvalues from lin-ear fittings. More details aboutGandεfittings could be found elsewhere [6]. It is recognized that theGandεassumptions may provide inadequate descriptions with alkali content, but it seems to represent only an approximation. In such assess-ment is considered the “frozen in” of the glass structure, and consequently its physical properties, asGandε, assumed only as compositional-dependent.
The variation of activation enthalpyEAwith alkali content
over such different glasses are shown in Figs. 3a-b, and these data correspond to the same experimental data in Figs. 1a-b. A careful analysis was carried out in all data to find some
pos-(a)
0 5 10 15 20 25 30 35 40 45 50 0.2
0.4 0.6 0.8 1.0 1.2
E
A
(
e
V
)
Rb
2
O (mole%)
Blank
Charles
Evstropiev & Pavlovskii
Frischat & Schutz
Hakim & Uhlmann
Negodaev et al.
Otto & Milberg E
A
E
b
E
s
(a)
(b)
0 5 10 15 20 25 30 35 40 45 50 0.2
0.4 0.6 0.8 1.0 1.2
E
A
(
e
V
)
Cs
2
O (mole%)
Blank
Charles
De Marchi et al.
Hakim & Uhlmann
Negodaev et al.
Otto & Milberg
Terai
Wakabayashi et al.
E
A
E
b
E
s
(b)
FIG. 3: a) Non-linear fit (full line) on activation enthalpiesEAfrom
various authors of Rb2O-SiO2(a) and Cs2O-SiO2(b) systems con-sidering McElfresh & Howitt proposal (Eq. (2)). Ebis the binding
energy (dashed line), andEsis the strain energy (dotted line).
sible discrepancies on the scattering. For example, the activa-tion enthalpiesEAin both systems which have been measured
by Negodaevet al. [25] differ considerably from others, but were also considered from a statistical point of view.
Besides some scatter, effects of glass composition on EA
could be parametrized by the A-S theory. This model could even be applied in alkali silicate glasses to predict, for exam-ple, the dependence ofEA with alkali content (Figs. 3a-b).
The A-S model calculations ofEAgives a better agreement at
medium range alkali content and the departure is notable at lower and higher alkali content. In fact, the scattering values inEA should correspond to chemical and/or thermal history,
more than by measurement procedure. Indeed, Figs. 3a-b are dealing with with different structures considering a fixed al-kali composition, as shown below.
With regard to the fitting procedure – following McElfresh & Howitt’s suggestion – the radii values were considered fixed (rRb= 1.48 ˚A andrCs= 1.69 ˚A for rubidium and cesium ions, respectively, withrO= 1.4 ˚A, see Figs. 3a-b, full line). The
fitting parameters (for both systems) were the doorway radius and the jumping distance, that resulted inrD= 1.1 ˚A andrD
TABLE I: Linear fittings from experimentalGandεdata of rubidium and cesium silicate systems [6]. System G0(GPa) dG/dn(GPa/mol %)
ε0 (1) dε/dn (2)
References
Rb 24.6±1.7 0.315±0.060 5.30±0.19 0.075±0.010 [24, 26-30, 46] Cs 20.46±0.69 0.287±0.027 4.83±0.33 0.109±0.017 [21, 26, 29-30, 47-48]
resulted in 0.26 and 0.23 (a = 2.14;b= 2.5 in the rubidium case, anda= 2.41;b= 3.18 in the cesium case) respectively.
The adjustment for activation enthalpiesEA in Figs. 3a-b
were performed using a Levenberg-Marquardt non-linear fit-ting. It is surprising that a simple theory could adjust data from several authors with different glass preparation processes in a wide range of compositions. Significantly,Ebdecreases
with increasing alkali oxide in both results of Figs. 3a-b. One reason concerns with the relative dielectric permittivityε, that increases with increasing alkali oxide. Figs. 3a-b also show that Es is equal to or higher thanEb considering McElfresh
and Howitth proposal [7]. In particular,Es is higher
consid-ering cesium silicates probably due to high Cs+ionic radius, and makes sense from a structural point of view. It is im-portant to note that the A-S model is limited to onlyonesite energy distribution and with fixedrDto all composition range.
However, the model reasonably agrees with with experimen-tal data, describingEAdecreasing tendency with alkali oxide
composition. The main difference between this and the previ-ous results [6] concerningEAis related to theλparameter.
B. Experimental Correlation between Conductivity and Free Volume
The modified Arrhenius plots of σ for the 22 rubidium and 21 cesium silicate glasses, from x = 4 to 45 mol% in both systems), ranging from 7.9×10⁻² Ω−1cm−1 to 1.9×10⁻¹⁴Ω−1cm−1in rubidium and 2.3
×10−1Ω−1cm−1to 2.9×10⁻¹⁶ Ω−1cm−1in cesium systems, all between 20oC
to 450oC were previously presented [6]. In such work, the
range of activation enthalpyEAlies between 0.61 and 1.15 eV
(rubidium) and 0.62 and 1.18 eV (cesium) in all glasses stud-ied, as indicated in Figs. 3a-b. These data were compared with the ‘universal’ equation usingσ0= 50Ω−1cm−1in Eq. (1). Following previous works by Nascimentoet al[12-15], such “universal” equation was also found, with few data exceptions [23, 25].
In fact, in view of many different binary alkali silicate glasses according to Ref. [6] it is remarkable that there is so strong correlation betweenσwithEA/kBT. It is interesting to
note that the increase in ionic conductivity with alkali content is almost entirely due to the fact that the activation enthalpy EArequired for a cation jump decreases, as presented in Figs.
3a-b. Thus, the termσ0in Eq. (1) is largely unaffected upon alkali content.
As evidenced by the intercept ofσat infinite temperatures (1/T = 0) from Eq. (1), and presented by Ngai & Moyni-han considering many systems [49],σ0reaches approximately
≈ σ0= 50Ω−1cm−1indenpendently of the circumstance if the material is an ionic crystal or a molten ionic glass former. Using the electrical-field Maxwell relaxation timeτdefined by the relation:
σ=εf reeε∞
τ , (4)
whereεf reeis the dielectric permittivity of free space,ε∞is the
high-frequency dielectric constant typically having a order of magnitude of 10, andσis the DC electrical conductivity, one finds that the limiting high temperature conductivityσ0 cor-responds to a relaxation time of about 10−13s, and a corre-sponding frequencyν=1/(2πτ)≈2×1012Hz The latter value is close to the vibrational frequency of mobile ions in glasses. Thus, from theory it is possible to expect a pre-exponential fixedσ0value.
Another “universal” curve, following Eq.(3) and consider-ing some binary alkali silicate glasses, resulted in the same ‘universal’ behaviour [6, 12-15], as cited above. The pre-exponential value wasσ’0= 50 000 K/Ω·cm. The conclusions for this case also follow the above described considering Eq. (1), which means that pre-exponential factor is independent of temperature, or at least weaker-dependent. The fact thatσ lies on this single ‘universal’ curve for many ion-conducting glasses means thatσis governed mainly byEA.
In order to investigate the possibility of another general re-lation between ionic conductivity and the volume occupied by the network skeleton, the author calculated the expansion (Vm−V)/V of glass network, whereV andVmare the
calcu-lated volume network of SiO2 forming units and the experi-mental molar volumes, respectively. As shown in Figs. 2a-b, the dopant Rb2O (or Cs2O) added increases the experimen-tal molar volume before occupied by SiO2. The volume of pure silica was assumed as 27.23 cm3/mol. The difference Vm−V increases slightly and could be considered as
propor-tionalto the free volume, following similar procedure done by Swenson & B¨orjesson [8]. This is a rather rough approxi-mation: the increase in molar volumes of Rb2O or Cs2O units is the main factor involved in the increasing in conductivity and also in free volume. Thus, the free volume defined here is a macroscopic quantity. The necessary condition for ion transport may rather be the presence of microscopic pathways available for alkali ions. A given material may be called ‘con-ductive’ if it is equipped with ample ionic pathways, irrespec-tive of the amount of the free volume. Better approximation of free volume could be provided using positron annihilation spectroscopy, as recently published [50].
(a)
0.2 0.3 0.4 0.5 0.6 0.7 0.8
-18 -16 -14 -12 -10 -8 -6
l
o
g
1
0
T
(
K
/
.
c
m
a
t
2
0
o
C
)
F
1/3
(cm/cm at 20
o
C) Blank
Charles
Evstropiev & Pavlovskii
Frischat & Schutz
Hakim & Uhlmann
Negodaev et al.
Otto & Milberg (a)
(b)
0.2 0.3 0.4 0.5 0.6 0.7 0.8
-18 -16 -14 -12 -10 -8 -6
l
o
g
1
0
T
(
K
/
.
c
m
a
t
2
0
o
C
)
F
1/3
(cm/cm at 20
o
C)
Blank
Charles
De Marchi et al.
Hakim & Uhlmann
Negodaev et al.
Otto & Milberg
Terai
Wakabayashi et al. (b)
FIG. 4: Measured ionic conductivityσat 20oC versus the cubic root of expansion of glass networkF calculated from density measure-ments at same temperature for rubidium (a) and cesium (b) silicate glasses, respectively.
An outstanding common relation between the conductivity (at room temperature) and the cubic root of free volume F = (Vm−V)/V calculated from molar volumes at same
temper-ature is evident; i.e., for a given expansion all the different systems respond with the same increase onσ, regardless of chemical (such as relative water content) or microstructural details (such as phase separation). Note that data in Figs. 4a-b represent σT values that vary by more than 11 orders of magnitude in both systems. The relation found is notexactly linear, what could suggest that the conductivity is a bit depen-dent on the number of mobile ions than on the free volume itself (e.g., there is a stronger interaction between cations at high ion content, near the 50A2O·50SiO2mol% composition, A=Rb,Cs).
The common behavior of the conductivity increase with expansion of the network structure observed for the various binary rubidium and cesium glasses suggests that the excess volume introduced by the dopant is an important parameter that influences the conductivity properties, as expressed by Eq. (3). Thus, at first sight it appears that the details of the microscopic structure have direct impact on the ionic conduc-tivity in this system. For example, it should be noted that the
(a)
0.3 0.4 0.5 0.6 0.7 0.8
24 28 32 36 40 44 48
E
A
/
k
B
T
(
e
V
/
e
V
a
t
2
0
o
C
)
F
1/3
(cm/cm at 20
o
C) Blank
Charles
Evstropiev & Pavlovskii
Frischat & Schutz
Hakim & Uhlmann
Negodaev et al.
Otto & Milberg (a)
(b)
0.3 0.4 0.5 0.6 0.7 0.8
24 28 32 36 40 44 48
E
A
/
k
B
T
(
e
V
/
e
V
a
t
2
0
o
C
)
F
1/3
(cm/cm at 20
o
C)
Blank
Charles
De Marchi et al.
Hakim & Uhlmann
Negodaev et al.
Otto & Milberg
Terai
Wakabayashi et al. (b)
FIG. 5: Correlation between the experimental activation enthalpy for ionic conductivityEAand the volume fractionFestimated from
den-sity measurements considering a fixed temperature of 20oC for
ru-bidium (a) and cesium (b) silicate glasses, respectively.
microscopic interactions (mainly mechanical and dielectrical, as predicted by the Anderson-Stuart theory) lead to variations of the degree of expansion. For this reason, in order to ex-plain the conducting properties and the increase of the ionic conductivity with alkali content the A-S theory was focused. The present finding on the common scaling between the con-ductivity enhancement and the expansion suggests that the ex-pansion of the glass skeleton and therefore the strain energy partEshave influence on the conduction properties in this
sys-tem.
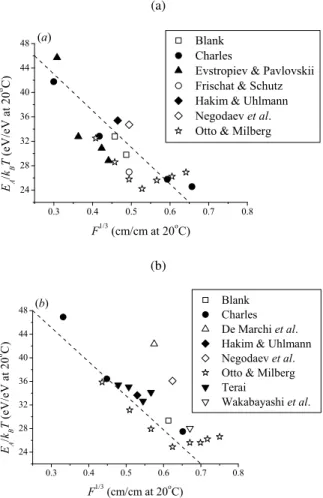
Finally, Figs. 5a-b shows that an increase in volume frac-tion reduces the activafrac-tion enthalpy for an ionic jump (con-sidering a fixed temperatureT = 20oC), which demonstrates
thatEA/kBT varies roughly with the cube root of the volume
fractionF. Thus, this approach, besides not linear (as the pre-vious figure), emphasizes the importance of “free volume” to the ion mobility, and is roughly related to the strain energy term,Es, that showed a proeminent role in theEAcalculation
IV. CONCLUSIONS
A simple relation between the increase in ionic conduc-tivity and the expansion of the glass network skeleton was presented for very different binary rubidium and cesium sil-icate glasses. The results show that an open structure with excess free volume can easily improveσ. Thus, the approach presented here could be considered valid, relating ionic con-ductivity with the “expansion of the glass network” (or the
“free volume”) partially originated from the conduction path-ways. By other way, the McElfresh and Howitt proposal on A-S model showed more influence onEs (the strain energy
term), and consequently on the free volume available.
Acknowledgements
This work was supported by FAPESP Brazilian Funding Agency (grant no.04/10703-0).
[1] C. A. Angell, Ann. Rev. Phys. Chem.43, 693 (1992).
[2] D. Ravaine and J. L. Souquet, Phys. Chem. Glasses 18, 27 (1977).
[3] K. Funke, Prog. Solid State Chem.22, 111 (1993).
[4] O. L. Anderson, and D. A. Stuart, J. Am. Ceram. Soc.37, 573 (1954).
[5] A. Bunde, M. D. Ingram, and P. Maass, J. Non-Cryst. Solids 172/174, 1222 (1994).
[6] M. L. F. Nascimento, E. do Nascimento, and S. Watanabe, Braz. J. Phys.35, 626 (2005).
[7] D. K. McElfresh and D. G. Howitt, J. Am. Ceram. Soc.69, C237 (1986).
[8] J. Swenson and L. B¨orjesson, Phys. Rev. Lett.77, 3569 (1996). [9] S. Adams and J. Swenson, Phys. Chem. Chem. Phys.4, 3179
(2002).
[10] J. Swenson and S. Adams, Phys. Rev. B64, 024204 (2002). [11] S. Adams and J. Swenson, Solid State Ion.154/155, 151 (2002). [12] M. L. F. Nascimento and S. Watanabe, J. Mater. Sci.40, 5079
(2005).
[13] M. L. F. Nascimento and S. Watanabe, J. Mat. Sci.40, 4423 (2005).
[14] M. L. F. Nascimento, E. do Nascimento, and S. Watanabe, Mat. Chem. Phys.96, 55 (2006).
[15] M. L. F. Nascimento and S. Watanabe, Braz. J. Phys.36, 795 (2006).
[16] K. Blank, Glastech. Ber.39, 489 (1966).
[17] G. H. Frischat, and H. -E. Schutz, Glastech. Ber. 49, 162 (1976).
[18] G. Marchi, P. Mazzoldi, and A. Miotello, Proc. XVth Intern.
Congr. on Glass, Leningrad, 231 (1989).
[19] K. Matusita and S. Sakka,Proc. XthIntern. Congr. on Glass, Kyoto, 44 (1974).
[20] H. Wakabayashi, R. Terai, and H. Watanabe, J. Ceram. Soc. Jpn.94, 677 (1986).
[21] R. J. Charles, J. Am. Ceram. Soc.49, 55 (1966).
[22] R. M. Hakim, and D. R. Uhlmann, Phys. Chem. Glasses8, 174 (1967).
[23] K. K. Evstropiev, and V. K. Pavlovskii, Neorg. Mater.3, 673 (1967).
[24] S. V. Nemilov, Zh. Fiz. Khim.47, 1479 (1973).
[25] G. D. Negodaev, I. A. Ivanovand, and K. K. Evstropiev, Neorg. Mater.8, 342 (1972).
[26] K. Matusita, S. Sakka, A. Osaka, N. Soga, and M. Kunugi, J. Non-Cryst. Solids16, 308 (1974).
[27] K. Otto, and M. E. Milberg, J. Am. Ceram. Soc.51, 326 (1968). [28] K. Takahashi and A. Osaka, J. Ceram. Soc. Jpn.91, 116 (1983). [29] R. Terai, J. Ceram. Soc. Jpn.77, 318 (1969).
[30] R. Terai, J. Non-Cryst. Solids6, 121 (1971).
[31] A. K. Agarwal and D. E. Day, J. Am. Ceram. Soc.65, 111 (1982).
[32] Z. D. Alekseeva,Khimiya Redkikh Elementov, Leningrad, 122 (1964).
[33] C. Brosset,Trans. VIIIthIntern. Ceram. Congr., Copenhagen, 15 (1962).
[34] M. Daemgen and G. H. Frischat, Glastech. Ber.56, 281 (1983). [35] N. Kassis and G. H. Frischat, J. Am. Ceram. Soc. 64, C28
(1981).
[36] G. L. McVay and D. E. Day, J. Am. Ceram. Soc.53, 508 (1970). [37] H. Nasu, O. Sugimoto, J. Matsuoka, and K. Kamiya, J.
Non-Cryst. Solids,182, 321 (1995).
[38] L. Sasek and A. Lisy, Sb. Vys. Sk. Chem. Technol. Praze, Chem. Technol. Silik.2, 217 (1972).
[39] Yu. A. Shmidt and Z. D. Alekseeva, Zh. Prikl. Khim.37, 2299 (1964).
[40] B. Tischendorf, C. Ma, E. Hammersten, P. Venhuizen, M. Pe-ters, M. Affatigato, and S. Feller, J. Non-Cryst. Solids,239, 197 (1998).
[41] Z. D. Alekseeva, Neorg. Mater.10, 902 (1974).
[42] A. Osaka and K. Takahashi, J. Ceram. Soc. Jpn,90, 703 (1982). [43] K. Otto and M. E. Milberg, J. Am. Ceram. Soc.50, 513 (1967). [44] G. B. Rouse, E. I. Kamitsos, and W. M. Risen, J. Non-Cryst.
Solids,45, 257 (1981).
[45] A. I. Vasiliev and A. A. Lisenenkov, Fizika i Khimiya Stekla,8, 546 (1982).
[46] J. E. Shelby and D. E. Day, J. Am. Ceram. Soc.53, 182 (1970). [47] E. M. Amrhein, Glastech. Ber.36, 425 (1963).
[48] R. M. Hakim and D. R. Uhlmann, Phys. Chem. Glasses14, 81 (1973).
[49] K. L. Ngai and C. T. Moynihan, Mat. Res. Soc. Bull.23, 51 (1998).
![FIG. 1: Arrhenius plots of ionic conductivities in 22 and 21 binary rubidium (a) and cesium (b) silicate glasses, respectively [16-30].](https://thumb-eu.123doks.com/thumbv2/123dok_br/18982617.457604/2.892.489.824.76.528/arrhenius-conductivities-binary-rubidium-cesium-silicate-glasses-respectively.webp)
![Table 1 summarizes the obtained G and ε values from lin- lin-ear fittings. More details about G and ε fittings could be found elsewhere [6]](https://thumb-eu.123doks.com/thumbv2/123dok_br/18982617.457604/3.892.95.430.77.517/table-summarizes-obtained-values-lin-fittings-details-fittings.webp)
![TABLE I: Linear fittings from experimental G and ε data of rubidium and cesium silicate systems [6].](https://thumb-eu.123doks.com/thumbv2/123dok_br/18982617.457604/4.892.115.800.106.200/table-linear-fittings-experimental-rubidium-cesium-silicate-systems.webp)