DOI: 10.1590/1808-057x201804270
Original Article
Private pension funds: passivity at active fund prices
Carlos Heitor Campani
Universidade Federal do Rio de Janeiro, Instituto COPPEAD de Administração, Departamento de Finanças e Controle Gerencial, Rio de Janeiro, RJ, Brazil
Email: [email protected]
Leonardo Mesquita de Brito
Universidade Federal do Rio de Janeiro, Instituto COPPEAD de Administração, Departamento de Finanças e Controle Gerencial, Rio de Janeiro, RJ, Brazil
Email: [email protected]
Received on 09.09.2016 – Desk acceptance on 09.22.2016 – 3rd version approved on 07.12.2017 – Ahead of print on 11.06.2017
ABSTRACT
From 2005 to 2015, the total assets managed by open private pension funds increased more than six times in Brazil, where the Free Benefi t Generating Plan (PGBL) and the Free Benefi t Generating Life (VGBL) represent 90% of these assets. However, private pension institutions are characterized by the collection of high management fees, thus keeping for themselves much of the benefi ts off ered by the government as incentive for investment in this modality. High management fees are justifi ed only when there is active management of these funds, theoretically generating higher performance: this study indicates that this is not the case in this market segment. Similar problems have been faced in other countries, such as the United Kingdom, Denmark, and Sweden, which fi led investigation concerning funds that charge high management fees for active management, while they actually provide management that may be regarded as passive. Th is demonstrates the scale and relevance of this issue, which has been surveyed and addressed by this study. To do this, dynamic style analysis was performed, through rolling regressions, followed by Kalman fi lter analysis in funds from the top-fi ve private pension institutions in Brazil. Analyzing the exposure evolution of these funds to various asset classes and the R2 generated, passivity traces were found, mainly in
composite variable income funds. Such funds are precisely those that should be more actively managed, as they charge the highest management fees. Th is article also demonstrates it is possible to build a passive portfolio, having a very similar style and returns without statistically signifi cant diff erences, but at a lower management fee (and aligned with passive funds).
Keywords: private pension, investment strategy, style analysis, Kalman fi lter, passive funds.
Correspondence address:
Carlos Heitor Campani
Universidade Federal do Rio de Janeiro, Instituto COPPEAD de Administração Rua Pascoal Lemme, 355 – CEP: 21941-616
1. INTRODUCTION
Th e open private pension market has been growing consistently in Brazil for at least 10 years, at an average rate of 20% per year (p.y.), reaching the mark of R$ 500 billion in 2015, according to data provided by the Brazilian National Federation of Private Pension and Life (FenaPrevi). In this market, plans known as the Free Benefi t Generating Plan (PGBL) and the Free Benefi t Generating Life (VGBL) have become very popular and they currently account for 90% of the sector, making up almost all new products. Such private pension plans have advantages over traditional investment funds. For instance, the Brazilian income tax (IR) is deferred for redemptions only (as opposed to quota-eaters from traditional funds) and there is the possibility of using a much more generous regressive IR chart with long-term investors. Such plans are also structured as Brazilian specially constituted investment funds (FIEs); more details can be found in Campani and Costa (2016).
Th e focus of this article lies precisely on this class of assets that has increasingly stood out among the investment alternatives in the Brazilian market: private pension funds. More specifi cally, we analyze the FIEs of PGBL and VGBL private pension plans from the fi ve largest institutions in terms of equity in Brazil. In general, private pension institutions have the characteristic of collecting high management fees in their funds. Th e average value for fi xed income pension funds in these institutions is 2% p.y., mainly for small investors, with up to R$ 100,000 invested. Th ese fees are only justifi ed if there is active management of
these funds, theoretically generating higher performance. Broadly reported by major newspapers, such as the well-known and reputed Financial Times (reports available upon request to authors), some European countries, led by Sweden, have recently begun to investigate funds that charge high management fees for active management while they actually provide management that may be regarded as passive, replicating the performance of market indexes already known. Debate on this issue, either in the academia or in international regulatory bodies, has been growing and, according to the Financial Times, pressure on these funds, named as closet trackers, begins to gain momentum across Europe.
So, the purpose of this paper is shedding light and introduce the debate in Brazil, through dynamic style analysis based on private pension funds’ return in Brazil, in order to evaluate the dynamic exposures of these funds to the main asset classes in the Brazilian market. Th us, it is possible to discuss whether private pension funds have been meeting what investors expect, either in terms of performance above a passive benchmark or in terms of fees charged in relation to the fund’s activity level, or in terms of compliance with self-declared strategies (i.e. relation between variable income and fi xed income in their portfolios).
Th e next section presents a brief theoretical framework with a literature review that supports this research. Subsequently, we introduce the methodology, as well as the data used, and then we present the results, analyses, and conclusions.
2. THEORETICAL REFERENCE AND LITERATURE REVIEW
2.1. Private Pension Funds
Private pension funds have a special tax treatment in Brazil, with peculiar advantages when compared to non-pension funds. For instance, the absence of quota-eaters, deferring the IR for redemptions only, the possible restitution of an IR portion paid at the source, and the exclusive IR chart, allowing a rate of only 10% in the long term, are benefi ts that make such funds highly attractive to long-term investors. Campani and Costa (2016) analyze these benefi ts and compare pension funds to non-pension funds, evidencing (and quantifying) the high value of these benefi ts. On the other hand, they
emphasize that loading and management fees of pension funds are still (much) higher than those of non-pension funds, something which ultimately undermines the net profi tability of such funds. Th is confi rms the study by Amaral (2013), which concludes that non-pension funds have higher performance; in other words, a part of the tax gains does not reach the investor.
funds have everything to gain even more recognition in the Brazilian investment scenario. According to a regulation by the Brazilian Superintendency of Private Insurance (SUSEP), a pension fund may declare itself conservative (having 100% of its quotas invested in fi xed income) or composite, investing up to 49% in variable income. Th us, all institutions that off er pension funds are conservative, moderate, and aggressive, indicating the degree of investment in variable income, from 0% (conservative) to 49% (aggressive), or less, according to their own strategy.
For this study, we selected PGBL and VGBL funds from the fi ve main fi nancial institutions in Brazil. Since the objective is conducting style analysis, in order to ascertain the degree of activism in each fund, funds’ profi tability have been recomposed to transaction costs (i.e. full). Th is is because the costs might generate unnecessary noise in the analysis, as the objective is fi nding out which asset classes and how much they contribute to funds’ profi tability.
2.2. Return-Based Style Analysis
2.2.1 Th e return-based style analysis proposed by William F. Sharpe.
According to Varga and Valli (1998), pioneers in the introduction of style analysis in Brazil, the classifi cation of investment funds available in the market as for exposure to various asset classes – each carrying a diff erent type of risk – is an extremely important problem for investors. Th ey need to know the sources of risk and the resource allocation strategies to which their investment portfolios are exposed, in order to form optimal portfolios for each diff erent profi le.
To solve this problem, Sharpe (1988, 1992) proposed a statistical approach that compares the return series of the fund under analysis to return series of several indexes, representing the asset classes to which the fund might be exposed. Th e methodology proposed by Sharpe (1992), the return-based style analysis (RBSA), consists in using a model of asset class factors. Th e generic representation of a factor model may be:
1
where R1 represents the return of fund i, F1 represents the value of factor 1, F2 the value of factor 2, Fn the value of the nth (last) factor, and e1 the component of return that is not explained by the factors. Th e bij represents the sensitivities of R1 to the factors Fj. All these values are not known before the fact, so the use of tis.
Sharpe (1992) regards his methodology as an individualization of this type of generic factor model. In the model proposed by him, each factor represents an asset class’ return. Th e sensitivities, in order to represent the weights of these classes in the portfolio, must add up to 100% and individually they must be between 0% and 100% (assuming there is no short sale). Th us, the return of a fund i would be represented by the return of a portfolio invested in n asset classes – a return which is given by the sum in brackets of equation 1 plus a residual component (e1). He still interprets this sum in brackets as representing the fund’s style, while the residual might be attributable to the specifi c and dynamic (i.e. active) selection of the assets.
Over time, several studies have started to use and improve the technique proposed by Sharpe (1988, 1992). More specifi cally in Brazil, we may cite some major works, such as: Amaral (2013), Linhares (2003), Marques (2006),
Nunes (2015), Varga and Valli (1998), and Yoshinaga, Castro Jr., Oda and Lucchesi (2009). Among the authors who have used variations and improvements of the RBSA in Brazil, we may mention Marques, Pizzinga and Vereda (2012), Pizzinga, Vereda, Azevedo and Fernandes (2012), and Schutt and Caldeira (2014), who used a more advanced methodology: the Kalman fi lter, applied to style analysis to determine how fund exposures to asset classes of vary over time. Th is methodology is detailed below, since it is used by this study.
2.2.2 Return-based dynamic style analysis.
Using the technique proposed by Sharpe (1988, 1992), several problems and attempts to correct them have been emerging. One of the major drawbacks of using the style analysis proposed by the author is that it implicitly assumes that the class exposure style is constant over time. Exactly for this reason, Fung and Hsieh (1997) explain that simple RBSA does not work so well when applied in active funds. Th e turnover of exposures to the various asset classes is high and, precisely because of this, they are able to stand out in terms of performance.
In the literature on the subject, there were several approaches to make the RBSA dynamic. One of the most ~
~ ~
~ ~
~ ~
~
used, and perhaps also the simplest one, takes place through the use of movable windows. A window size is arbitrated – Lhabitant (2009), for instance, proposes to divide the analysis period into two – and the analysis takes place within this period. Next, such a window is ‘rolled’ a time interval forward and the analysis for this period is replicated, repeating this procedure to the end. Among the authors who have used this technique in their studies there are Gibson and Gyger (2007), Holmes and Faff (2008), Linhares (2003), Marques (2006), Marques, Pizzinga and Vereda (2012), and Varga and Valli (1998).
However, Markov, Mottl and Muchnik (2004) highlight a major problem in attempting to capture the dynamics of allocation across asset classes through movable windows: the technique does not do well with structural breaks, since it over-smoothes transitions, taking a long time to fully capture them. Th e methodology most frequently used in the literature to deal with this problem consists in modeling it as a state space, using some method to estimate the unknown parameters, and a recursive algorithm to estimate the states. Among the options, the
most frequently used and consolidated in the literature is the Kalman fi lter, which is the method used in this paper and, therefore, described in greater detail below.
2.3 State Space Modeling
State space modeling is only a convenient notation to make it easier to understand and estimate stochastic models where measurement errors are assumed in the system, thus it may be used for many time series models. Among the main works in this fi eld, those by Durbin and Koopman (2012) and Harvey (1990), among others, stand out.
Specifi cally in the proposal to turn the model by Sharpe (1992) into exposures that are totally dynamic, the objective becomes determining the weights of each index that represents the asset classes in each time interval
t. Th us, we may rewrite the model by Sharpe (1992) generically, with exposures explicitly varying in time, as follows:
2
3
4
for every i = 1, 2, ..., n and t = 1, 2,…, m. Above, Ri,t represents return of the fund or the indexes analyzed within period
t and α is the factor that represents the return that would not be correlated to the indexes and it would measure the manager’s ability. In this study, such an α factor is modeled dynamically over time in the form of a random walk without drift . Th is choice is justifi ed, according to Pizzinga, Vereda and Fernandes (2011), for three reasons: parsimony and simplicity, because it allows the possibility of key changes in the manager’s selectivity, due to non-stationarity, and because it is not ‘explosive.’ Th e coeffi cients βi,t represent exposures to the indexes representing the n asset classes at time t. According to equation 4, these exposures are modeled as fi rst-order stationary autoregressive processes (the condition of 0 < Φi <1 was not restrictive throughout this research, because the coeffi cient values fell naturally in this interval).
As this article aims to analyze private pension funds and they have constraints regarding leverage, the portfolio constraint proposed by Sharpe (1992) has to be modeled, i.e. exposures should add up to 100%. To do this, we just need to reparametrize the beta values. Th e exact procedure is detailed later.
As for the second constraint proposed by Sharpe (1992), i.e. non-negativity of exposures, according to Swinkels and Van Der Sluis (2002), it is generally not necessary. Th e authors argue that using these constraints may lead to inconsistent parameter estimates, when sold positions are allowed, indeed. In the case of open supplementary pension funds, according to Resolution no. 3,308, enacted on August 31, 2005, from the Central Bank of Brazil (BACEN), up to 10% of the assets may be invested in funds classifi ed as exchange, in addition to 15% in multimarkets, which may have positions sold in any of the Brazilian market
R
���= α
�+ β
�,�. R
�,�+ ⋯ +β
�,�. R
�,�+ ε
�,
ε
�~N(0, σ
��)
α
���= α
�+ ξ
�,���,
ξ
�,�~N�0, σ
�,���
β
�,���= ϕ
�. β
�,�+ ξ
�,���,
with 0 < ϕ
�< 1 � ξ
�,�~N�0, σ
�,���
R
���= α
�+ β
�,�. R
�,�+ ⋯ +β
�,�. R
�,�+ ε
�,
ε
�~N(0, σ
��)
α
���= α
�+ ξ
�,���,
ξ
�,�~N�0, σ
�,���
β
�,���β
�,���= ϕ
= ϕ
�. β
�. β
�,��,�+ ξ
+ ξ
�,����,���,
,
with 0 < ϕ
with 0 < ϕ
�< 1 � ξ
�< 1 ��� ξ
�,�~N�0, σ
�,�~N�0, σ
�,���
�,�asset classes. Th erefore, in this study no constraints are used concerning negative exposures.
2.4 Kalman Filter
As Lhabitant (2009) claims, if index exposures can vary over time, this variation must be explicitly modeled, as opposed to simply using movable windows, assuming they are constant along the window. In this case, the fi lter proposed by Kalman (1960) represents the most natural and indicated technique, since, for instance, it allows the most effi cient use of available information. In fact, the fi lter proposed by Kalman (1960) seems to show empirical superiority over other methods. Th e only reason why it has not taken the place of traditional style analysis yet, is its complexity, both in terms of understanding and implementation (Lhabitant, 2009).
Th e fi lter proposed by Kalman (1960) is primarily a recursive prediction and correction algorithm. In a simplifi ed way, the algorithm predicts a new state (containing all the information available to date) that starts from the previous state and it is corrected by a term
proportional to the previous prediction error, in such a way that the current error is statistically minimized. Under the normality premise of the model’s error terms, it becomes possible to calculate the prediction error’s likelihood function, through which the model’s unknown parameters are estimated.
If it is more adequate to use all the information available in the sample to estimate the state at a particular point in time, and not only the information available up to that point, the issue is named as smoothing problem. In other words, the diff erence is that the fi lter is conditional on information up to time t, therefore it is more suitable for prediction (i.e. out-of-sample), while smoothing is conditional with regard to the information contained in the whole sample, thus it is more adequate for descriptive purposes and ex-post (in-sample) analysis, which is the case of this study.
For the sake of brevity and space, equations from the fi lter proposed by Kalman (1960) will not be shown in this article, but they can be found in Durbin and Koopman (2012) with more information on derivations of the fi lter proposed by Kalman (1960).
3. DATA AND METHODOLOGY
In Brazil, selecting representative indexes for asset classes is oft en no easy task. Several authors who have already performed style analysis in Brazil have faced this issue, among them Linhares (2003), Marques (2006), Schutt and Caldeira (2014), and Varga and Valli (1998). As this study investigates exposures to asset classes of private pension funds, fi rst it is worth checking which asset types the current legislation allows them to invest in. According to the Resolution no. 3,308/2005, from the BACEN, FIEs from the Brazilian open supplementary pension entities (EAPCs) may invest in the following segments: fi xed income, variable income, real estate (directly or through real estate funds), and exchange (through foreign exchange funds).
Th erefore, the selected indexes should seek to represent private pension fund exposures to these four market segments. Aft er a search for the main indexes widely disclosed in the Brazilian market, it was decided to choose, for the fi xed income market, the fi ve indexes below:
Anbima Market Index (IMA-B) 5 and IMA-B 5+: representing the assets linked to infl ation (Brazilian National Consumer Price Index – IPCA) in the short/medium and medium/long term;
Fixed Income Market Index (IRF-M) 1 and IRF-M 1+: representing the assets tied to the short and medium/long-term pre-rate;
Index consisting of the over interbank deposit (ID) rate (Brazilian Interbank Deposit Certifi cate – IDC): representing the exposure to ID funds.
For the variable income market, two indexes were initially chosen:
BOVESPA Index (IBOVESPA): representing
the highest and most traded stocks on the stock exchange;
Small Cap Index (SMLL) from the São Paulo Stock Exchange, Commodities and Futures (BM&FBOVESPA): representing the stocks from small companies traded on the stock exchange.
For the real estate market, we chose the Real Estate Investment Funds index (IFIX) from the BM&FBOVESPA and, fi nally, for the exchange market, the Ptax rate. Data concerning all indexes were collected from the Bloomberg®
platform and data from the private pension funds analyzed were collected from the Quantum Axis® platform.
relevance, in terms of equity managed by the institutions. Th erefore, the top-fi ve largest private pension institutions in Brazil, according to the FenaPrevi, are: Bradesco Vida e Previdência S.A., Brasilprev Seguros e Previdência S.A., Itaú Vida e Previdência S.A., Zurich Santander Brasil Seguros e Previdência S.A., and Caixa Vida e Previdência S.A. Th e institutions are henceforth named as Bradesco, Brasilprev, Itaú, Santander, and Caixa, respectively.
From each of these institutions, three funds were selected, representing three primary types: conservative, which only allows fi xed income investments; moderate, which allows 15-30% (depending on the institution) of variable income; and aggressive, which can invest up to 40-49% (depending on the institution) in variable income. So, the choice of funds from each institution was
based on equity under management and those chosen for analysis are displayed in Table 1. From here on, the funds are referenced by their corresponding numbers in Table 1.
In order to make the analysis period the same for all funds, since the start dates for disclosure of quotas are diff erent, the date chosen to begin the analysis of all funds was January 2009. Another reason for choosing that date was the fact it was already within the post-2008 crisis period. Th e end of the analysis period was April 2015. All data were collected at daily intervals through the management fee recomposition, in order to obtain a series of returns with eff ects exclusively related to exposures to the asset classes under analysis.
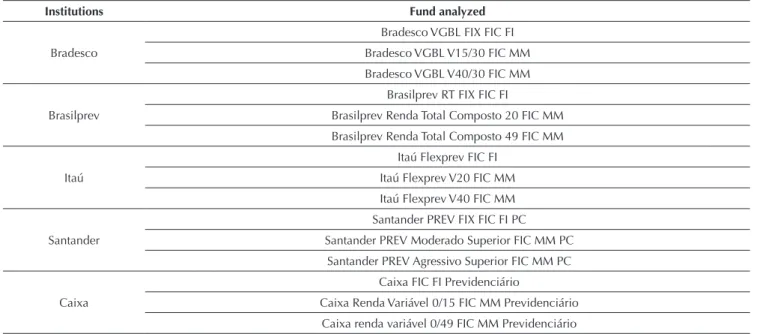
Table 1 Funds chosen for analysis
Institutions Fund analyzed
Bradesco
Bradesco VGBL FIX FIC FI Bradesco VGBL V15/30 FIC MM Bradesco VGBL V40/30 FIC MM
Brasilprev
Brasilprev RT FIX FIC FI
Brasilprev Renda Total Composto 20 FIC MM Brasilprev Renda Total Composto 49 FIC MM Itaú
Itaú Flexprev FIC FI Itaú Flexprev V20 FIC MM Itaú Flexprev V40 FIC MM
Santander
Santander PREV FIX FIC FI PC Santander PREV Moderado Superior FIC MM PC
Santander PREV Agressivo Superior FIC MM PC Caixa
Caixa FIC FI Previdenciário
Caixa Renda Variável 0/15 FIC MM Previdenciário Caixa renda variável 0/49 FIC MM Previdenciário p.y. = per year; PC = private credit; MM = multimarket; FI = fi xed income.
Source: Prepared by the authors.
Regarding the methodology, the dynamic style analysis of the funds selected was divided into two parts. In the fi rst and simpler analysis, the dynamic style analysis with movable windows is applied and the class indexes to be used in the later analysis, more complex and resorting to Kalman smoothing, are defi ned.
Starting with movable windows, an analysis is conducted for each pension fund, with all indexes representing asset classes previously selected. Th e size of the chosen window was six months: as the data used have a daily frequency, it was thought that six-month data might already be enough to have a reasonable sample size for analysis in each window. By means of this analysis, it is possible to verify, for each fund, which are the most relevant indexes.
For the next analysis step, only those indexes that exhibit signifi cantly diff erent non-zero exposure will be selected at some point in the analysis through movable windows. In this new step, analyzes will be done using Kalman smoothing in all selected pension funds. Th e choice of smoothing, rather than the fi lter proposed by Kalman (1960), was based on the argument by Swinkels and Van Der Sluis (2002), that smoothing is conditional on the whole sample, so it is more appropriate for descriptive purposes, which is precisely the objective of this study. Th e steps in this stage consist, for each fund, in:
1. Run the Kalman smoothing algorithm with all indexes selected from the previous step.
contribution to the explanation of fund’s return and take it out from the set of indexes for that fund. 3. Re-run the Kalman smoothing algorithm with
the new (smallest) set of indexes and check whether there were improved information criteria (Akaike information criterion – AIC),
Schwartz Bayesian information criterion (BIC), and mean squared error (MSE).
4. If there are improved indicators, go back to step 2 and go ahead; if there is no improvement, the previous model is selected.
4. ANALYSIS AND RESULTS
In this section, we present the results found according to the methodology proposed. In order not to aff ect the reading, the analysis is shown, when needed, only to the market leader institution (Bradesco) and full details of the analyses for the other funds are fully available with the authors.
4.1 Preliminary Analysis Via Movable Windows
Th e analysis begins with the full model (using all indexes representing asset classes) for all funds. As the IFIX only started to be disclosed since January 2011, a fi rst analysis was conducted using that initial date for all funds. Th e IFIX did not prove to be signifi cant in any analysis period for any of the funds, therefore it is the fi rst index to be discarded (we worked with a 95% confi dence interval).
Th e analysis was conducted without IFIX and having as initial date January 2009, as originally proposed. It was easy to see that no fund had a relevant exposure to the Ptax index. Consequently, it was decided to exclude the
Ptax index from the next analysis stage of all funds, as it did not contribute signifi cantly to explain their returns. Conservative funds also did not show signifi cant exposure to variable income, so the IBOVESPA and the SMLL were taken out of the next analysis stage for such funds. It is worth noticing that this result is totally in line with the fact that this is an exclusively fi xed income fund.
Th us, Table 2 displays the summary of representative indexes of the asset classes, which, therefore, were not excluded during the analysis through movable windows, i.e. the indexes used in Kalman smoothing analysis.
4.2 Kalman Smoothing Analysis
Table 2 Indexes chosen to start Kalman smoothing analysis
Funds analyzed Chosen indexes
IMA-B IMA-B 5+ IRF-M 1 IRF-M 1+ IDC IBOVESPA SMLL Ptax IFIX
1. Conservative Bradesco ✓ ✓ ✓ ✓ ✓
2. Moderate Bradesco ✓ ✓ ✓ ✓ ✓ ✓ ✓
3. Aggressive Bradesco ✓ ✓ ✓ ✓ ✓ ✓ ✓
4. Conservative Brasilprev ✓ ✓ ✓ ✓ ✓
5. Moderate Brasilprev ✓ ✓ ✓ ✓ ✓ ✓ ✓
6. Aggressive Brasilprev ✓ ✓ ✓ ✓ ✓ ✓ ✓
7. Conservative Itaú ✓ ✓ ✓ ✓ ✓
8. Moderate Itaú ✓ ✓ ✓ ✓ ✓ ✓ ✓
9. Aggressive Itaú ✓ ✓ ✓ ✓ ✓ ✓ ✓
10. Conservative Santander ✓ ✓ ✓ ✓ ✓
11. Moderate Santander ✓ ✓ ✓ ✓ ✓ ✓ ✓
12. Aggressive Santander ✓ ✓ ✓ ✓ ✓ ✓ ✓
13. Conservative Caixa ✓ ✓ ✓ ✓ ✓
14. Moderate Caixa ✓ ✓ ✓ ✓ ✓ ✓ ✓
15. Aggressive Caixa ✓ ✓ ✓ ✓ ✓ ✓ ✓
Note: The full funds’ names are available in Table 1.
IDC = Brazilian Interbank Deposit Certifi cate; IBOVESPA = BOVESPA Index; IFIX = Real Estate Investment Funds index; IMA = Anbima Market Index; IRF = Fixed Income Market Index; SMLL = Small Cap Index.
Source: Prepared by the authors.
Table 3 Result of iterative analysis via Kalman smoothing of the funds analyzed
Indicators Funds analyzed
1 2 3 4 5 6 7 8
IMA-B Index ✓ ✓ ✓ ✓ - - ✓ ✓
IMA-B 5+ Index - - - - ✓ ✓ -
-IRF-M 1 Index - - -
-IRF-M 1+ Index - - -
-IDC Index ✓ ✓ ✓ ✓ ✓ ✓ ✓ ✓
IBOVESPA - ✓ ✓ - ✓ - ✓
SMLL Index - - -
-Ptax Index - - -
-IFIX Index - - -
-R2 0.855 0.988 0.990 0.852 0.994 0.995 0.110 0.990
9 10 11 12 13 14 15
IMA-B Index ✓ ✓ - - ✓ ✓ ✓
IMA-B 5+ Index - - - -
-IRF-M 1 Index - - -
-IRF-M 1+ Index - - -
-IDC Index ✓ ✓ ✓ ✓ ✓ ✓ ✓
IBOVESPA ✓ - ✓ ✓ - ✓ ✓
SMLL Index - - -
-Ptax Index - - -
-IFIX Index - - -
-R2 0.996 0.098 0.960 0.980 0.753 0.985 0.987
Note: the funds are referenced by numbers according to Table 1.
IDC = Brazilian Interbank Deposit Certifi cate; IBOVESPA = BOVESPA Index; IFIX = Real Estate Investment Funds index; IMA = Anbima Market Index; IRF = Fixed Income Market Index; SMLL = Small Cap Index.
Source: Prepared by the authors.
Th rough the results presented in Table 3, we can see that all composite funds, i.e. those that also invest in variable income (moderate and aggressive), had high R2, varying from 96% to 99.6%. Th is demonstrates that
indexes from the fi nal Kalman smoothing analysis model can explain much of these funds’ returns. As pointed
out by Sharpe (1992), the value of R2 can also be used as
one of the means to measure the management activity level of a fund, while 1-R2 can be assigned to manager
selectivity. Th erefore, R2 levels as high as those found in
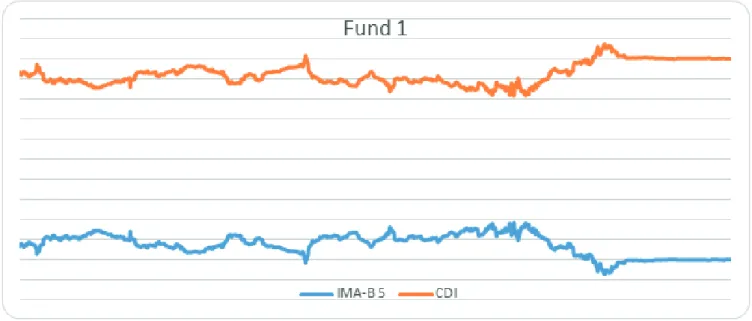
Figure 1 Final style analysis model via Kalman smoothing of fund 1. IDC = Brazilian Interbank Deposit Certifi cate; IMA = Anbima Market Index. Source: Prepared by the authors.
Among conservative funds, in funds 1, 4, and 13 relatively high R2were also found, about 75-85%,
indicating some passivity. However, in funds 7 and 10 it was not possible to fi nd similar evidence. It is worth noticing that Sharpe (1992) himself comments on this issue: if on the one hand, high R2 may be indicative of
passive management, on the other hand, low R2 does not
necessarily indicate active management, since it can be a result of bad model specifi cation or bad index choice representing the asset classes, for instance.
Indeed, in conservative funds, what might have occurred for a R2 at a lower level than the moderate or
aggressive ones is that the indexes chosen to represent the fi xed income market (IMA-B, IMA-B 5+, IRF-M 1, and IRF-M 1+) are, in fact, portfolios with securities having diff erent maturities. So, if conservative funds have diff erent durations (or they are concentrated in a few maturities), these portfolios can turn out to be bad proxies. Yet, then why did such indexes work well for moderate and aggressive funds? Th is is justifi ed by the fact that, with variable-income funds, returns’ variability increases sharply, and a generic fi xed-income index may work relatively well when compared to its explanatory power of conservative fund, which has much less variability.
Generally, the indexes that were most relevant and, therefore, chosen for the fi nal models were: IDC and a single index of infl ation-linked government securities (IMA-B or IMA-B+) for conservative funds, added to the IBOVESPA for the moderate and aggressive. Th is composition makes sense when we think of the primary purpose of private pension funds, which is providing fi nancial security for future retirement. Th us, a combination of fi xed-rate securities and some protection against infl ation, in order to obtain real profi tability, seems to be the strategy chosen by the main conservative pension funds.
Another signifi cant observation was that fi xed rate securities’ indexes did not seem relevant in any of the funds analyzed. A more active management of the fi xed-income part of these funds should necessarily involve active management of fi xed-rate securities, incorporating them into the portfolio when interest rates are high, for instance.
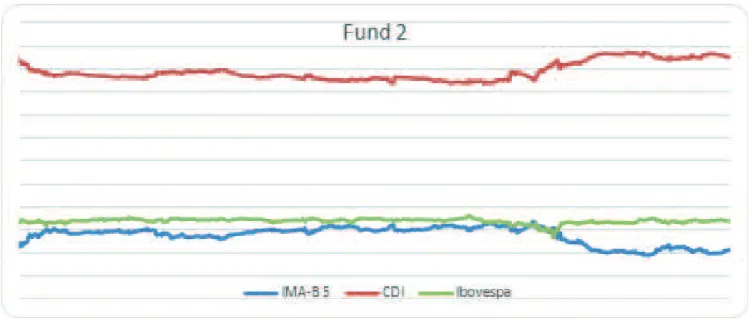
Figure 2 Final style analysis model via Kalman smoothing of fund 2.
IDC = Brazilian Interbank Deposit Certifi cate; IMA = Anbima Market Index; IBOVESPA = BOVESPA Index. Source: Prepared by the authors.
Figure 3 Final style analysis model via Kalman smoothing of fund 3.
IDC = Brazilian Interbank Deposit Certifi cate; IMA = Anbima Market Index; IBOVESPA = BOVESPA Index. Source: Prepared by the authors.
Interestingly, it is worth noticing in the fi gures that, in the second half of 2013 and the fi rst half of 2014, fi ltered (and smoothed) positions in IDC increase to the detriment of the position in IPCA-linked securities (this eff ect is most pronounced in fund 1, as it does not have a third position on the IBOVESPA). We conjecture that this movement occurred because the Brazilian economic situation at that time already showed signs of exhaustion, resulting in increased interest rates in the economy (to
Table 4 Management fees charged by institutions for the funds analyzed by this study for individual clients with an accumulated amount about R$ 100 thousand.
Institutions
Conservative funds (100% fi xed income)
(%)
Moderate and aggressive funds (with variable income)
(%)
PGBL VGBL PGBL VGBL
Bradesco 1 1.5 2 2
Brasilprev 1.5 1.5 2 2
Itaú 1.75 1.75 2.5 2.5
Santander 1.2 1.2 2 2
Caixa 1.5 1.5 1.5 1.5
PGBL = Free Benefi t Generating Plan; VGBL = Free Benefi t Generating Life.
Source: Prepared by the authors. 4.3 Additional Analyses
As we saw in the previous section, moderate and aggressive funds from the private pension institutions analyzed seem to maintain stable positions in variable income, and these positions also do not show signs of being actively managed, with the IBOVESPA managing to capture much of these funds’ return variance. Th ese composite funds charge higher management fees than conservative funds from the same institutions, i.e. they invest only in fi xed income. So, they were expected to be more active. However, what was observed in Kalman smoothing analyses was just the opposite: the R2 values
found for composite funds were quite high, indicating greater passivity.
In Table 4, we can observe diff erences between the management fees charged by each institution for the funds analyzed and for an accumulated amount of R$ 100,000. Th ese fees were collected through consumer services and information openly available on the institutions’ websites in July 2015, in order to be representative of ordinary individuals seeking to apply their funds to these pension
funds. Th erefore, there may be changes in the case of exclusive products, special customers, or subsequent to the collection of such data. We observe there is a diff erence between the management fee charged by composite funds (with variable income investments) and by conservative funds, except for the Caixa’s funds analyzed.
Th is situation of funds charging high management fees, theoretically in exchange for more active management, but delivering management that is actually passive or indexed, is not exclusive to Brazil. In Europe, this issue has been much discussed, both in the media and in the academia, even reaching some regulatory bodies.
In a recent Financial Times (“‘Closet tracker’ funds more than doubled in the UK” – June 14, 2015) it is stated that the number of funds that may be regarded as closet trackers in the United Kingdom has doubled within the last 12 months. Also according to a recent study by the SCM Research (Smart Common Sense Modern, 2015), over 1/3 of all funds in the United Kingdom are nothing more than expensive copies of index funds. All this demonstrates the scale and relevance of the issue to be faced and addressed by this study.
Th us, in order to deepen the analysis of this problem in Brazil, in this section, we conducted the study with a focus on composite funds, since they are those that charge higher management fees and had the strongest evidence of passivity. In addition, the conservative fund itself may be used as a benchmark of fi xed income investment, and in this way to verify if these composite funds can deliver higher performance to a simply passive portfolio consisting of a portion in the conservative fund from the institution added to a portion on the IBOVESPA.
Th e analysis was divided into two parts. Th e fi rst focuses on verifying whether these composite funds
4.4 Do Composite Funds Deliver Alpha?
In this subsection, we analyze if the composite funds studied are able to deliver alpha, i.e. a performance consistently above a passive portfolio consisting only of a portion in the conservative fund from the institution
under analysis added to a portion on the IBOVESPA. To do this, a test was performed through a regression using only conservative fund’s returns and the IBOVESPA without portfolio constraints, such as in a multifactor model. For this, the regression represented in equation 5 is used:
Table 5 Results of the test expressed by equation 5 (multifactor model conservative fund + BOVESPA Index)
Bradesco Brasilprev Itaú Santander Caixa
Fund 2 3 5 6 8 9 11 12 14 15
Annualized α (%) 0.429 1.162 -0.219 -0.443 -0.089 0.045 -0.795 -1.115 -1.392 -4.470 P value of α 0.2579 0.2507 0.3346 0.2852 0.7340 0.9241 0.1691 0.3683 0.0002 0.0001
Source: Prepared by the authors.
5
in which Rf,t represents return of the composite fund at time t, Rc,t represents return of the conservative fund at time t, just as Ra,t represents IBOVESPA return at time t, βc and βa represent exposures respectively to conservative
fund and the IBOVESPA, α is independent return of Rc,t, and Ra,t and et represent the error factor. Table 5 displays the results.
6
As we can observe in Table 5, with the exception of funds 14 and 15, p values indicate that none of the funds had statistically signifi cant alpha values at the 5% signifi cance level (not even 10%). For the specifi c cases of funds 14 and 15, both alpha values were statistically signifi cant, but negative. Th is suggests that composite funds are not able to generate alpha values related to the factors conservative fund + IBOVESPA or, when that is
the case, they are negative.
However, this analysis does not consider the portfolio constraint, when the sum of weights in the conservative fund and in the IBOVESPA would have to equal 100%. Th en, we performed another test, in order to study the alpha value of each composite fund through a regression with the portfolio constraint. To do this, the regression represented in equation 6 is used.
In order to analyze the performance of the portfolio formed by means of this analysis, i.e. the portfolio formed by the conservative fund with constant weight (1 – βa) and by the IBOVESPA with constant weight βa, we also
calculated total return within the period and annualized volatility. Th e test results are shown in Table 6, where the portfolio built this way was named as benchmark and the composite fund analyzed was named simply as fund.
R
�,�= α + β
�R
�,�+ β
�R
�,�+ e
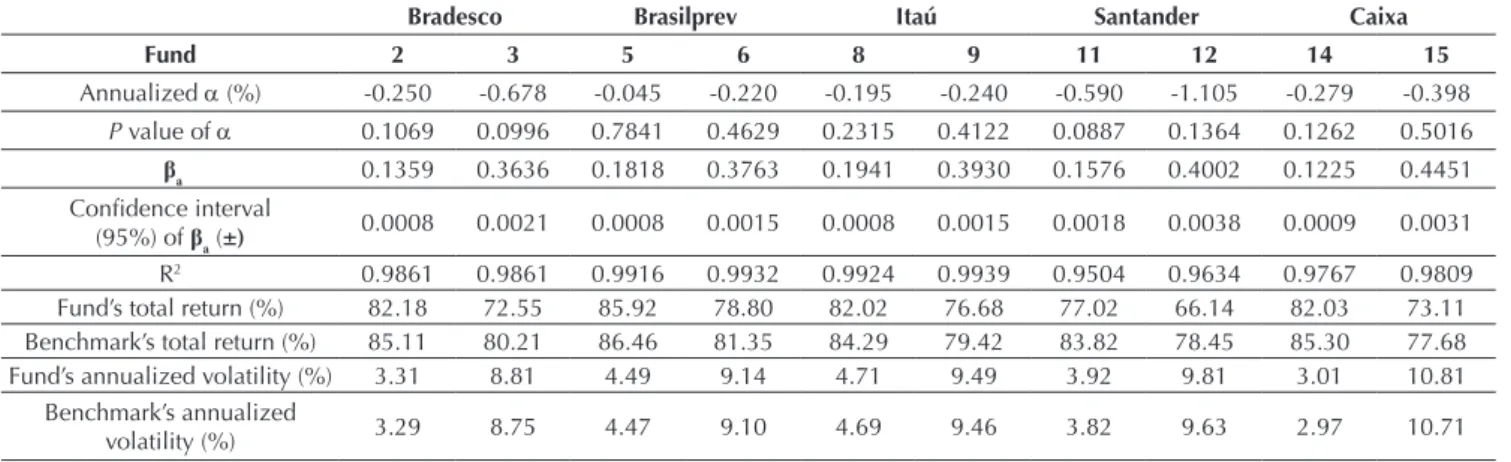
�Table 6 shows that in none of the cases p value was signifi cant at a 5% signifi cance level. When observing the values found for βa, i.e. the IBOVESPA weights, we can see that their confi dence intervals are very small when compared to the value found (all p values virtually equal to zero, not shown in the table), suggesting there is not a rather active management of the portion of variable income portion in composite fund portfolios, since most of the time the IBOVESPA weights in the composite fund portfolio under analysis remain very close to the βa values.
Another result that deserves attention is performance: all benchmarks built had higher returns as lower volatility. Th is is an indication that an investor may obtain similar or even better returns than those of composite funds, with simple strategies, such as that used.
4.5 Is it Possible to Replicate the Performance of Composite Funds with a Lower
Management Fee?
In the previous subsection, we observe that all benchmarks built only by means of a fi xed percentage in the conservative fund added to a fi xed percentage on the IBOVESPA had better total returns and smaller volatilities than composite funds under analysis. However, this was an in-sample analysis, i.e. the whole sample was used to determine weights. Also, the so-called strategy would need daily rebalancing to keep up with the same ratio between conservative fund and the IBOVESPA, raising the strategy cost too much. Th is problem would occur because, since these two assets’ daily returns are not necessarily equal, the portfolio would inevitably be unbalanced every day. Th us, the
purpose of this subsection is developing an out-of-sample benchmark that can realistically be replicated at a low cost.
To achieve this goal, a passive benchmark was set up for each moderate/aggressive fund from the institutions consisting only of the conservative fund from each institution and the IBOVESPA. Th is benchmark was built as follows: each month (m) the composite fund style, i.e. theoretical weights of each asset in the fund portfolio, is calculated through the simpler style analysis as proposed by Sharpe (1992), through multiple regression between returns, without intercept and having weight constraints adding up to 100%. If the assets are weighed, a portfolio is used for the following month (m+1). Th is procedure is repeated on a monthly basis, thus making rebalancing monthly and reducing transaction costs, besides constituting an out-of-sample analysis and perfectly replicable.
In order to assess the benchmark built against the fund studied, total return and annualized volatility were calculated again. For a statistical comparison between the return series of the passive benchmark calculated and the referent fund, Spearman’s correlation and p value of the Wilcoxon-Mann-Whitney test were used. Th e choice of this non-parametric test was found to be widely used in the literature when it comes to comparisons between funds, in addition to being considered more eff ective than t when it cannot be said that data had normal distribution, which in fact occurred. In turn, Spearman’s correlation is a non-parametric statistics that does not require assumptions about data distribution, besides allowing to detect non-linear relations. Table 7 displays the results.
Table 6 Results of the test expressed by equation 6 (conservative multifactor model + IBOVESPA, with portfolio constraint)
Bradesco Brasilprev Itaú Santander Caixa
Fund 2 3 5 6 8 9 11 12 14 15
Annualized α (%) -0.250 -0.678 -0.045 -0.220 -0.195 -0.240 -0.590 -1.105 -0.279 -0.398 P value of α 0.1069 0.0996 0.7841 0.4629 0.2315 0.4122 0.0887 0.1364 0.1262 0.5016
βa 0.1359 0.3636 0.1818 0.3763 0.1941 0.3930 0.1576 0.4002 0.1225 0.4451
Confi dence interval
(95%) of βa (±) 0.0008 0.0021 0.0008 0.0015 0.0008 0.0015 0.0018 0.0038 0.0009 0.0031
R2 0.9861 0.9861 0.9916 0.9932 0.9924 0.9939 0.9504 0.9634 0.9767 0.9809
Fund’s total return (%) 82.18 72.55 85.92 78.80 82.02 76.68 77.02 66.14 82.03 73.11 Benchmark’s total return (%) 85.11 80.21 86.46 81.35 84.29 79.42 83.82 78.45 85.30 77.68 Fund’s annualized volatility (%) 3.31 8.81 4.49 9.14 4.71 9.49 3.92 9.81 3.01 10.81
Benchmark’s annualized
volatility (%) 3.29 8.75 4.47 9.10 4.69 9.46 3.82 9.63 2.97 10.71
All Spearman’s correlations in Table 7 are quite high, with the lowest of them still above 97.5%, suggesting that the calculated benchmark’s return series do not differ much from the original fund series (recalling that calculations were made with recomposed fund returns of the management fee). This suggestion is confirmed by results of the Wilcoxon-Mann-Whitney test, which showed p values all above
94%, i.e. far from rejecting the null hypothesis even at high significance levels (the null hypothesis of this test means that the two sample distributions are equal). When observing total return, we see that the benchmarks calculated gain in half of the cases analyzed, in addition to having, all of them, volatilities smaller than the funds.
Table 7 Indicators of benchmarks built (conservative + Bovespa Index) vs. funds analyzed
Bradesco BrasilPrev Itaú Santander Caixa
Fund 2 3 5 6 8 9 11 12 14 15
Rho-Spearman 0.9923 0.9922 0.9959 0.9962 0.9977 0.9977 0.9758 0.9813 0.9899 0.9896 Pval-Wilcoxon 0.9461 0.9669 0.9954 0.9670 0.9618 0.9496 0.9687 0.9979 0.9936 0.9866 Fund’s total return (%) 82.2 72.6 85.9 78.8 82.0 76.7 77.0 66.1 82.0 73.1
Benchmark’s total return (%) 84.1 75.0 85.3 75.2 80.6 71.6 80.5 70.6 82.1 68.5 Fund’s annualized
volatility (%) 3.31 8.81 4.49 9.14 4.71 9.49 3.92 9.81 3.01 10.81
Benchmark’s annualized
volatility (%) 3.30 8.79 4.42 9.02 4.68 9.43 3.83 9.63 2.94 10.56
Note: in bold, the comparatively higher results.
Source: Prepared by the authors.
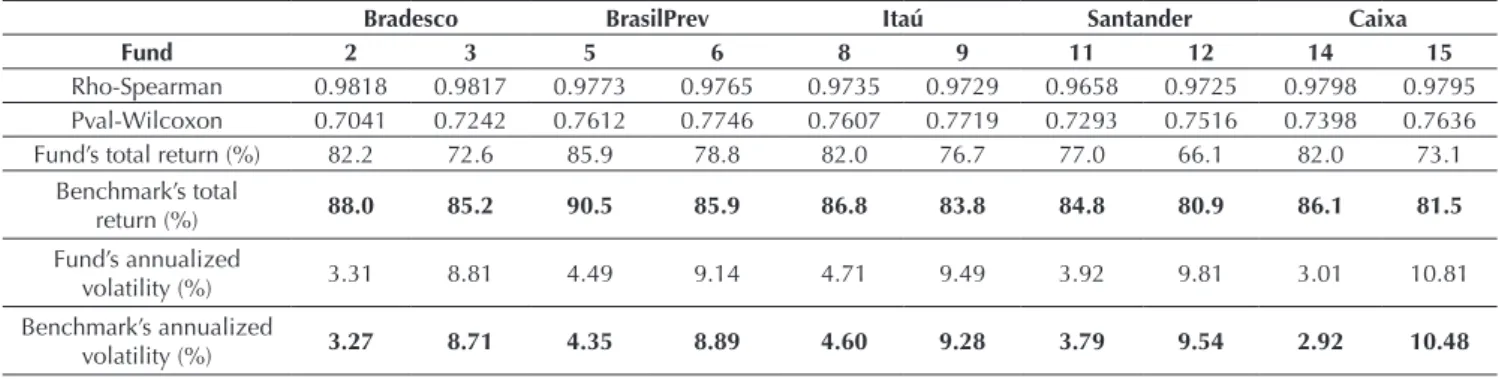
Table 8 Indicators of benchmarks built (conservative + IBRX-100) vs. funds analyzed
Bradesco BrasilPrev Itaú Santander Caixa
Fund 2 3 5 6 8 9 11 12 14 15
Rho-Spearman 0.9818 0.9817 0.9773 0.9765 0.9735 0.9729 0.9658 0.9725 0.9798 0.9795 Pval-Wilcoxon 0.7041 0.7242 0.7612 0.7746 0.7607 0.7719 0.7293 0.7516 0.7398 0.7636 Fund’s total return (%) 82.2 72.6 85.9 78.8 82.0 76.7 77.0 66.1 82.0 73.1
Benchmark’s total
return (%) 88.0 85.2 90.5 85.9 86.8 83.8 84.8 80.9 86.1 81.5
Fund’s annualized
volatility (%) 3.31 8.81 4.49 9.14 4.71 9.49 3.92 9.81 3.01 10.81
Benchmark’s annualized
volatility (%) 3.27 8.71 4.35 8.89 4.60 9.28 3.79 9.54 2.92 10.48
Note: in bold, the comparatively higher results.
Source: Prepared by the authors.
Consequently, it is plausible to claim that it is possible to build a passive portfolio, formed only by a conservative fund from the institution and by the IBOVESPA, invested through an ETF (e.g. XBOV11 – Caixa ETF IBOVESPA Index Fund, which charges 0.5% p.y. as management fee), with similar style and returns with no statistically significant difference with regard to the moderate/ aggressive fund under analysis. It is worth noticing that the management fee would be lower than the conservative fund management fee due to lower ETF cost, therefore lower than the fee charged by the composite fund (moderate or aggressive).
As a robustness test, we performed the same analysis, but using the IBrX-100 index as a proxy for the Brazilian
The returns of benchmarks formed with the IBrX-100 also did not show statistically significant differences from their reference fund returns. However, all benchmarks showed higher cumulative returns and lower volatilities than reference funds, which is still a highly positive bias. These results corroborate
the previous conclusion, i.e. it is possible to build portfolios with a style very similar to the moderated/ aggressive fund analyzed and having a performance at least equal (but with superiority bias), with a much lower management fee.
5. CONCLUSION
Th e main conclusion obtained in this study is that it is possible to build a passive portfolio, formed only by the conservative fund from the institutions analyzed and an ETF from a stock index (IBOVESPA or IBrX-100), with similar style and returns without statistically signifi cant difference with regard to the respective moderate/ aggressive fund from the institutions under analysis, paying a lower management fee than those. If the ETF is based on the IBrX-100, the performance has an even higher bias, both in terms of higher average return and lower volatility.
Another signifi cant result was the existence of strong passivity traces in the management of the funds analyzed, thus not justifying the high management fees charged, even when considering the Jensen’s alpha values found. Th ese traces are observed through the results of exposures found in the style analysis using the fi lter proposed by Kalman (1960), as well as by the analysis of determination coeffi cients (R2). Th e situation is even more serious in
moderate and aggressive funds from the institutions analyzed. These funds are precisely those that were expected to be more active, because they have a variable income portion. Nevertheless, they were those showing more passivity traces in management and those that, at the same time, charge the highest management fees.
Th us, a rather in-depth investigation by the Brazilian regulatory agencies regarding funds with closet trackers characteristics, especially social security, analyzed here, are recommended, just as in the case of the Sweden-led movement that has gained momentum in Europe. Th is is explained by the fact that, just as in Europe, evidence
has been found of funds with high management fees for active management while they actually have passive performance management, merely replicating that of known market indexes. So, this study hopes to shed light and trigger the debate on this issue in Brazil.
A major consideration that should be made is that the results found herein are specifi c to the funds and the institutions analyzed. Although they are quite representative of their categories, since they are the largest open funds from the largest private pension institutions in Brazil, none of the results obtained may be indiscriminately generalized. Consequently, as a natural suggestion for further studies, it is recommended to deepen and extend the analysis developed herein. It may be extended to other funds or other private pension institutions, e.g. merely insurers (in contrast to large banking institutions’ sectors) or even non-pension funds.
REFERENCES
Amaral, T. R. S. (2013). Análise de performance de fundos
de investimento em previdência. (Master’s Dissertation).
Universidade de São Paulo, São Paulo.
Banco Central do Brasil. (2005). Resolução n. 3.308, de 31
de agosto de 2005. Altera as normas que disciplinam
a aplicação dos recursos das reservas, das provisões e dos fundos das sociedades seguradoras, das sociedades de capitalização e das entidades abertas de previdência complementar, bem como a aceitação dos ativos correspondentes como garantidores dos respectivos recursos, na forma da legislação e da regulamentação
em vigor. Retrieved from http://www.bcb.gov.br/pre/
normativos/res/2005/pdf/res_3308_v1_o.pdf Campani, C. H., & Costa, T. (2016). Pensando
na aposentadoria: previdência privada ou
autoprevidência? Retrieved from http://www.coppead.
ufrj.br/upload/publicacoes/428.pdf
Durbin, J., & Koopman, S. J. (2012). Time series analysis
by state space methods (2nd. ed.). Oxford: Oxford
University Press.
Fung, W., & Hsieh, D. A. (1997). Empirical characteristics of dynamic trading strategies: the case of hedge
funds. Review of Financial Studies, 10(2), 275-302.
Gibson, R., & Gyger, S. (2007). Th e style consistency of
hedge funds. European Financial Management, 13(2),
287-308.
Harvey, A. C. (1990). Forecasting, structural time series
models and the Kalman fi lter. Cambridge: Cambridge
University Press.
Holmes, K. A., & Faff , R. W. (2008). Style analysis, customized benchmarks, and managed funds: new
evidence. Applied Financial Economics Letters, 4(4),
253-258.
Kalman, R. E. (1960). A new approach to linear fi ltering
and prediction problems. Journal of Fluids Engineering,
82(1), 35-45.
Lhabitant, F. S. (2009). Hedge funds: quantitative insights.
Chichester, NY: John Wiley & Sons.
Linhares, R. A. (2003). Aplicação da análise de estilo
baseada nos retornos para os fundos mútuos no mercado
brasileiro (Master’s Dissertation). Universidade Federal
do Rio de Janeiro, Rio de Janeiro.
Markov, M., Mottl, V., & Muchnik, I. (2004). Dynamic
style analysis and applications. Retrieved from https://
papers.ssrn.com/sol3/papers.cfm?abstract_id=1971363
Marques, L. G. E. (2006). Efi ciência de fundos de previdência: uma análise das classes de fundos
disponíveis no mercado. Revista Brasileira de Risco e
Seguro, 2(3), 68-84.
Marques, R., Pizzinga, A., & Vereda, L. (2012). Restricted Kalman fi lter applied to dynamic style analysis of
actuarial funds. Applied Stochastic Models in Business
and Industry, 28(6), 558-570.
Nunes, L. L. (2015). Estilo e agrupamento de fundos: um
estudo aplicado aos fundos multimercados brasileiros
(Master’s Dissertation). Universidade de São Paulo, São Paulo.
Pizzinga, A.,Vereda, L., & Fernandes, C. (2011). A dynamic style analysis of exchange rate funds: the case of Brazil
at the 2002 election. Advances and Applications in
Statistical Sciences, 6(2), 111-135.
Pizzinga, A., Vereda, L., Azevedo, C. O., & Fernandes, C. (2012). Análise dinâmica de estilo para fundos de
investimentos brasileiros. Revista Brasileira de Risco e
Seguro, 7(14), 1-34.
Schutt, I. G., & Caldeira, J. F. (2014). Análise de estilo dinâmica de fundos multimercados: aplicação para o
mercado brasileiro. In Anais do Encontro Nacional de
Economia (p. 42). Natal, RN.
Sharpe, W. (1988). Determining a fund’s eff ective asset
mix. Investment Management Review, 2(6), 59-69.
Sharpe, W. (1992). Asset allocation: management style
and performance measurement. Journal of Portfolio
Management, 18(2), 7-19.
Smart Common Sense Modern. (2015). Closet indexation.
Th e UK epidemic continues. Retrieved from http://
www.trueandfaircampaign.com/wp-content/ uploads/2015/02/SCM-direct-closet-indexation-epidemic-continues-report-february-2015.pdf
Swinkels, L., & Van Der Sluis, P. J. (2002).
Return-based style analysis with time-varying exposures.
Retrieved from https://papers.ssrn.com/sol3/papers.
cfm?abstract_id=291640
Varga, G., & Valli, M. (1998). Análise de estilo de investimento baseada no retorno. Recuperado de http://www.fce.com.br/servicos/artigos.php# Yoshinaga, C. E., Castro Jr., F. H. F., Oda, A. L., &
Lucchesi, E. P. (2009). Análise de estilo em fundos multimercados com e sem alavancagem no