Spatial regression methods to evaluate beekeeping production in the
state of Rio de Janeiro
[Métodos de regressão espacial para avaliação da produção apícola do estado do Rio de Janeiro]
W.S. Tassinari, M.C. Lorenzon, E.L. Peixoto
Universidade Federal Rural do Rio de Janeiro Seropédica, RJ
ABSTRACT
Brazilian beekeeping has been developed from the africanization of the honeybees and its high performance launches Brazil as one of the world´s largest honey producer. The Southeastern region has an expressive position in this market (45%), but the state of Rio de Janeiro is the smallest producer, despite presenting large areas of wild vegetation for honey production. In order to analyze the honey productivity in the state of Rio de Janeiro, this research used classic and spatial regression approaches. The data used in this study comprised the responses regarding beekeeping from 1418 beekeepers distributed throughout 72 counties of this state. The best statistical fit was a semiparametric spatial model. The proposed model
could be used to estimate the annual honey yield per hive in regions and to detect production factors more related to beekeeping. Honey productivity was associated with the number of hives, wild swarm collection and losses in the apiaries. This paper highlights that the beekeeping sector needs support and help to elucidate the problems plaguing beekeepers, and the inclusion of spatial effects in the regression models is a useful tool in geographical data.
Keywords: beekeeping productivity, spatial statistics, spatial regression models
RESUMO
A apicultura brasileira se desenvolveu a partir da africanização das abelhas melíferas, e seu bom desempenho permitiu lançar o Brasil como um dos maiores produtores mundiais de mel. A região Sudeste ocupa uma posição significativa no mercado, mas o estado do Rio de Janeiro é o menor produtor, apesar de apresentar áreas expressivas de vegetação silvestre para a produção de mel. Para analisar a produtividade de mel no estado do Rio de Janeiro, esta pesquisa estudou diversos métodos de regressão clássica e espacial. Os dados analisados compreenderam respostas sobre apicultura de 1418 apicultores distribuídos em 72 municípios do Rio de Janeiro. O melhor ajuste estatístico utilizado foi um modelo semiparamétrico espacial. A utilidade do modelo proposto é estimar a produção anual de mel por colmeia nas diversas regiões e identificar os fatores de produção mais relacionados à apicultura. A produtividade de mel mostrou-se mais associada com o número de colmeias, a coleta de enxame silvestre e as perdas em apiários. Este trabalho destacou que o segmento apícola necessita de apoio para auxiliar na identificação dos problemas que afetam os apicultores. A utilização de efeitos espaciais em modelos de regressão são ferramentas úteis quando são utilizados dados geograficamente referenciados.
Palavras-chave: produtividade apícola, estatística espacial, modelos de regressão espacial
INTRODUCTION
In Brazil, beekeeping has been developed from the Africanization of European honeybees (Gonçalves, 1974) and currently ranks as the 11th
Recebido em 25 de julho de 2012
Aceito em 9 de janeiro de 2013 E-mail: [email protected]
tropical climates as compared to European bees (De Jong and Gonçalves, 1998; Guerra et al.,
2000). However, the limited data available from beekeepers reveals lower yields per colony than that observed or predicted by scientists. The Brazilian beekeeping sector is currently facing important issues regarding the management of Africanized colonies, probably due to the lack of technical knowledge. Therefore, the introduction of modern beekeeping techniques becomes imperative.
The Southeastern region of Brazil is a remarkable region, providing approximately 45% of the national honey production. Belonging to this region, the state of Rio de Janeiro’s
beekeeping sector displayed robust growth during the 1950s and 1960s, but a lack of awareness regarding the limits of the field resulted in low profitability, about 1% of the national production (FIBGE, 2009). Beekeeping surveys pointed out the increasing numbers of beekeepers, a low variety of bee products and high losses in their business as the major problems (Coapi, 1992; Lorenzon et al., 2008).
In order to evaluate the productivity factors, this study aims to evaluate which regression model, spatial or non-spatial, is more recomended to estimate the honey production, to reveal possible spatial clusters and the most significant factors related to the bee production.
MATERIALS AND METHODS
The state of Rio de Janeiro is located in the Southeastern part of the country (22º54'23"S, 43º10'21"W), comprising 92 counties, with a land size of 43,696.054 square kilometers, with a population of about 15 million (FIBGE, 2009). At the time of this study there were approximately 2,000 beekeepers, mostly with 20 hives, mainly processing honey, which did not depend on agriculture. The honey production from Rio de Janeiro is about 404 tons, mostly from wild vegetation. Rio de Janeiro has expansive wild vegetation (348,985.59 hectares) as it is not an agrarian state. The major crops include passion fruit, beans, rice and maize, covering 337,241.30 hectares; livestock represents the largest portion of agrarian production, utilizing 1,545,123.21 hectares. Fishing is an important source of livelihood, while beekeeping is not; nonetheless, the consumption of beekeeping products in Rio de
Janeiro is an integral part of the economy. The state of Rio de Janeiro has high geographical diversity caused by a series of factors, which highlight the need for spatial data analysis. Spatial patterns can be useful and interesting to better conduct an analysis such as regional economics and management in beekeeping. For this, modeling the observed beekeeping elements can be useful.
The beekeeping data of the state of Rio de Janeiro were obtained with a survey done in 2006 (Lorenzon et al., 2008), that interviewed
1,418 beekeepers at their apiaries using a structured questionnaire; the beekeepers were distributed across 72 counties.
Linear regression is one of the best-known classical data mining techniques. However, it makes the assumption of independent identical distribution in learning data samples, which does not work well for geo-spatial data, which is often characterized by spatial autocorrelation (Bailey and Gatrell, 1995; Druck et al., 2004). Some
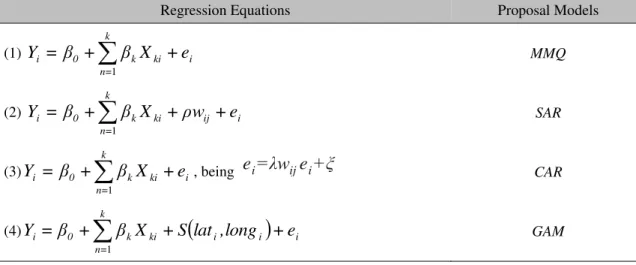
regression models proposed to deal with this situation are: Spatial Autoregressive models (SAR) (Cressie, 1993), Conditional Autoregressive models (CAR) (Cressie, 1993) and more recently the Generalized Additive Models (GAM) (Wood, 2006). Spatial dependencies within data are taken care of by the autocorrelation term and improve overall classification and prediction accuracies. Table 1 reports the spatial and non-spatial regression equations used in this work.
A standard linear regression model assumes that the error terms (ei) are independent. Certain
distinct patterns in the residuals may suggest the violation of model assumptions and indicate nonlinear relations, unequal variances, and non-normality. If any model assumption is violated, standard linear regression may not be appropriate or adequate and the subsequent statistical inferences based on model parameters may not be reliable. The second model, the SAR model
(Anselin, 2004). In the third regression model, CAR, the key distinction between the SAR and the CAR models is in the model specification (Anselin, 2004). SAR models explain the relations among response variables at all locations on the lattice simultaneously, the spatial effect is considered endogenous. In contrast, CAR models specify the distribution of a response variable at one location depending on the values of its neighbors; the spatial effect of the neighbors is considered to be exogenous (Wood, 2006). The relation between the two types of models is close; however, SAR models
(derived from spatial error models) may be represented by higher-order CAR models (Anselin, 2004). The last model, GAM, includes an additional term, S(lati , longi), to indicate the
bidimensional smooth function based on the thin plate spline of the East and North coordinates. It
indicates whether the residual variation in the data presents any spatial structure after controlling for the explanatory covariates. This smoothing parameter is selected by minimizing the unbiased risk estimator, which was equivalent to minimizing the expected mean square error (Wood, 2006).
Table 1. Summary of the regression analysis: MMQ (Linear Model), SAR (Spatial Autoregressive), CAR (Conditional Autoregressive), GAM (Generalized Additive Model)
Regression Equations Proposal Models
(1) ki i
k
= n
k 0
i
=
β
+
β
X
+
e
Y
1
MMQ
(2) ki ij i
k
= n
k 0
i
=
β
+
β
X
+
ρw
+
e
Y
1
SAR
(3) ki i
k
= n
k 0
i
=
β
+
β
X
+
e
Y
1
, being
e
i=λw
ije
i+ξ
CAR(4) ki
i i
ik
= n
k 0
i
=
β
+
β
X
+
S
lat
,
long
+
e
Y
1
GAM
Before the spatial model fit, measuring the spatial heterogeneity through spatial autocorrelation is recommended. The spatial autocorrelation of a particular attribute in the study area depends on the lag distance among the place locations (Bailey and Gatrell, 1995). However, it is not always easy to distinguish between spatial autocorrelation and spatial heterogeneity. In this work, the Moran Index with simulations was performed to measure the residual autocorrelation. For spatial fit SAR and CAR models, the weights for the adjacency and distance matrix (wij) were given by the weights wij = 1 if i and j were adjacent, and 0 otherwise
(Bailey and Gatrell, 1995).
Akaike’s Information Criterion (AIC) and the residual sum squares (RSS) were used to measure the fit of the models (Burnham and Anderson, 2004). Models with lower AIC and
RSS values are considered to be better models in terms of balancing fit with parsimony (Cliff and Ord, 1981). The linear correlation between observed and predicted values was used to evaluate model consistency. Residual plot analyses were done to verify if the regression models were appropriate for the data. All statistic analysis was done with the R Statistical Package, version 2.9.0 (R Development Core Team, 2008).
RESULTS AND DISCUSSION
Table 2. Model summary from spatial (SAR, CAR and GAM) and non-spatial (MMQ) regression models. Residual Sum of Squares (RSS), Global Moran's residuals (Moran I) and the Correlation between Observed Average Honey Yield and the Predicted (ρ). State of Rio de Janeiro, Brazil, 2008
Model MMQ SAR CAR GAM
RSS 2,807.78 2,542.89 2,586.97 1,865.81
AIC 604,07 600.45 603.19 590.62
Moran I -0.117 (-0.94) -0.022 (-0.49) -0.006 (0.32) -0.068 (0.81)
ρ 0.821 (<0.001*) 0.84 (<0.001*) 0.837 (<0,001*) 0.886 (<0.001*) *variables significant at a 5% level of probability
Despite the regression, classical and spatial analysis revealing that the data were well fitted, the semi-parametric model adjusted via thin plate spline (GAM) yielded the best overall fit (AIC =
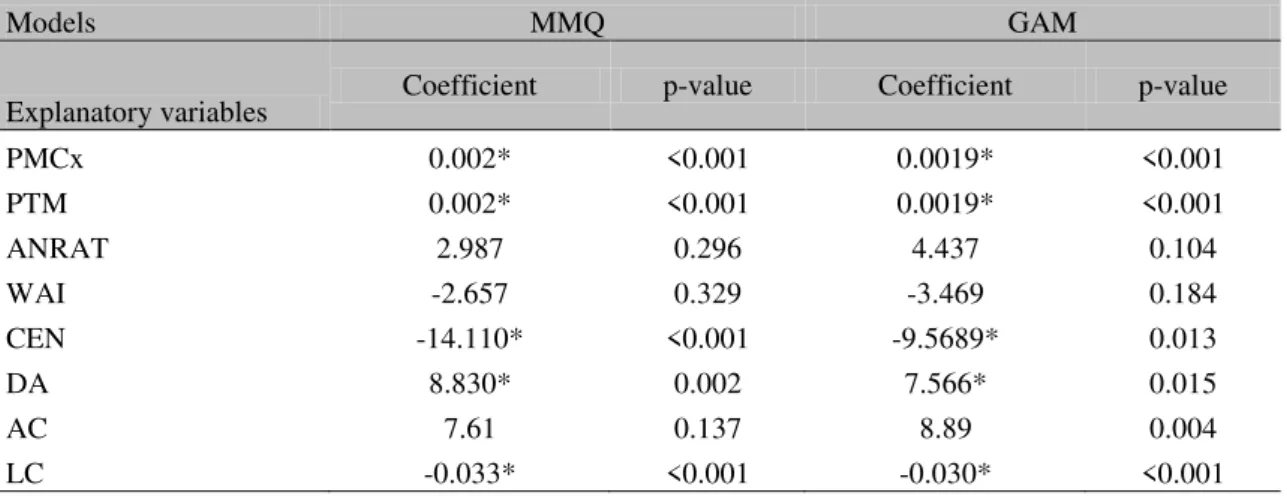
590.62, RSS = 1865.81 and ρ = 0.886) (table 2). This same table also presents a negative association between honey yield per hive and the proportion of the beekeepers collecting wild
swarms, as well as the number of hives (p-value
<0.01) (Table 3). The former factor points out the low performance of wild swarms, and the latter one shows a tendency toward increased honeybee populations in certain regions. This can be due to the high concentration of apiaries (bee population), where beekeepers try to find out abundant melliferous flora.
Table 3. Statistical summary from spatial (GAM) and non-spatial (MMQ) regression models for the Annual average honey yield per hive (PMCx), Total honey yield (PTM), Beekeepers receiving technical support (ANRAT), Weekly apiary inspection (WAI), Beekeepers collecting wild swarms (CEN), Beekeepers with losses from bee diseases (DA), Beekeepers interested in apiculture courses (AC), Number of hives per beekeeper (LC) variables. Rio de Janeiro, Brazil, 2008
Models MMQ GAM
Explanatory variables Coefficient p-value Coefficient p-value
PMCx 0.002* <0.001 0.0019* <0.001
PTM 0.002* <0.001 0.0019* <0.001
ANRAT 2.987 0.296 4.437 0.104
WAI -2.657 0.329 -3.469 0.184
CEN -14.110* <0.001 -9.5689* 0.013
DA 8.830* 0.002 7.566* 0.015
AC 7.61 0.137 8.89 0.004
LC -0.033* <0.001 -0.030* <0.001
*variables significant at 5% level of probability
The predicted distribution of the beekeepers’
average honey yield across different counties in the state of Rio de Janeiro is presented in Figure 1. The maps show very subtle differences. In all of them clusters of higher honey production in regions to the west, mountainous regions and mainly in the metropolitan region of Rio de Janeiro can be seen. Most counties (37)
Source: MAPA, SESCOOP, FAERJ, Counties= 92
Figure 1. Spatial distribution of the predicted values from honey yield per hive per year (kg), in spatial (SAR, CAR and GAM) and non-spatial (Linear) Regression Models. Rio de Janeiro, Brazil. 2009
All models stress the low honey yields in almost all the counties investigated in the state of Rio de Janeiro probably resulting from a decline of melliferous flora (Bergallo et al., 2009) and
inadequate technical support for beekeepers as well.
The current state of beekeeping in Rio de Janeiro displays a troublesome lack of productivity and requires thoughtful remediation. These deficits are also reported in other Brazilian states with recently begun beekeeping efforts exhibiting quiet growth (Reis and Comastri Filho, 2003) and in this regard, the unproductive factors need to be assessed and corrected promptly.
The methods outlined above help to elucidate the problems plaguing beekeepers and should facilitate testing of new and complex statistical models.
CONCLUSION
This research reports the importance of including spatial effects in the regression models, even when the traditional linear regression model does not show a pattern of spatial dependence. In the subject of this study, the spatial model facilitates the analysis of honey producing regions, which is not available with other models, thereby improving inferences in beekeeping and several other researches as well. Positioned at the
confluence of new information, statistical analysis and geographic information, GAM has benefited from the broad expertise of its practitioners but there is still room for improvement in beekeeping. Currently, technicians may not take advantage of more sophisticated modeling techniques because these analytical tools are not applicable.
ACKNOWLEDGMENTS
We are grateful to SESCOOP/RJ (Serviço
Nacional de Aprendizagem do Cooperativismo);
MAPA, SFA-RJ (Superintendência Federal de
Agricultura, Ministério de Agricultura); SEAPPA
(Secretaria de Estado de Agricultura, Pecuária, Pesca e Abastecimento); SEBRAE/RIO (Serviço
Brasileiro de Apoio às Micro e Pequenas Empresas); FAERJ (Federação das Associações
Apícolas do Estado do Rio de Janeiro), by providing data for the beekeeping survey (2006).
REFERENCES
ANSELIN, L.; FLORAX, R.J.G.M.; REY, S.J.
Advances in Spatial Econometrics. Methodology,
Tools and Applications. Berlin: Springer-Verlag, 2004. 513p.
BAILEY, T.C.; GATRELL, A.C. Interactive spatial data analysis. England: Longman, 1995.
BERGALLO, H.; FIDALGO, E.C.C.; ROCHA, C.F.D. et al. Estratégias e ações para a conservação da biodiversidade no Estado do Rio de Janeiro. Rio de Janeiro: Instituto BIOMAS,
2009. 344p.
BURNHAM, K.P.; ANDERSON, D.R.
Multimodel inference: understanding AIC and BIC in Model Selection. Sociological Methods and Research, v.33, p.261-304, 2004.
FIBGE, Brazilian Geography Institute Farming Survey, Rio de Janeiro, 1990-2005. Disponível em: http://www.sidra.ibge. gov.br /bda/ tabela/ protabl.asp?z= p&o=19&i=P. Acessado em 10 jul 2009.
CLIFF, A.D.; ORD, J.K. Spatial processes:
Models and applications. London: Pion Ltda., 1981. 266p.
COAPI-RIO Pesquisa Apícola Fluminense. Rio
de Janeiro: EMATER-RIO, 1992. 25p.
CRESSIE, N.A.C. Statistics for Spatial Data.
New York: Wiley, 1993. 928p.
DE JONG, D.; GONÇALVES, L. The Africanized bees of Brazil have become tolerant to Varroa. Apiacta, v.33, p.65-70, 1998.
DRUCK, S.; CARVALHO, M.S.; CÂMARA G.; MONTEIRO, A.M.V. Análise Espacial de Dados Geográficos. Brazil, 2004. Disponível em:
http://www.sct.embrapa.br/Liv/DetalheProduto.A SP?CodigoProduto=00075490. Acessado em: 23 ago 2009.
GONÇALVES, L.S. The introduction of the african bees (Apis mellifera adansonii) into
Brasil and some comments on their spread in South America. Am. Bee J., v.114, p.414-415,
1974.
GUERRA, J.C.V.; GONÇALVES, L.S.; DE JONG, D. Africanized honey bees (Apis mellifera L.) are more effecient at removing
worker brood artificially infested with the parasitic mite Varroa jacobsoni than are Italian bees or Italian/Africanized hybrids. Genet. Mol. Biol., v.23, p.89-92, 2000.
LORENZON, M.C.A.; PEIXOTO, E.L.T, GONÇALVES, E.B. Censo apícola do Estado do Rio de Janeiro. Análise Conjuntural (2a edição).
Rio de Janeiro: SESCOOP-OCB/RJ, 2008. 108p. R DEVELOPMENT CORE TEAM. R: A language and environment for statistical computing. R Foundation for Statistical Computing, Austria, 2007. Disponível em: http://www.R-project.org. Acessado em: 3 jul 2009.
REIS, V.D.A.; COMASTRI FILHO, J.A. Importância da apicultura no pantanal sul Mato-Grossense. Brasil (MS): Embrapa Pantanal, 2003. 23p. (boletim técnico 56). Disponível em:
<http://www.cpap.embrapa.br
/publicacoes/online/DOC56.pdf>. Acessado em:
15 set. 2010.
WOOD, S.N. Generalized Additive Models: An Introduction with R. Chapman & Hall/CRC,
Boca Raton, FL, 2006. 410p.
SOMMER, P.G. Panorama da apicultura mundial. In: Brazilian Apiculture Congress, 14., 2001, Mato Grosso do Sul. Proccedings...