ACPD
13, 11789–11825, 2013Process rates and aerosol indirect
effects
A. Gettelman et al.
Title Page
Abstract Introduction
Conclusions References
Tables Figures
◭ ◮
◭ ◮
Back Close
Full Screen / Esc
Printer-friendly Version
Interactive Discussion
Discussion
P
a
per
|
Dis
cussion
P
a
per
|
Discussion
P
a
per
|
Discussio
n
P
a
per
|
Atmos. Chem. Phys. Discuss., 13, 11789–11825, 2013 www.atmos-chem-phys-discuss.net/13/11789/2013/ doi:10.5194/acpd-13-11789-2013
© Author(s) 2013. CC Attribution 3.0 License.
Atmospheric Chemistry and Physics
Open Access
Discussions
Geoscientiic Geoscientiic
Geoscientiic Geoscientiic
This discussion paper is/has been under review for the journal Atmospheric Chemistry and Physics (ACP). Please refer to the corresponding final paper in ACP if available.
Microphysical process rates and global
aerosol-cloud interactions
A. Gettelman1, H. Morrison1, C. R. Terai2, and R. Wood2
1
National Center for Atmospheric Research, 1850 Table Mesa Dr., Boulder, CO, 80305, USA
2
Department of Atmospheric Sciences, Box 351640, University of Washington, Seattle, WA, 98195, USA
Received: 12 April 2013 – Accepted: 22 April 2013 – Published: 3 May 2013
Correspondence to: A. Gettelman ([email protected])
ACPD
13, 11789–11825, 2013Process rates and aerosol indirect
effects
A. Gettelman et al.
Title Page
Abstract Introduction
Conclusions References
Tables Figures
◭ ◮
◭ ◮
Back Close
Full Screen / Esc
Printer-friendly Version
Interactive Discussion
Discussion
P
a
per
|
Dis
cussion
P
a
per
|
Discussion
P
a
per
|
Discussio
n
P
a
per
|
Abstract
Cloud microphysical process rates control the amount of condensed water in clouds and impact the susceptibility of precipitation to drop number and aerosols. The rela-tive importance of different microphysical processes in a climate model is analyzed, and the autoconversion and accretion processes are found to be critical to the
con-5
densate budget in most regions. A simple steady-state model of warm rain formation is used to illustrate that the diagnostic rain formulations typical of climate models may result in excessive contributions from autoconversion, compared to observations and large eddy simulation models with explicit bin-resolved microphysics and rain forma-tion processes. The behavior does not appear to be caused by the bulk process rate
10
formulations themselves, because the steady state model with bulk accretion and au-toconversion has reduced contributions from auau-toconversion. Sensitivity tests are con-ducted to analyze how perturbations to the precipitation microphysics for stratiform clouds impact process rates, precipitation susceptibility and aerosol-cloud interactions (ACI). With similar liquid water path, corrections for the diagnostic rain assumptions in
15
the GCM based on the steady state model to boost accretion over autoconversion in-dicate that the radiative effects of ACI may decrease by 20 % in the GCM for the same mean liquid water path. Links between process rates, susceptibility and ACI are not al-ways clear in the GCM. Better representation of the precipitation process, for example by prognosing precipitation mass and number, may help better constrain these effects
20
in global models with bulk microphysics schemes.
1 Introduction
Aerosols have many direct, semi-direct and indirect effects on clouds. The indirect ef-fects, or Aerosol-Cloud Interactions (ACI), result from more Cloud Condensation Nuclei (CCN) creating a population of more and smaller particles for a given amount of cloud
25
ACPD
13, 11789–11825, 2013Process rates and aerosol indirect
effects
A. Gettelman et al.
Title Page
Abstract Introduction
Conclusions References
Tables Figures
◭ ◮
◭ ◮
Back Close
Full Screen / Esc
Printer-friendly Version
Interactive Discussion
Discussion
P
a
per
|
Dis
cussion
P
a
per
|
Discussion
P
a
per
|
Discussio
n
P
a
per
|
affecting the resulting lifetime of the clouds in complex ways (second indirect or life-time effect, Albrecht, 1989). The effects on cloud lifetime are complex, and depend upon precipitation processes in clouds. We will focus in this paper on stratiform clouds. Convective clouds with strong vertical motions, create their own complex challenges in understanding aerosol effects (Rosenfeld et al., 2008).
5
Many global models of the atmosphere (General Circulation Models or GCMs) have started to treat aerosol indirect effects (e.g., Boucher and Lohmann, 1995; Quaas et al., 2008). The resulting global effects of aerosols on radiative fluxes appear larger than many observational estimates from satellites (Quaas et al., 2008) or inverse methods (Murphy et al., 2009). Satellite studies and more detailed models indicate that a likely
10
culprit is too large a change in liquid water path with the changing drop number induced by aerosols, resulting in too large a radiative effect (e.g., Wang et al., 2012). The for-mation of precipitation, as a primary sink for liquid water, is critical in this process. Also important are entrainment processes (e.g., Ackerman et al., 2004; Guo et al., 2011).
The evolution of precipitation in clouds is affected by aerosols through their impact
15
on the droplet size distribution. Increases in aerosol are seen to increase cloud drop number (Martin et al., 1994; Ramanathan et al., 2001). Increased drop number means smaller mean drop size for constant liquid water path (LWP). The result is smaller drops that do not coalesce and grow into precipitation as easily. This coalescence process (described by the stochastic collection equation) is too detailed to completely represent
20
in bulk formulations of cloud drop size distributions. Thus, the coalescence process of precipitation formation is often represented by a parameterization of the autoconver-sion of cloud liquid to precipitation, while the collection process of cloud droplets onto existing raindrops is represented by an accretion process. Most current GCMs assume a diagnostic treatment of precipitation whereby time tendencies of precipitation are set
25
ACPD
13, 11789–11825, 2013Process rates and aerosol indirect
effects
A. Gettelman et al.
Title Page
Abstract Introduction
Conclusions References
Tables Figures
◭ ◮
◭ ◮
Back Close
Full Screen / Esc
Printer-friendly Version
Interactive Discussion
Discussion
P
a
per
|
Dis
cussion
P
a
per
|
Discussion
P
a
per
|
Discussio
n
P
a
per
|
Wood (2005) note that autoconversion should play a minor role in increasing drizzle water content.
The autoconversion and accretion rates are affected by changes in drop number. Autconversion is sensitive to drop number (Khairoutdinov and Kogan, 2000) while ac-cretion rates are nearly independent of the drop number: they are only affected via the
5
mass of condensate undergoing autoconversion. If accretion dominates over autocon-version, as observed for shallow clouds (Stevens and Seifert, 2008) and stratocumulus (Wood, 2005), this would tend to dampen the ACI: reducing the role of autoconversion, which depends on cloud drop number, reduces the effect of aerosols on cloud radiative properties (Wood et al., 2009). Consistent with this idea, the change in rain rate with
re-10
spect to aerosols or drop number (called the “susceptibility” of precipitation to aerosols following Feingold and Siebert, 2009) seems to decrease at higher liquid water paths where accretion dominates (Jiang et al., 2010; Terai et al., 2012). Complicating diag-nosis however, Golaz et al. (2011) found a strong co-variance between ACI and LWP with changes in process rates to achieve radiative balance in a GCM.
15
In contrast to previous work on microphysics processes in GCMs (Posselt and Lohmann, 2008; Wang et al., 2012), we compare GCM process rates to rates derived from in-situ observations and we explore a simple steady state model of microphysical processes. We first examine microphysical process rates in a GCM (Sect. 2). We ana-lyze a simple steady state model (Sect. 3) to understand interactions of process rates
20
ACPD
13, 11789–11825, 2013Process rates and aerosol indirect
effects
A. Gettelman et al.
Title Page
Abstract Introduction
Conclusions References
Tables Figures
◭ ◮
◭ ◮
Back Close
Full Screen / Esc
Printer-friendly Version
Interactive Discussion
Discussion
P
a
per
|
Dis
cussion
P
a
per
|
Discussion
P
a
per
|
Discussio
n
P
a
per
|
2 Balance of processes in a GCM
2.1 Model description
The GCM we use in this study is the National Center for Atmospheric Research (NCAR) Community Atmosphere Model version 5.2 (CAM5). CAM5 includes an advanced phys-ical parameterization suite (Gettelman et al., 2010; Neale et al., 2010) that is well suited
5
for understanding aerosol indirect effects in stratiform clouds. CAM5 has a 2-moment cloud microphysics scheme (Morrison and Gettelman, 2008; Gettelman et al., 2008), coupled to a modal aerosol model with 3 modes (Liu et al., 2012). CAM5 aerosols affect activation of stratiform cloud droplets and ice crystals. Aerosols in the standard ver-sion of CAM5 do not interact with convective cloud drops and ice crystals. A separate
10
scheme is used to describe convective clouds and convective microphysics (Zhang and McFarlane, 1995). CAM5 has a consistent treatment of the radiative effects of cloud droplets and ice crystals, and radiatively active snow (see Gettelman et al., 2010 for details). We will also perform several sensitivity tests as noted below (see Sect. 5) with different CAM5 formulations.
15
In CAM, liquid autoconversion (auto) and accretion (accr) are defined following Khairoutdinov and Kogan (2000):
∂qr
∂t auto=Au=1350q 2.47
c N
−1.79
c (1)
∂qr
∂t accr=Ac=67(qcqr) 1.15
(2)
20
Autoconversion depends on cloud water (qc) and inversely on cloud drop number
(Nc) so that increases in drop number decrease rain rate (qr) to a first approximation,
leading to more liquid in the presence of higher number (more aerosols). Accretion depends onqc andqronly in this formulation. The rain mixing ratioqr in CAM is
diag-nostic: only from rain formed at the current time step.
ACPD
13, 11789–11825, 2013Process rates and aerosol indirect
effects
A. Gettelman et al.
Title Page
Abstract Introduction
Conclusions References
Tables Figures
◭ ◮
◭ ◮
Back Close
Full Screen / Esc
Printer-friendly Version
Interactive Discussion
Discussion
P
a
per
|
Dis
cussion
P
a
per
|
Discussion
P
a
per
|
Discussio
n
P
a
per
|
To isolate cloud lifetime and precipitation effects of aerosols in a GCM, first we exam-ine the key CAM microphysical process rates in Fig. 1. This analysis treats evaporation and condensation as large scale (macro-physical) quantities, and here we focus only on the microphysics. These terms are important in the overall amount of cloud water. We look at the storm track regions, where liquid water path is large, and in CAM there
5
is a large sensitivity of cloud feedbacks in this region (Gettelman et al., 2012). Over the storm track regions (Southern Hemisphere shown in Fig. 1a), autoconversion of liquid to precipitation, accretion of liquid by snow and the transition from liquid to ice (Bergeron process) are the largest sink terms for liquid. Autoconversion is the largest process rate from 500–900 hPa, with the Bergeron vapor deposition larger below that.
10
Accretion is lower than autoconversion. In the S. E. Pacific offthe coast of S. America (Fig. 1b), there is a large sedimentation term, but the dominant microphysical pro-cesses after that are Accretion and Autoconversion. Both are nearly equal, but there is more autoconversion near cloud top (∼800 hPa). Over the Tropical Western Pacific (20◦S to 20◦N and 120–160 longitude), the dominant processes are similar.
Autocon-15
version and accretion onto both rain and snow are the dominant sink terms for cloud liquid (Fig. 1c). Several other terms are important due to ice processes at high altitudes (homogeneous freezing and accretion of liquid onto snow). Accretion and autoconver-sion have similar magnitudes. Figure 1 shows that regardless of the cloud regime or region, accretion and autoconversion largely determine the sink of cloud liquid water.
20
3 Steady state model
Given the dominance of the autoconversion and accretion processes, we explore a sim-ple model that represents these essential features in much the same way as the GCM. We use the steady state model of Wood et al. (2009), which captures many of the qualitative and quantitative features of warm rain processes. Time tendencies of
pre-25
ACPD
13, 11789–11825, 2013Process rates and aerosol indirect
effects
A. Gettelman et al.
Title Page
Abstract Introduction
Conclusions References
Tables Figures
◭ ◮
◭ ◮
Back Close
Full Screen / Esc
Printer-friendly Version
Interactive Discussion
Discussion
P
a
per
|
Dis
cussion
P
a
per
|
Discussion
P
a
per
|
Discussio
n
P
a
per
|
for rain rate, rain number and cloud water concentration given an input cloud height, replenishment rate and drop number concentration. The essential processes are au-toconversion and accretion, combined with sedimentation and removal of cloud water. The model treats rain prognostically, and uses autoconversion from Khairoutdinov and Kogan (2000) as in Eq. (1). We use the accretion calculation of Khairoutdinov and
5
Kogan (2000) as in Eq. (2), to be consistent with the GCM simulations, and keep all parameters the same. The standard case, seen in black in Fig. 2, reproduces the sen-sitivity of precipitation to LWP andNdin Wood et al. (2009), their Fig. 1b. Steady state
model cases are described in Table 1.
The bulk microphysics in the GCM differs in several important respects from this
10
steady state model. As described by Morrison and Gettelman (2008), the bulk mi-crophysics treats the impact of the sub-grid variability of total water in a grid box, by assuming a standard deviation, and analytically adjusting the process rates by inte-grating over an assumed gamma distribution. The result, for a relative variance of 2, is an increase in autoconversion by a factor of 2.02, and of accretion by 1.04. It is
15
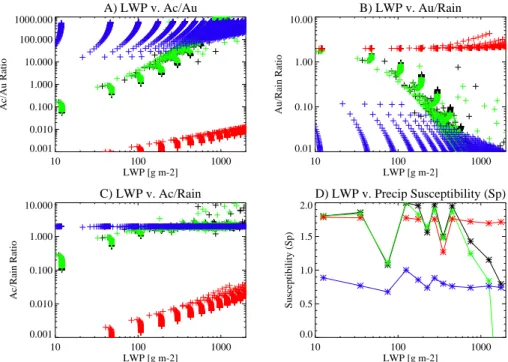
straightforward to apply these terms to the steady state model (simulation Qcv=2), but the results do not change much. The precipitation rate is very similar to the base case (not shown) and the ratios between accretion and autoconversion (Fig. 3a), au-toconversion and rain rate (Fig. 3b) and accretion and rain rate (Fig. 3c) are basically unchanged. The “susceptibility” of precipitation to drop number (Fig. 3d), here defined
20
asSp=−∂ln(R)/∂ln(Nd) withR being the Rain Rate, is also very similar, with slightly
lower values at high LWP.
In addition, the GCM does not have rain mass and number mixing ratios that are carried from time step to time step (prognostic rain), but assumes instead that rain only depends on the prognostic cloud quantities over the model time step (typically
25
ACPD
13, 11789–11825, 2013Process rates and aerosol indirect
effects
A. Gettelman et al.
Title Page
Abstract Introduction
Conclusions References
Tables Figures
◭ ◮
◭ ◮
Back Close
Full Screen / Esc
Printer-friendly Version
Interactive Discussion
Discussion
P
a
per
|
Dis
cussion
P
a
per
|
Discussion
P
a
per
|
Discussio
n
P
a
per
|
accretion is caused only by rain which is created (through autoconversion) diagnosti-cally at each time step and falls through cloud water at lower levels. In order to reflect this behavior in the steady state model, we can assume that accretion is affected only through rain created at the current time step, thus:
∂qr
∂t accr=Ac=67(qcqa) 1.15
(3)
5
Whereqais the “autoconverted” liquid (qa) from the autoconversion rate (qa=Auρdt).
This formulation (in blue in Figs. 2 and 3) changes the balance dramatically in the steady state model, causing a significant reduction in rain rate, and a constant relation-ship between the autoconversion and rain rate across all values of LWP (Fig. 3b). The
10
accretion is much less important (Fig. 3c), and susceptibility to drop number (Fig. 3d) is increased at high liquid water paths (it does not decrease as in the standard steady state model). This is consistent with previous work (Posselt and Lohmann, 2008; Wang et al., 2012) indicating that the prognostic rain formulation reduces the impact of auto-conversion. Note thatqain Eq. (3) is dependent on time step. We have tested a range 15
of time steps from 5–30 s in the steady state model, and the time step does not change the susceptibility with LWP or the slope of theAc/Auratio with LWP.
Next we explore ways to recover the steady state model behavior with the “diagnos-tic” rain rate (only fromqa, the autoconverted liquid, as in Eq. (3). Boosting accretion
by a factor of 10 alters the accretion/autoconversion (Ac/Au) ratio, but not significantly 20
(experiments with this change look identical to the diagnostic rain in Fig. 3). As a sec-ond experiment, we assume that because qr increases lower in the cloud, there is
increased efficiency of accretion over autoconversion as the rain builds in the lower part of a cloud. We express this as a power law qamod=qax, where for x <1
accre-tion is boosted (since the rain mixing ratioqr<1). For illustrative purposes, we choose 25
ACPD
13, 11789–11825, 2013Process rates and aerosol indirect
effects
A. Gettelman et al.
Title Page
Abstract Introduction
Conclusions References
Tables Figures
◭ ◮
◭ ◮
Back Close
Full Screen / Esc
Printer-friendly Version
Interactive Discussion
Discussion
P
a
per
|
Dis
cussion
P
a
per
|
Discussion
P
a
per
|
Discussio
n
P
a
per
|
rain formation (Fig. 3c), and reduces the impact of autoconversion (Fig. 3b), while also uniformly lowering susceptibility (Fig. 3d). The results do not fully reproduce the base case steady state model, particularly susceptibility (Sp) with respect to varying LWP.
In Fig. 3d, for the simulations that give the two extremes ofAc/Au ratios (DiagQr 0.5
in blue and DiagQr in red),Spis nearly constant with LWP. Note that the susceptibilities in 5
the steady state model correspond to the exponents for Autoconversion (∼1.79) for all simulations except DiagQr0.5, whereSpis around half that of Autoconversion (∼0.9). In
the equilibrium model, the slope of the rain rate with specified droplet number is dom-inated by the exponent for autoconversion, but slightly less so when accretion domi-nates. These results are consistent with previous studies that susceptibility is related
10
to the ratio between accretion and autoconversion and the Au/R ratio (Wang et al.,
2012). Note the similarity of Fig. 3a (inverse) and b with d.
4 GCM results
We now focus on these process rates in the GCM, analyzing the ratio of Accretion to Autoconversion (Jiang et al., 2010), the ratio of Autconversion (and accretion) to
pre-15
cipitation (Wang et al., 2012), and the susceptibility of precipitation to aerosols (or drop number) (Sorooshian et al., 2009; Terai et al., 2012). We composite the diagnostics by liquid water path (LWP) and by aerosol optical depth (AOD). Note that the LWP is that used in estimating microphysical process rates immediately before the microphysics calculation, not the diagnostic LWP in CAM used by the radiation code (the latter is the
20
traditional GCM output).
4.1 Accretion/autoconversion
The autoconversion of cloud condensate to precipitation and the accretion or collection of falling condensate by precipitation are the dominant terms in most places for the microphysical sink of cloud water (Fig. 1).
ACPD
13, 11789–11825, 2013Process rates and aerosol indirect
effects
A. Gettelman et al.
Title Page
Abstract Introduction
Conclusions References
Tables Figures
◭ ◮
◭ ◮
Back Close
Full Screen / Esc
Printer-friendly Version
Interactive Discussion
Discussion
P
a
per
|
Dis
cussion
P
a
per
|
Discussion
P
a
per
|
Discussio
n
P
a
per
|
Figure 4 shows zonal cross sections and maps of the autconversion and accretion rates in CAM5. As expected, autoconversion (Fig. 4d) and accretion (Fig. 4b) rates are both larger in midlatitudes than in the tropics where stratiform liquid water paths are higher. Note that these processes and diagnostics do not treat convective clouds (because the simplified convective microphysics does not have these rates), so results
5
for the tropics need to be interpreted with caution. The ratio between accretion and autoconversion (Fig. 4e) is large in the tropical troposphere below the freezing level. Because of the different vertical altitudes and sedimentation, and because it is the vertical integral that is relevant for surface precipitation rate, the vertically averagedAc
andAurates (over all altitudes, but essentially just the troposphere) are used for a ratio 10
(Fig. 4f). In CAM5, accretion (Ac) dominates with theAc/Auratio typically between 1–
10. TheAc/Au ratio is lower (more autoconversion) in the mid-latitude regions where
the liquid water path is high. In general, theAc/Auratio is larger than 1, indicating that
accretion is more important.
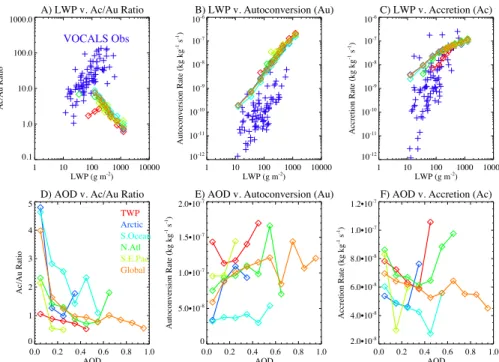
In LES simulations (Jiang et al., 2010), the ratio of accretion to autoconversion
in-15
creases with LWP. Figure 5 shows an estimate of accretion and autoconversion rates based on observations. The autoconversion and accretion rates are estimated from the droplet size distributions measured on the NCAR/NSF C-130 during the VOCALS experiment offthe west coast of South America on profile legs flown through the depth boundary layer (Wood et al., 2011). A mean droplet size distribution is calculated over
20
ten second segments, and after interpolating any gaps in the size distribution, the mass conversion of cloud to drizzle for autoconversion and accretion is calculated using the stochastic collection equation given the size distribution following the method described by Wood (2005). The 10 s-average process rates are averaged over continuous layers of liquid water content (LWC) exceeding 0.01 g m−3. The LWPs (drizzle+cloud) are
25
ACPD
13, 11789–11825, 2013Process rates and aerosol indirect
effects
A. Gettelman et al.
Title Page
Abstract Introduction
Conclusions References
Tables Figures
◭ ◮
◭ ◮
Back Close
Full Screen / Esc
Printer-friendly Version
Interactive Discussion
Discussion
P
a
per
|
Dis
cussion
P
a
per
|
Discussion
P
a
per
|
Discussio
n
P
a
per
|
cloud drops and the 2D-C probe for drizzle drops (Wood et al., 2011). Here, the ratio of accretion to autoconversion increases sharply with LWP, as in the LES simulations.
In CAM, the ratio of accretion to autoconversion (Ac/Au) decreases with LWP
(Fig. 5a), in contrast to the observations and LES models. This appears to be mostly be-cause autoconversion increases with LWP (Fig. 5b) faster than accretion (Fig. 5c). The
5
Ac/Au ratio also decreases with increasing AOD (Fig. 5d). Autoconversion increases
with AOD in any region (Fig. 5e), which is not what would be expected from the formu-lation in Khairoutdinov and Kogan (2000). It may result from the fact that LWP increases with AOD in CAM, and the convolved variables make it difficult to separate AOD-driven effects in this analysis (the positive correlation between AOD and LWP does not imply
10
causation, just covariance). Accretion decreases with AOD (Fig. 5f) in the S. Ocean and S. E. Pacific, but is nearly constant with LWP globally.
CAM has a fundamentally different relationship between the Ac/Au ratio and LWP
than seen in the steady state model in Fig. 3. The Ac/Au ratio increases with LWP
(Fig. 3a) in the steady state model or observationally based estimates in Fig. 5.
How-15
ever, in the steady state model with modified accretion, following Eq. (3) (DiagQr), the
Ac/Au ratio is 3 orders of magnitude lower than the basic steady state model, and
increases less with liquid water path, similar to the GCM.
4.2 Precipitation and autoconversion
To investigate the impact of microphysical processes and aerosols on precipitation, we
20
look at the non-dimensional ratio of the vertical integral of autoconversion (Au) or
ac-cretion (Ac) to the rain rate (R) in Fig. 6. Previous studies (e.g., Wang et al., 2012)
note that that the autoconversion/rain ratio is important in determining LWP response to CCN. In drizzling stratocumulus, this ratio is small (Wood, 2005). Wang et al. (2012) highlight that the precipitation occurrence is related to theAu/R ratio (since autocon-25
version is the initial formation of precipitation), whereas the precipitation amount is more dependent on the accretion process and theAc/R ratio. Note that in CAM, there
ACPD
13, 11789–11825, 2013Process rates and aerosol indirect
effects
A. Gettelman et al.
Title Page
Abstract Introduction
Conclusions References
Tables Figures
◭ ◮
◭ ◮
Back Close
Full Screen / Esc
Printer-friendly Version
Interactive Discussion
Discussion
P
a
per
|
Dis
cussion
P
a
per
|
Discussion
P
a
per
|
Discussio
n
P
a
per
|
autoconversion and accretion (for liquid): and that is the formation of frozen precipita-tion (snow) that melts to form rain. Hence there can be zero autoconversion or accreprecipita-tion for a non-zero rain rate in this analysis.
In Fig. 6 from the GCM, theAu/R ratio increases with LWP, from 0.0 to 0.7 globally
(Fig. 6a). There does not appear to be a clear relationship between theAu/R ratio and 5
AOD (Fig. 6c). TheAc/R ratio increases rapidly and then decreases with increasing
LWP (Fig. 6b) and decreases in many regions with higher AOD (Fig. 6d). TheAu/Rand Ac/R ratios need not add to one (i.e.Ac+Au6=R) because of the evaporation of
pre-cipitation (sum>1) or ice phase processes (sum<1). These ratios from CAM are con-sistent with other work (Wang et al., 2012). Autoconversion/rain ratios are much higher
10
than seen in embedded cloud resolving model simulations by Wang et al. (2012), and in stratocumulus observations by Wood (2005), where autoconversion played a smaller part in determining rain rates. TheAu/R ratios (Fig. 6a) are very different from those in
the steady state model with prognostic rain (Fig. 3b, green and black), where theAu/R
ratio decreases with LWP. The GCMAu/R ratio is more consistent with the increase 15
in Au/R ratio with LWP in steady state model simulations using modified accretion
(Fig. 3b, blue). The relationship between accretion and rain rate is also very different in the steady state model (Fig. 3c): where accretion increases relative to rain rate for increasing LWP, but decreases in the GCM (Fig. 6c).
4.3 Precipitation susceptibility 20
The susceptibility of precipitation (Sp) to aerosols is a part of the cloud lifetime
ef-fect (Jiang et al., 2010; Feingold and Siebert, 2009).Sp is defined in the GCM
simi-larly to the steady state model, but using the column cloud drop number (CDN) con-centration for Nd. Thus, Sp=−∂ln(R)/∂ln(CDN). In the GCM, we look at
instanta-neous output from the model at each point, and consider only points with significant
25
ACPD
13, 11789–11825, 2013Process rates and aerosol indirect
effects
A. Gettelman et al.
Title Page
Abstract Introduction
Conclusions References
Tables Figures
◭ ◮
◭ ◮
Back Close
Full Screen / Esc
Printer-friendly Version
Interactive Discussion
Discussion
P
a
per
|
Dis
cussion
P
a
per
|
Discussion
P
a
per
|
Discussio
n
P
a
per
|
(LWP>1000 g m−2). Terai et al. (2012) find only decreasing Sp with LWP in drizzling
stratocumulus when non-drizzling profiles were included. Terai et al. (2012) found no change inSp with LWP when only drizzling cases were examined. In the steady state
model (Fig. 3d),Spis generally constant and then decreases for high LWP, but not for
the case with altered accretion formulation (DiagQr), where there is higher
susceptibil-5
ity at high LWP (Fig. 3d, red).
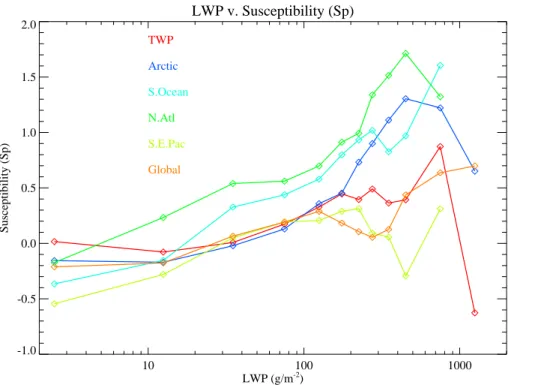
Figure 7 indicates that in CAM5, precipitation susceptibility to drop number (Sp)
in-creases with LWP. At high LWP,Spdecreases modestly in some regions. This
relation-ship is different from Sp values reported by previous studies (Jiang et al., 2010; Terai
et al., 2012), or the steady state model results (Fig. 3). Because of scatter, the
quanti-10
tative values ofSpare lower than in the steady state model (Fig. 3d). The high values
of susceptibility at higher LWP are consistent with the results above showing a strong impact of autoconversion on rain rate at higher LWP (Fig. 6a), since the autoconver-sion depends on drop number, changes in drop number will have a large impact on autoconversion and hence rain rates.
15
Maps ofSp in CAM for warm rain (Fig. 8), composited by LWP, illustrate that at low
and moderate LWP, patterns are fairly uniform, and susceptibility is low (Fig. 8a and b). At high LWP (Fig. 8c), precipitation susceptibility (Sp) is larger over the sub-tropical
equatorward parts of the oceanic storm tracks. At high LWP (Fig. 8c),Spis higher in the
N. Pacific and the SH storm track than over land.Spis lower over land at moderate and 20
high LWP. This is consistent with the Ac/Au ratio being lower (more autoconversion)
over oceanic storm tracks (Fig. 4f) where the susceptibility (Sp) is higher (Fig. 8c).
We have also looked at the ratio of the timescales for drizzle (τdriz) and condensation
(τcond) in the GCM. These are defined following Wood et al. (2009) asτdriz=ql/(Ac+Au)
and τcond=ql/Acond where Acond is the total condensation rate. Wood et al. (2009) 25
found τdriz/τcond to be a good predictor of susceptibility (Sp). We do not see strong
relationships betweenτdriz/τcondandSp. In generalτdriz/τcondis low, and condensation
dominates. Unlike the steady state model,τdriz/τcond does not seem to determine the
ACPD
13, 11789–11825, 2013Process rates and aerosol indirect
effects
A. Gettelman et al.
Title Page
Abstract Introduction
Conclusions References
Tables Figures
◭ ◮
◭ ◮
Back Close
Full Screen / Esc
Printer-friendly Version
Interactive Discussion
Discussion
P
a
per
|
Dis
cussion
P
a
per
|
Discussion
P
a
per
|
Discussio
n
P
a
per
|
5 Global sensitivity tests and ACI
5.1 Experiments
We now examine how changes to the model formulation affect process rates and aerosol indirect effects. Experiments are listed in Table 2. Each experiment is a pair of simulations, run for five years at 1.9×2.5 horizontal resolution with fixed year 2000
5
climatological SSTs and year 2000 greenhouse gas concentrations. One experiment uses year 2000 emissions, and the other 1850 emissions. SSTs and GHGs are the same in both. We have thus far shown results from the year 2000 base simulation.
Aerosol emissions for either present day (2000) or “pre-industrial” (1850), are from Lamarque et al. (2010). These are the same emissions used in the Coupled Model
10
Intercomparison Project phase 5 (CMIP5) (Taylor et al., 2012). Aerosol indirect effects (ACI) are estimated by looking at the Radiative Flux Perturbation (RFP) in pairs of simulations with different aerosol emissions. CAM5.2 has an aerosol indirect effect for liquid clouds of−1.4 W m−2and+0.4 W m−2for ice (Table 3).
Based on the results of the steady state model tests, we construct several different
15
modifications to the microphysical process rates from the base model in Sect. 4. In one experiment, we reduce autoconversion by a factor of 10 (Au/10). In another we increase accretion by a factor of 10 (Ac·10), and in a third we scale the rain mixing ratio for accretion by an exponent of 0.75 (QrScl0.75). The QrScl0.75 simulation is similar to the DiagQrl0.5 steady state model experiment. In order to ensure that the level of
20
liquid water in the simulated clouds does not decrease too much, we also scale back autoconversion in this simulation by a factor of 10.
We also explore the impact of the coupling between condensation and microphysics in the simulations by reducing the time step by a factor of 4 from 1800 to 450 s (dT/4). The dynamics time step in the CAM5 finite volume core in standard (dT =1800 s)
simu-25
ACPD
13, 11789–11825, 2013Process rates and aerosol indirect
effects
A. Gettelman et al.
Title Page
Abstract Introduction
Conclusions References
Tables Figures
◭ ◮
◭ ◮
Back Close
Full Screen / Esc
Printer-friendly Version
Interactive Discussion
Discussion
P
a
per
|
Dis
cussion
P
a
per
|
Discussion
P
a
per
|
Discussio
n
P
a
per
|
the different physical processes that are altered in this simulation, so this is not a clean experiment for changing the microphysics time-step. The intent is to try to reduce the amount of time for microphysics to deplete the condensation which occurs. We also perform an experiment whereAc is increased (·10) andAulowered (/10) so that LWP
is nearly constant (AcAu2). This experiment used a slightly different code (on a different
5
supercomputer) so it is comparable only to its own base case (Base2). These cases are detailed in Table 2.
5.2 Global results
First we report basic statistics for the radiative and precipitation impact of anthro-pogenic aerosols in the CAM5 simulations. Table 3 shows differences (2000–1850)
10
from the different aerosol emissions in the simulations. The total aerosol effect is the Radiative Flux Perturbation or RFP, the change in top of atmosphere net radiative flux (RFP=dR). The quantitative radiative indirect effect (or ACI) can be isolated in several ways, following Gettelman et al. (2012). The change in cloud radiative effect (dCRE) is representative of the indirect effect and can be broken into LW and SW components.
15
CRE is the difference between the top of atmosphere flux for all sky and clear sky con-ditions, for both shortwave (SWE) and long-wave (LWE). Alternatively, the change in clear sky shortwave flux (dFSC) is a measure of the direct scattering from aerosols, so the indirect effect (ACI) can also be RFP−dFSC. In general these measures are similar.
20
First we note that there are correlations between the change in short wave cloud radiative effect (dSWE) and the mean LWP. An examination of differences in each sim-ulation indicates that the magnitude of the ACI as defined by dCRE scale roughly in-versely with the mean liquid water path: the largest radiative effect (and change in cloud radiative effect) occurs for the boosted accretion (Ac·10) simulation, which also
25
ACPD
13, 11789–11825, 2013Process rates and aerosol indirect
effects
A. Gettelman et al.
Title Page
Abstract Introduction
Conclusions References
Tables Figures
◭ ◮
◭ ◮
Back Close
Full Screen / Esc
Printer-friendly Version
Interactive Discussion
Discussion
P
a
per
|
Dis
cussion
P
a
per
|
Discussion
P
a
per
|
Discussio
n
P
a
per
|
The results illustrate a fairly narrow range of changes in CRE due to aerosol cloud interactions, with a spread between simulations on the order of∼25 %. The change in cloud radiative effect varies slightly, despite large differences (a factor of 2) in mean LWP in Table 3. The ACI defined by dSWE is correlated with the mean LWP (r2=0.85) and dLWP (r2=0.85). Platnick and Twomey (1994) note that low LWP clouds have
5
higher albedo susceptibility (∂ln[α]/∂ln[CDN]), and these radiative effects are seen here: lower mean LWP results in higher SW effects. The liquid water path changes themselves are fairly easy to explain. Decreasing autoconversion (Au/10) increases mean present day LWP substantially. Increasing accretion (Ac·10) decreases LWP. The QrScl experiment is a combination of increasing the accretion rate through
scal-10
ing the rain mixing ratio (reducing LWP) and decreasing autoconversion to increase it again: the overall effect is to decrease LWP from the base case. The dT/4 case has 10 % higher LWP than the base simulation: this is expected since a shorter time step means less time for large amounts of cloud water to build up after macrophysics but before microphysics, thus microphysical process rates (sinks) are smaller, explaining
15
the increase in LWP. As shown by Golaz et al. (2011), these changes in LWP may af-fect ACI since changingAu and Ac affect LWP as well as ACI. We control for this by
looking at an additional simulation: the AcAu2 simulation has the same mean LWP as its control, Base2 (Table 3). ACI in this simulation is∼15 % lower than Base2, indicat-ing boostindicat-ing accretion over autoconversion does have effects on ACI independent of
20
mean LWP. Note that the change in LWP in AcAu2 is lower than Base2, so that the SW radiative ACI seems to be related to dLWP. Autoconversion is too large, and accretion increases less with LWP.
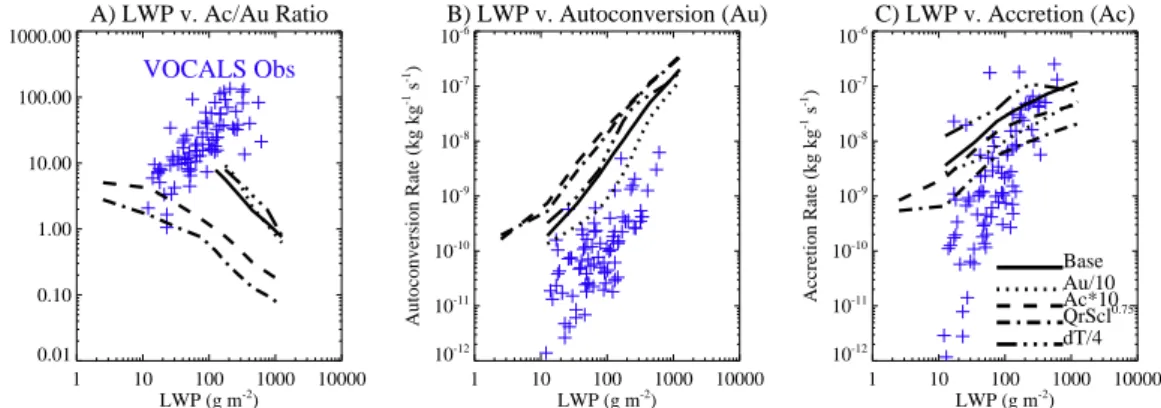
Figure 9 illustrates the process rates in the different simulations. For increased ac-cretion (Ac·10) and scaled diagnostic rain (QrScl0.75), the Ac/Au ratio is significantly 25
ACPD
13, 11789–11825, 2013Process rates and aerosol indirect
effects
A. Gettelman et al.
Title Page
Abstract Introduction
Conclusions References
Tables Figures
◭ ◮
◭ ◮
Back Close
Full Screen / Esc
Printer-friendly Version
Interactive Discussion
Discussion
P
a
per
|
Dis
cussion
P
a
per
|
Discussion
P
a
per
|
Discussio
n
P
a
per
|
observations are also included in Fig. 9 (blue), and the behavior of the model is very different than the observations for all cases, as noted for the base case in Fig. 5.
There are significant changes in the precipitation susceptibility in the different sim-ulations with altered process rates. Figure 10 illustrates the susceptibility for different simulations. The CAM5 base simulation (solid) features increasing susceptibility
glob-5
ally and in the VOCALS region up to an LWP of about 800 g m−2. The reduced au-toconversion (Au/10) case has increased susceptibility at higher LWPs. However, for the increased accretion cases (Ac·10 and QrScl0.75), with lower slope to the Accre-tion/Autoconversion ratio (Fig. 9a), the susceptibility is reduced significantly and ap-proaches zero for higher liquid water paths. The simulation with smaller time step only
10
(dT/4) features the strongest increase in susceptibility. It is not clear that this affects the radiative impact of the aerosol cloud interactions (Table 3) significantly. The QrScl0.75 simulation does have 20 % or so lower ACI, and has the lowest susceptibility at high LWP. TheAu/R ratio in these simulations (not shown) does not appear to predict the
precipitation susceptibility (Sp), in contrast to the steady state model (Fig. 3b and d). 15
6 Discussion/conclusions
Autoconversion and accretion processes are dominant in controlling the liquid water path with bulk 2 moment microphysics in the GCM. This is seen in microphysical bud-get calculations (Fig. 1) as well as in sensitivity tests, where altering these process rates has direct impacts on liquid water path (Table 3). The mean state of the GCM
20
climate (base LWP) is quite sensitive to the formulation of the microphysical process rates: accretion and autoconversion have direct impacts on sources and sinks of liquid. The coupling of these processes to the rest of the model, by altering the time step, also impacts the mean state. These results are consistent with previous work, but use analysis of observations and a steady state model.
25
ACPD
13, 11789–11825, 2013Process rates and aerosol indirect
effects
A. Gettelman et al.
Title Page
Abstract Introduction
Conclusions References
Tables Figures
◭ ◮
◭ ◮
Back Close
Full Screen / Esc
Printer-friendly Version
Interactive Discussion
Discussion
P
a
per
|
Dis
cussion
P
a
per
|
Discussion
P
a
per
|
Discussio
n
P
a
per
|
Accretion increases with respect to autoconversion as LWP increases. Autoconversion as a proportion of rain decreases at higher LWP, while accretion’s contribution in-creases. The formulation uses the same semi-empirical formulations for autoconver-sion and accretion as in the global model. The steady state model has very different behavior when used with a modified formulation of accretion to reflect the behavior of
5
diagnostic precipitation in the GCM. Here the autoconversion contribution to rain re-mains high as LWP increases, as in the GCM. Further adjusting process rates can partially recover the initial behavior with higher levels of accretion relative to autocon-version in the unmodified steady state model. The susceptibility of precipitation to drop number decreases with liquid water path in the unmodified steady state model, but
re-10
mains constant at high liquid water paths with the assumptions about rain used in the GCM, consistent with theAu/R relationship.
The behavior of the CAM5 GCM is similar to the steady state model with the modi-fied accretion formulation. In the model, autoconversion is much more important, and increases relative to accretion at higher liquid water paths (Fig. 5). The
microphysi-15
cal behavior seems fairly consistent across regions. The proportion of rain from au-toconversion also increases as LWP increases (Fig. 6). Because auau-toconversion is dependent strongly on drop number, it links aerosols to cloud lifetime increases and the decrease in precipitation. Susceptibility increases with LWP in CAM up to large values of LWP (Fig. 7), and higher susceptibility is found in regions with higher LWP
20
(Fig. 8), and lowerAc/Auratios (Fig. 4f).
Posselt and Lohmann (2008) showed that diagnostic rain leads to overestimating the importance of autoconversion and Wang et al. (2012) showed that theAu/Rratio
corre-lated with the sensitivity of LWP to aerosols. Here we illustrate that using a “diagnostic-like” formulation in the steady state model can drastically shift the rain formation from
25
accretion to autoconversion. Attempting to correct the GCM by boosting accretion (as in Ac·10 or QrScl0.75), the GCM still has a difficult time capturing the expected behavior of theAc/Au ratio (as evidenced by how theAc/Au ratio for QrScl
0.75
ACPD
13, 11789–11825, 2013Process rates and aerosol indirect
effects
A. Gettelman et al.
Title Page
Abstract Introduction
Conclusions References
Tables Figures
◭ ◮
◭ ◮
Back Close
Full Screen / Esc
Printer-friendly Version
Interactive Discussion
Discussion
P
a
per
|
Dis
cussion
P
a
per
|
Discussion
P
a
per
|
Discussio
n
P
a
per
|
LWP is still present in the GCM, susceptibility does appear to be modified (reduced) when the process rates are modified (Fig. 10), or when the time step is shortened. In the GCM, spatial changes in the accretion/autoconversion ratio (Fig. 4) appear to be reflected in the precipitation susceptibility (Fig. 8), but this is not apparent in the global averages in Fig. 9, likely due to the averaging across regimes.
5
In the GCM, the susceptibility does not correlate with theAc/Auas strongly as in the
steady state model (when comparing DiagQr and DiagQr0.5in Fig. 3).Spseems related
to the slope of theAc/Au ratio. Comparing Figs. 9 and 10, the runs with higherAc/Au
ratios do not have lower susceptibilities at high LWP as expected. QrScl0.75and Ac·10 cases have lower LWP and lowerAc/Auratio, but reducedSpat high LWP. Note that this 10
might be related to the LWP: in the steady state model base case in Fig. 3, theAc/Au
ratio of the base case increases substantially, but susceptibility doesn’t really respond until at around LWP∼500 g m−2. This highlights the complexity of the interactions in the GCM, where multiple processes are affecting LWP in multiple regimes. There are also ice processes in many GCM regions that complicate the analysis.
15
The radiative Aerosol-Cloud Interactions (ACI, also called indirect effects) are sensi-tive to these process rate changes, but the changes may be convolved with differences in base state LWP, similar to Golaz et al. (2011). The larger radiative impacts of cloud-aerosol interactions occur for the largest percent changes in liquid water path and drop number in the Ac·10 simulation with enhanced accretion. When the steady state
20
model diagnostic rain “correction” is applied to accretion in the GCM (QrScl0.75), ACI is reduced by 20 % between this calculation and the enhanced accretion case (Ac·10) with similar mean LWP (Table 3). Or stated another way: with half the LWP of the Base case, essentially the same ACI is predicted. A different experiment with reduced au-toconversion and increased accretion (AcAu2) to maintain the same LWP as the base
25
case also reduced ACI by∼15 %. This is consistent with the reduced susceptibility in Fig. 10.
ACPD
13, 11789–11825, 2013Process rates and aerosol indirect
effects
A. Gettelman et al.
Title Page
Abstract Introduction
Conclusions References
Tables Figures
◭ ◮
◭ ◮
Back Close
Full Screen / Esc
Printer-friendly Version
Interactive Discussion
Discussion
P
a
per
|
Dis
cussion
P
a
per
|
Discussion
P
a
per
|
Discussio
n
P
a
per
|
also be made to produce similar relationships as in the global model: which we at-tribute to the differences between prognostic and diagnostic precipitation. It does not appear as if the bulk, semi-empirical formulations of the process rates derived from fits to a CRM by Khairoutdinov and Kogan (2000) cause the relative increase in Au-toconversion over Accretion with higher LWP, since this does not occur in the steady
5
state model with these formulations. This is an important conclusion for many scales of modeling. It appears that radiative ACI in the GCM may be sensitive to the formula-tion of the diagnostic precipitaformula-tion. CAM5 is conceptually similar to many other GCMs in how it treats cloud microphysics and aerosols, so these results might be generally applicable across models. Possible sensitivities to LWP confound this interpretation,
10
consistent with radiative effects (Platnick and Twomey, 1994) and recent GCM tun-ing experiments (Golaz et al., 2011). It appears that reductions of ACI of 20 % or so, and decreases in precipitation susceptibility (Fig. 10) result from these process rate changes.
These conclusions will need further testing in both GCM and off-line frameworks,
15
including in other GCMs. We are continuing this research both by extending the Mor-rison and Gettelman (2008) microphysics scheme to include prognostic precipitation. The possibility also exists that the numerics may have an impact. The combination of the diagnostic precipitation assumption with relatively long time steps (20 min, with 10 min iterations for precipitation), as well as coarse vertical grid spacing (500–1000 m
20
in the free troposphere) may impact the simulations. We intend to explore these nu-merical issues further with a detailed 1 d model as a step on the way to more robust formulations of microphysics that work across different time and space scales.
Acknowledgements. Computing resources were provided by the Climate Simulation
Labora-tory at National Center for Atmospheric Research (NCAR) Computational and Information
Sys-25
ACPD
13, 11789–11825, 2013Process rates and aerosol indirect
effects
A. Gettelman et al.
Title Page
Abstract Introduction
Conclusions References
Tables Figures
◭ ◮
◭ ◮
Back Close
Full Screen / Esc
Printer-friendly Version
Interactive Discussion
Discussion
P
a
per
|
Dis
cussion
P
a
per
|
Discussion
P
a
per
|
Discussio
n
P
a
per
|
References
Ackerman, A. S., Kirkpatrick, M. P., Stevens, D. E., and Toon, O. B.: The impact of humidity above stratiform clouds on indirect aerosol climate forcing, Nature, 432, 1014–1017, 2004. 11791
Albrecht, B. A.: Aerosols, cloud microphysics and fractional cloudiness, Science, 245, 1227–
5
1230, 1989. 11791
Boucher, O. and Lohmann, U.: The sulfate-CCN-cloud albedo effect, a sensitivity study with two general circulation models, Tellus, 47B, 281–300, 1995. 11791
Feingold, G. and Siebert, H.: Cloud–Aerosol interactions from the Micro to the Cloud Scale, in: Clouds in the Perturbed Climate System, edited by: Heintzenberg, J. and Charlson, R. J.,
10
MIT Press, 2009. 11792, 11800
Gettelman, A., Morrison, H., and Ghan, S. J.: A new two-moment bulk stratiform cloud micro-physics scheme in the NCAR Community Atmosphere Model (CAM3), Part II: Single-column and global results, J. Climate, 21, 3660–3679, 2008. 11793
Gettelman, A., Liu, X., Ghan, S. J., Morrison, H., Park, S., Conley, A. J., Klein, S., Boyle, J.,
15
Mitchell, D. L., and Li, J.-L. F.: Global simulations of ice nucleation and ice supersaturation with an improved cloud scheme in the community atmosphere model, J. Geophys. Res., 115, D18216, doi:10.1029/2009JD013797, 2010. 11793
Gettelman, A., Kay, J. E., and Shell, K. M.: The Evolution of climate feedbacks in the commu-nity atmosphere model, J. Climate, 25, 1453–1469, doi:10.1175/JCLI-D-11-00197.1, 2012.
20
11794, 11803
Golaz, J.-C., Saltzmann, M., Donner, L. J., Horowitz, L. W., Ming, Y., and Zhao, M.: Sen-sitivity of the aerosol indirect effect to subgrid variability in the cloud parameterization of the GFDL Atmosphere General Circulation Model AM3, J. Climate, 24, 3145–3160, doi:10.1175/2010JCLI3945.1, 2011. 11792, 11804, 11807, 11808
25
Guo, H., Golaz, J.-C., and Donner, L. J.: Aerosol effects on stratocumulus water paths in a PDF-based parameterization, Geophys. Res. Lett., 38, L17808, doi:10.1029/2011GL048611, 2011. 11791
Jiang, H., Feingold, G., and Sorooshian, A.: Effect of aerosol on the susceptibility and efficiency of precipitation in warm trade cumulus clouds, J. Atmos. Sci., 67, 3526–3540, 2010. 11792,
30
ACPD
13, 11789–11825, 2013Process rates and aerosol indirect
effects
A. Gettelman et al.
Title Page
Abstract Introduction
Conclusions References
Tables Figures
◭ ◮
◭ ◮
Back Close
Full Screen / Esc
Printer-friendly Version
Interactive Discussion
Discussion
P
a
per
|
Dis
cussion
P
a
per
|
Discussion
P
a
per
|
Discussio
n
P
a
per
|
Khairoutdinov, M. F. and Kogan, Y.: A new cloud physics parameterization in a large-eddy sim-ulation model of marine stratocumulus, Mon. Weather Rev., 128, 229–243, 2000. 11792, 11793, 11795, 11798, 11799, 11808
Lamarque, J.-F., Bond, T. C., Eyring, V., Granier, C., Heil, A., Klimont, Z., Lee, D., Liousse, C., Mieville, A., Owen, B., Schultz, M. G., Shindell, D., Smith, S. J., Stehfest, E., Van
Aar-5
denne, J., Cooper, O. R., Kainuma, M., Mahowald, N., McConnell, J. R., Naik, V., Riahi, K., and van Vuuren, D. P.: Historical (1850–2000) gridded anthropogenic and biomass burn-ing emissions of reactive gases and aerosols: methodology and application, Atmos. Chem. Phys., 10, 7017–7039, doi:10.5194/acp-10-7017-2010, 2010. 11802
Liu, X., Easter, R. C., Ghan, S. J., Zaveri, R., Rasch, P., Shi, X., Lamarque, J.-F.,
Gettel-10
man, A., Morrison, H., Vitt, F., Conley, A., Park, S., Neale, R., Hannay, C., Ekman, A. M. L., Hess, P., Mahowald, N., Collins, W., Iacono, M. J., Bretherton, C. S., Flanner, M. G., and Mitchell, D.: Toward a minimal representation of aerosols in climate models: description and evaluation in the Community Atmosphere Model CAM5, Geosci. Model Dev., 5, 709–739, doi:10.5194/gmd-5-709-2012, 2012. 11793
15
Martin, G. M., Johnson, D. W., and Spice, A.: The measurement and parameterization of eff ec-tive radius of droplets in warm stratocumulus clouds, J. Atmos. Sci., 51, 1823–1842, 1994. 11791
Morrison, H. and Gettelman, A.: A new two-moment bulk stratiform cloud microphysics scheme in the NCAR Community Atmosphere Model (CAM3), Part I: Description and numerical tests,
20
J. Climate, 21, 3642–3659, 2008. 11793, 11795, 11808
Murphy, D. M., Solomon, S., Portmann, R. W., Rosenlof, K. H., Forster, P. M., and Wong, T.: An observationally based energy balance for the Earth since 1950, J. Geophys. Res., 114, D17107, doi:10.1029/2009JD012105, 2009. 11791
Neale, R. B., Chen, C. C., Gettelman, A., Lauritzen, P. H., Park, S., Williamson, D. L., Conley, A.
25
J., Garcia, R., Kinnison, D., Lamarque, J. F., Marsh, D., Mills, M., Smith, A. K., Tilmes, S., Vitt, F., Cameron-Smith, P., Collins, W. D., Iacono, M. J., Easter, R. C., Ghan, S. J., Liu, X., Rasch, P. J., and Taylor, M. A.: Description of the NCAR Community Atmosphere Model (CAM5.0), Tech. Rep. NCAR/TN-486+STR, National Center for Atmospheric Research, Boulder, CO, USA, 2010. 11793
30
ACPD
13, 11789–11825, 2013Process rates and aerosol indirect
effects
A. Gettelman et al.
Title Page
Abstract Introduction
Conclusions References
Tables Figures
◭ ◮
◭ ◮
Back Close
Full Screen / Esc
Printer-friendly Version
Interactive Discussion
Discussion
P
a
per
|
Dis
cussion
P
a
per
|
Discussion
P
a
per
|
Discussio
n
P
a
per
|
Posselt, R. and Lohmann, U.: Introduction of prognostic rain in ECHAM5: design and single column model simulations, Atmos. Chem. Phys., 8, 2949–2963, doi:10.5194/acp-8-2949-2008, 2008. 11791, 11792, 11796, 11806
Quaas, J., Boucher, O., Bellouin, N., and Kinne, S.: Satellite-based estimate of the direct and indirect aerosol climate forcing, J. Geophys. Res., 113, D05204, doi:10.1029/2007JD008962,
5
2008. 11791
Ramanathan, V., Crutzen, P. J., Kiehl, J. T., and Rosenfeld, D.: Aerosols, climate and the hydro-logic cycle, Science, 294, 2119–2124, 2001. 11791
Rosenfeld, D., Lohmann, U., Raga, G. B., O’Dowd, C. D., Kulmala, M., Fuzzi, S., Reissell, A., and Andreae, M. O.: Flood or drought: how do aerosols affect precipitation, Science, 321,
10
1309–1313, 2008. 11791
Sorooshian, A., Feingold, G., Lebsock, M. D., Jiang, H., and Stephens, G. L.: On the precip-itation susceptibility of clouds to aerosol perturbations, Geophys. Res. Lett., 36, L13803, doi:10.1029/2009GL038993, 2009. 11797
Stevens, B. and Seifert, A.: Understanding microphysical outcomes of microphysical choices
15
in simulations of shallow cumulus convection, J. Meteorol. Soc. Jpn., 86, 143–162, 2008. 11792
Taylor, K. E., Stouffer, R. J., and Meehl, G. A.: An Overview of CMIP5 and the Experiment Design, B. Am. Meteorol. Soc, 93, 485–498, doi::10.1175/BAMS-D-11-00094.1, 2012. 11802 Terai, C. R., Wood, R., Leon, D. C., and Zuidema, P.: Does precipitation susceptibility vary with
20
increasing cloud thickness in marine stratocumulus?, Atmos. Chem. Phys., 12, 4567–4583, doi:10.5194/acp-12-4567-2012, 2012. 11792, 11797, 11801
Twomey, S.: The influence of pollution on the shortwave albedo of clouds, J. Atmos. Sci., 34, 1149–1152, 1977. 11790
Wang, M., Ghan, S., Liu, X., L’Ecuyer, T. S., Zhang, K., Morrison, H., Ovchinnikov, M., Easter,
25
R., Marchand, R., Chand, D., Qian, Y., and Penner, J. E.: Constraining cloud lifetime ef-fects of aerosols using A-Train Satellite observations, Geophys. Res. Lett., 39, L15709, doi:10.1029/2012GL052204, 2012. 11791, 11792, 11796, 11797, 11799, 11800, 11806 Wood, R.: Drizzle in stratiform boundary layer clouds. Part II: Microphysical aspects, J. Atmos.
Sci., 62, 3034–3050, 2005. 11792, 11798, 11799, 11800
30
for-ACPD
13, 11789–11825, 2013Process rates and aerosol indirect
effects
A. Gettelman et al.
Title Page
Abstract Introduction
Conclusions References
Tables Figures
◭ ◮
◭ ◮
Back Close
Full Screen / Esc
Printer-friendly Version
Interactive Discussion
Discussion
P
a
per
|
Dis
cussion
P
a
per
|
Discussion
P
a
per
|
Discussio
n
P
a
per
|
mation, J. Atmos. Sci., 66, 2973–2990, doi:10.1175/2009JAS3072.1, 2009. 11792, 11794, 11795, 11801, 11817, 11818
Wood, R., Mechoso, C. R., Bretherton, C. S., Weller, R. A., Huebert, B., Straneo, F., Al-brecht, B. A., Coe, H., Allen, G., Vaughan, G., Daum, P., Fairall, C., Chand, D., Gallardo Klen-ner, L., Garreaud, R., Grados, C., Covert, D. S., Bates, T. S., Krejci, R., Russell, L. M.,
5
de Szoeke, S., Brewer, A., Yuter, S. E., Springston, S. R., Chaigneau, A., Toniazzo, T., Min-nis, P., Palikonda, R., Abel, S. J., Brown, W. O. J., Williams, S., Fochesatto, J., Brioude, J., and Bower, K. N.: The VAMOS Ocean-Cloud-Atmosphere-Land Study Regional Experiment (VOCALS-REx): goals, platforms, and field operations, Atmos. Chem. Phys., 11, 627–654, doi:10.5194/acp-11-627-2011, 2011. 11798, 11799
10
ACPD
13, 11789–11825, 2013Process rates and aerosol indirect
effects
A. Gettelman et al.
Title Page
Abstract Introduction
Conclusions References
Tables Figures
◭ ◮
◭ ◮
Back Close
Full Screen / Esc
Printer-friendly Version
Interactive Discussion
Discussion
P
a
per
|
Dis
cussion
P
a
per
|
Discussion
P
a
per
|
Discussio
n
P
a
per
|
Table 1.Description of steady state simulations.
Name Description
Base Base simulation
ACPD
13, 11789–11825, 2013Process rates and aerosol indirect
effects
A. Gettelman et al.
Title Page
Abstract Introduction
Conclusions References
Tables Figures
◭ ◮
◭ ◮
Back Close
Full Screen / Esc
Printer-friendly Version
Interactive Discussion
Discussion
P
a
per
|
Dis
cussion
P
a
per
|
Discussion
P
a
per
|
Discussio
n
P
a
per
|
Table 2.Description of global simulations used in this study.
Name Description
Base Base simulation
Au/10 Autoconversion rate divided by 10× Ac·10 Accretion rate increased by 10× QrScl0.75 Scaled rain mixing ratio for accretion
ACPD
13, 11789–11825, 2013Process rates and aerosol indirect
effects
A. Gettelman et al.
Title Page
Abstract Introduction
Conclusions References
Tables Figures
◭ ◮
◭ ◮
Back Close
Full Screen / Esc
Printer-friendly Version
Interactive Discussion
Discussion
P
a
per
|
Dis
cussion
P
a
per
|
Discussion
P
a
per
|
Discussio
n
P
a
per
|
Table 3.Table of radiative property changes (year 2000–1850) from simulations. Illustrated are
change in top of atmosphere radiative fluxes (R), net cloud radiative effect (CRE) as well as the long-wave effect (LWE) and shortwave effect (SWE) components, the change in clear-sky shortwave radiation (FSC), ice water path (IWP) and year 2000 liquid water path (LWP). Also shown are changes to in-cloud ice number concentration (INC) and column liquid drop number (CDN).
Run dR dCRE dLWE dSWE dFSC LWP dLWP dINC dCDN
W m−2 W m−2 W m−2 W m−2 W m−2 g m−2 g m−2 L−1 1010cm−2
Base −1.40 −1.06 0.48 −1.54 −0.46 44.0 3.1 (7 %) 6.4 (13 %) 0.62 (40 %)
Au/10 −1.31 −1.01 0.40 −1.41 −0.36 65.0 3.2 (5 %) 5.9 (12 %) 0.76 (35 %)
Ac·10 −1.37 −1.22 0.70 −1.92 −0.34 28.1 2.7 (10 %) 9.1 (17 %) 0.41 (48 %)
QrScl −1.18 −1.00 0.68 −1.68 −0.35 31.2 1.4 (5 %) 9.5 (17 %) 0.42 (41 %)
dT/4 −1.37 −1.01 0.36 −1.37 −0.61 49.0 3.2 (7 %) 7.8 (8 %) 0.61 (36 %)
Base2 −1.55 −1.25 0.43 −1.68 −0.32 44.4 3.2 (7 %) 6.6 (12 %) 0.64 (41 %)
ACPD
13, 11789–11825, 2013Process rates and aerosol indirect
effects
A. Gettelman et al.
Title Page
Abstract Introduction
Conclusions References
Tables Figures
◭ ◮
◭ ◮
Back Close
Full Screen / Esc
Printer-friendly Version
Interactive Discussion
Discussion
P
a
per
|
Dis
cussion
P
a
per
|
Discussion
P
a
per
|
Discussio
n
P
a
per
|
A) S.Ocean B) S.E. Pacific (VOCALS) C) W. Pacific
(-65 to -50 lat, 0 to 360 lon) -0.0010 -0.0005 0.0000 0.0005 0.0010
kg/kg/day 1000
800 600 400 200
Pressure (hPa)
MP Liq Liq Sed
Cond Resid
Imm Frz
Cnt Frz
Bergeron Melt I
Homo Frz
Rime Splint Berg Snow Accret
Accre Snow
Autoconv
(-35 to -15 lat, 255 to 285 lon) -0.0004 -0.0002 0.0000 0.0002 0.0004
kg/kg/day 1000
800 600 400 200
Pressure (hPa)
(-20 to 20 lat, 120 to 160 lon) -0.0006 -0.0004 -0.0002 0.0000 0.0002 0.0004 0.0006
kg/kg/day 1000
800 600 400 200
Pressure (hPa)
Fig. 1.Profiles of annual average grid mean liquid microphysical process rates (colored solid
ACPD
13, 11789–11825, 2013Process rates and aerosol indirect
effects
A. Gettelman et al.
Title Page
Abstract Introduction
Conclusions References
Tables Figures
◭ ◮
◭ ◮
Back Close
Full Screen / Esc
Printer-friendly Version
Interactive Discussion
Discussion
P
a
per
|
Dis
cussion
P
a
per
|
Discussion
P
a
per
|
Discussio
n
P
a
per
|
10 100 1000
LWP [g m-2] 10
100 1000
N_d [cm-3]
A) Steady State Rain Rate (mm/day)
Base Qcv=0 DiagQr
10 100 1000
LWP [g m-2] 10
100 1000
N_d [cm-3]
B) Steady State Rain Rate (mm/day)
Base Qcv=0 + DiagQr^0.5
Fig. 2.Results from steady state model of Wood et al. (2009). Rain rate (mm day−1), contour
ACPD
13, 11789–11825, 2013Process rates and aerosol indirect
effects
A. Gettelman et al.
Title Page
Abstract Introduction
Conclusions References
Tables Figures
◭ ◮
◭ ◮
Back Close
Full Screen / Esc
Printer-friendly Version
Interactive Discussion
Discussion
P
a
per
|
Dis
cussion
P
a
per
|
Discussion
P
a
per
|
Discussio
n
P
a
per
|
A) LWP v. Ac/Au
10 100 1000
LWP [g m-2] 0.001
0.010 0.100 1.000 10.000 100.000 1000.000
Ac/Au Ratio
B) LWP v. Au/Rain
10 100 1000
LWP [g m-2] 0.01
0.10 1.00 10.00
Au/Rain Ratio
C) LWP v. Ac/Rain
10 100 1000
LWP [g m-2] 0.001
0.010 0.100 1.000 10.000
Ac/Rain Ratio
D) LWP v. Precip Susceptibility (Sp)
10 100 1000
LWP [g m-2] 0.0
0.5 1.0 1.5 2.0
Susceptibility (Sp)
Fig. 3.Results from steady state model of Wood et al. (2009).(A)LWP vs. Accretion to
Au-toconversion ratio (Ac/Au), (B)LWP vs. Autoconversion to Rain Rate (Au/Rain),(C)LWP vs.
the ratio of Accretion to Rain rate (Ac/Rain) and(D)LWP vs. Precipitation Susceptibility. Cases