Metabolic acid-base adaptation triggered by acute
persistent hypercapnia in mechanically ventilated
patients with acute respiratory distress syndrome
INTRODUCTION
Acute respiratory distress syndrome (ARDS) is a common reason for initiating ventilatory support in critically ill patients.(1) ARDS mortality remains as high as 54% despite advances in critical care.(2) To minimize ventilator-induced lung injury,(3) a protective mechanical ventilation based on lower tidal volumes and lower distention pressures is recommended.(4)
Thiago Gomes Romano1,2, Mario Diego Teles Correia3, Pedro Vitale Mendes2,3, Fernando Godinho Zampieri3, Alexandre Toledo Maciel2,3, Marcelo Park3
1. Department of Nephrology, Faculdade de Medicina do ABC - Santo André (SP), Brazil. 2. Intensive Care Unit, Hospital Sírio Libanês, São Paulo, Brazil.
3. Intensive Care Unit, Emergency Department, Hospital das Clinicas, Faculdade de Medicina, Universidade de São Paulo - São Paulo (SP), Brazil.
Objective: Hypercapnia resulting
from protective ventilation in acute respiratory distress syndrome triggers metabolic pH compensation, which is not entirely characterized. We aimed to describe this metabolic compensation.
Methods: he data were retrieved
from a prospective collected database. Variables from patients’ admission and from hypercapnia installation until the third day after installation were gathered. Forty-one patients with acute respiratory distress syndrome were analyzed, including twenty-six with persistent hypercapnia (PaCO2 > 50mmHg > 24 hours) and 15 non-hypercapnic (control group). An acid-base quantitative physicochemical approach was used for the analysis.
Results: he mean ages in the
hypercapnic and control groups were 48 ± 18 years and 44 ± 14 years, respectively. After the induction of hypercapnia, pH markedly decreased and gradually improved in the ensuing 72 hours, consistent with increases in the standard base excess. he metabolic acid-base adaptation occurred because of decreases
Conflicts of interest: None.
Submitted on September 6, 2015 Accepted on January 22, 2016
Corresponding author:
Thiago Gomes Romano
Rua Camilo Nader, 380, casa 6 - Real Parque Zip code: 05688-032 - São Paulo, Brazil E-mail: [email protected]
Responsible editor: Flávia Ribeiro Machado
Adaptação metabólica diante de hipercapnia persistente aguda
em pacientes submetidos à ventilação mecânica por síndrome do
desconforto respiratório agudo
ABSTRACT
Keywords: Acidosis, respiratory;
Respiratory distress syndrome, adult; Acid-base equilibrium; Respiration, artiicial; Intensive care units
in the serum lactate and strong ion gap and increases in the inorganic apparent strong ion diference. Furthermore, the elevation in the inorganic apparent strong ion diference occurred due to slight increases in serum sodium, magnesium, potassium and calcium. Serum chloride did not decrease for up to 72 hours after the initiation of hypercapnia.
Conclusion: In this explanatory
study, the results indicate that metabolic acid-base adaptation, which is triggered by acute persistent hypercapnia in patients with acute respiratory distress syndrome, is complex. Furthermore, further rapid increases in the standard base excess of hypercapnic patients involve decreases in serum lactate and unmeasured anions and increases in the inorganic apparent strong ion diference by means of slight increases in serum sodium, magnesium, calcium, and potassium. Serum chloride is not reduced.
Lung injury increases dead space ventilation.(5) Furthermore, protective ventilation is associated with reduced efective alveolar ventilation; both factors result in inefective carbon dioxide clearance from the blood, resulting in hypercapnia.(6) Currently, there is no consistently demonstrated clinical beneit of hypercapnia in ARDS patients.(7)
Protective ventilation-induced hypercapnia evokes metabolic responses toward pH normalization within a short period.(6) In patients with chronic hypercapnic hypoventilation, the metabolic acid-base adaptation is related to plasmatic bicarbonate (HCO3) elevation and chloride reduction.(8) Normal subjects who are acutely exposed to hypercapnia exhibit increased urinary chloride elimination.(9) In contrast, critically ill patients commonly present with reduced renal chloride removal.(10,11) herefore, the mechanism of pH compensation in hypercapnic patients with ARDS has not been established. he aim of this study was to explore the mechanisms involved in pH compensation during acute hypercapnia in patients with ARDS for at least 24 hours.
METHODS
he Ethical Committee of the Hospital das Clínicas
of Faculdade de Medicina of the Universidade de São Paulo approved this study (approval document number 107.443), and informed written consent was waived. Patient records/information was anonymized and de-identiied prior to analysis.
We retrospectively reviewed electronic medical records that were prospectively collected from 1275 patients who were consecutively admitted to our intensive care unit (ICU) from June 2007 to June 2012.
he inclusion criteria were bilateral pulmonary iniltrates on the X-ray, acute onset of hypoxemia, P/F ratio < 300mmHg using a positive end-expiratory pressure
(PEEP) ≥ 5cmH2O, and no cardiogenic cause of the
pulmonary iniltrate.
he exclusion criteria were chronic renal failure on dialysis support, acute kidney injury with any renal replacement therapy mode necessity, bicarbonate infusion and chronic hypercapnia.
he patients were categorized according to the presence or lack of persistent acute hypercapnia. Persistent acute hypercapnia was deined as a partial pressure of carbon dioxide (PaCO2) greater than 50mmHg for more than 24 hours, with at least three arterial blood gas sample analyses
normal PaCO2 values and without a history of chronic hypercapnia. he hypercapnic group was compared with the control group in order to explore the metabolic compensation to the hypercapnia.
ARDS was deined according to the Berlin conference.(12) he information that was obtained from the patients’ charts included the following: demographic characteristics (age, gender, weight, height and co-morbidities) and ICU data from the time of admission until the third day after hypercapnia diagnosis [respiratory failure etiology, expected mortality (calculated by the Acute Physiology and Chronic Health disease Classiication
System - APACHE II)](13) or the simpliied acute
physiological score (SAPS 3),(14) sequential organ failure assessment (SOFA)(15) score on the irst day of ICU stay, need for vasopressors and/or inotropics, laboratory data, luid balance, diuresis, and daily variations in heart rate, respiratory rate, temperature and mean arterial pressure.
Acid-base arterial blood samples from the day of ICU admission and one day before the hypercapnia installation, with three samples every 8 hours on the day of hypercapnia installation and up to three days after hypercapnia initiation, were analyzed as well as clinical and physiological daily data from these same days. We emphasize that all of the patients were admitted with the diagnosis of ARDS. he laboratorial data that were retrieved during the hypercapnia installation were routinely collected at least every 8 hours until PaCO2
stabilization (generally considered when the PaCO2
variation is < 3 - 5%). In the control group, samples were collected at admission and after 24, 48, 72 and 96 hours.
A quantitative physicochemical approach was used to analyze the acid-base variables.(16) In this approach, after several adaptations,(17) the [H+] concentration and, hence, pH, were determined using ive independent variables: inorganic apparent strong ion diference (SIDai), strong ion gap (SIG), lactate, weak acids in plasma (Atot), and PaCO2 variation.(18) he standard equations that were used in this study were the following:
SIDai (mEq/L) = Na+(mEq/L) + K+(mEq/L) + Ca2+(mEq/L) + Mg2+(mEq/L) – Cl-(mEq/L)
SIG (mEq/L) = SIDai - [2.46 × 10pH-8 × PaCO
2 (mmHg) + (albumin (g/L) × (0.123 × pH - 0.631)) + (phosphate (mmol/L) × (0.309 × pH - 0.469))]
A positive SIG value represents the presence of unmeasured anions, which must be included to determine the measured pH. he standard base excess (SBE) was used in our study to diagnose and quantify the metabolic acid-base variations.(18) he source of SBE variations was analyzed based on SIDai, SIG, lactate, albumin, and phosphate variations.(18)
Statistical analysis
he data distribution was analyzed using the Shapiro-Wilk goodness-of-it model. he qualitative data, which are shown as occurrences and percentages, were analyzed using Fisher’s exact test or chi-square test as appropriate. he quantitative data are presented as the mean and standard deviation values or the medians [25th percentile and 75th percentile], depending on whether the values are parametric or non-parametric, respectively.
he quantitative baseline data were analyzed
using non-paired t-test or Mann-Whitney’s test as
appropriate. he quantitative data of two groups over time were analyzed using interaction analyses and a mixed generalized model with the patient as a random factor for determining the within-subject correlation among repeated observations. he Markov chain Monte Carlo procedure using 1000 simulations to obtain the equilibrium of distributions was used to reach a ixed likelihood of each resulting independent variable. he post hocanalyses for interactions were performed using Mann-Whitney’s or Wilcoxon’s tests as appropriate. he R free open-source statistical package and Comprehensive-R Archive Network (CRAN)-speciic libraries were used to build the graphics and to perform all of the statistical analyses.(19)
RESULTS
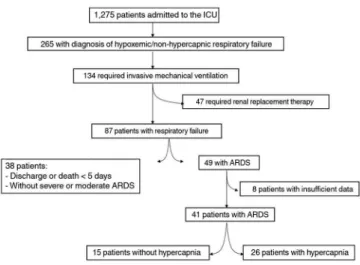
here were 49 (4%) patients out of 1275 ICU admissions with ARDS who did not require renal replacement therapy during the study period. A total of 41 patients had the necessary data and were enrolled in the analysis: 26 (64%) patients who developed hypercapnia and 15 (36%) who did not develop hypercapnia as the control group (Figure 1). No patients received diuretics.
he general data for the patients, stratiied according
to the group, are shown in table 1. he maximum CO2
levels in the hypercapnic group occurred within the irst 48 hours after the patients’ admission, with mean values of
Figure 1 - Flowchart of the study. The patients’ data were collected from June 2007 to June 2012. ICU - intensive care unit; ARDS - acute respiratory distress syndrome.
60mmHg. Subsequently, a signiicant diference between groups was observed up to the third day after hypercapnia commencement (Figure 2).
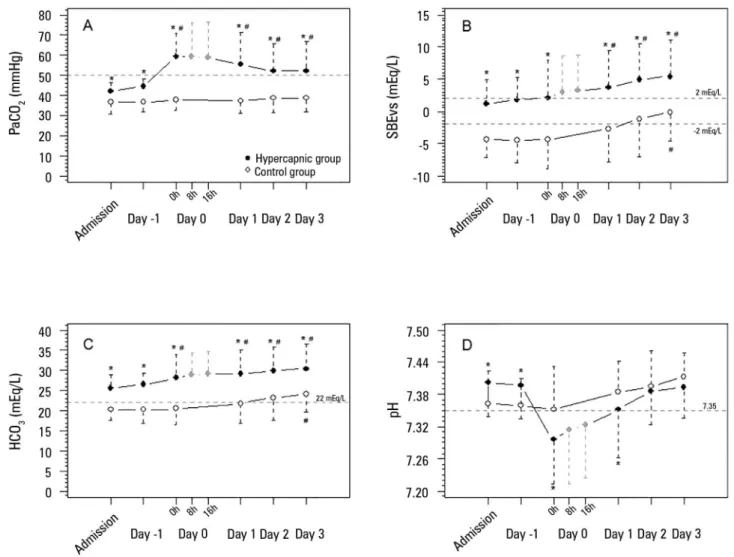
Concomitant with the increasing CO2, the pH
levels decreased, with the lowest values observed on the second day of admission. In the ensuing days, the pH gradually increased to values similar to those observed in the control group. he increases in pH were
accompanied by SBE and HCO3 elevations, both with
a signiicant diference between the groups (Figure 2). In addition to the SBE elevation, from day 1 to day 3, the PaCO2 slightly decreased, remaining greater than 50mmHg.
normalization. he SBE variation in the hypercapnic group could be attributed to an increase in SIDai and a decrease in lactate and in SIG. he SIDai variation was not attributed to chloride variation. In contrast, SIDai improved because of an increase in serum sodium, magnesium and potassium.
Hypercapnia is occasionally required to allow protective ventilation in patients with ARDS. However, the CO2 efect per se (without the concomitant efect of the tidal overdistention reduction) on lung protection and clinical outcomes is controversial.(20-23) Patients with acute and persistent hypercapnia, in the absence of renal failure, evolve a metabolic compensation toward pH normalization in a short time period (approximately 36 hours).(6) his pH compensation makes the tidal volume reduction more acceptable in patients with ARDS.(21)
In our patients, the initial reduced pH promptly moved toward normalization after the initiation of hypercapnia, reaching normal values within a period of 24 - 48 hours.
he metabolic response was indicated by HCO3 and
SBE elevations. he striking initial HCO3 elevation most likely occurred because of a stoichiometric factor, i.e., the elevated CO2 reacted with water, thereby increasing the HCO3 and H+.(24) SBE is an independent variable from the acute PCO2 variation;(24) thus, a striking initial elevation did not occur in the SBE in our study. he elevation of SBE and its components occurred in both groups during the observed days but was slightly more accentuated in the hypercapnic group during days 1, 2 and 3, when the mean values of SBE were signiicantly diferent between groups. he former group presented a less-increased SBE than that of the control group in the admission, probably secondary to the higher PaCO2 already at this time in the hypercapnic group.
Exploring the SBE and HCO3 elevations after the initiation of hypercapnia, we observed three associated factors in our indings: irst, increases in SIDai; second, decreases in lactate; and third, decreases in SIG. he increases in SIDai occurred because of several slight increases in sodium, calcium, magnesium and potassium. We emphasize that serum chloride did not decrease after the initiation of hypercapnia. It is of note that in hypercapnic stable patients with COPD, pH compensation occurred based on a HCO3 elevation and chloride reduction in the blood.(8) Renal chloride excretion improved greatly in acutely hypercapnic sheep,(9) indicating the high relevance
Table 1 - General characteristics of the patients in both groups
Hypercapnic group (N = 26)
Control group
(N = 15) p-value
Characteristic
Age (year) 48 ± 18 44 ± 14 0.364
Gender M/F 15 (58)/11 (42) 5 (33)/10 (67) 0.239
Weight (kg) 56 [50;68] 55 [46;64] 0.600
Height (cm) 164 [158;170] 162 [154;168] 0.655
APACHE II score * 22 [20;24] 18 [16;19] 0.571
SAPS 3 score** 51 [33;53] 33 [26;43] 0.825
SOFA 1st day 5 [3;7] 5 [3;9] 0.999
Comorbidities 0.455
Hypertension 5 (19) 4 (27)
Diabetes 0 (0) 1 (7)
COPD 0 (0) 0 (0)
Chronic renal failure 0 (0) 0 (0)
Neoplasm 0 (0) 1 (7)
Respiratory failure etiology
Pneumonia 22 (84) 13 (87) 1.000
Asthma 2 (8) 0 (0) 0.524
Septic syndromes 2 (8) 2 (13) 0.615
ICU support
Vasopressors 13 (50) 2 (13) 0.044
Inotropics 11 (42) 6 (40) 0.854
Outcomes
ICU LOS (days) 11 [6;17] 8 [7;10] 0.118
Mortality 7 (27) 2 (13) 0.445
M/F - male/female; APACHE - acute physiology and chronic health disease classification system; SAPS - simplified acute physiological score; SOFA - sequential organ failure assessment; COPD - chronic obstructive pulmonary disease; ICU - intensive care unit; LOS - length of stay. * APACHE II score was retrieved from eleven patients; ** SAPS 3 was retrieved from thirty patients. The results expressed in mean and standard deviation values.
components of the metabolic adaptation according the patients’ disease severity, using an expected mortality of 20% (median of the expected mortalities) as the cut point.
DISCUSSION
Figure 2 - Acid-base variables before and after hypercapnia initiation. A) PaCO2 evolution (mixed model fixed effects p = 0.039 for within-group factor analysis, p = 0.009 for between-group factor analysis, and p = 0.119 for group × time interaction analysis). B) Standard base excess evolution (mixed model fixed effects p = 0.077 for within-group factor analysis, p = 0.018 for between-group factor analysis, and p = 0.185 for group × time interaction analysis). C) Bicarbonate evolution (mixed model fixed effects p < 0.001 for within-group factor analysis, p = 0.001 for between-group factor analysis, and p = 0.167 for group × time interaction analysis). D) pH evolution (mixed model fixed effects p = 0.105 for within-group factor analysis, p = 0.008 for between-group factor analysis, and p = 0.219 for group × time interaction analysis).
PaCO2 - partial pressure of carbon dioxide; SBE - standard base excess; HCO3 - bicarbonate. * Mann-Whitney’s post-hoc analysis p < 0.05 versus control group. # Wilcoxon’s post-hoc analysis p < 0.05 versus admission day.
of chloride modulation in metabolic adaptation triggered by acute hypercapnia in non-critically ill patients. In contrast, in acute critically ill animal models, the acid-base disturbances are marked, especially metabolic acidosis.(25,26) In critically ill patients, metabolic acidosis is relevant, multifactorial, and related to clinical outcomes.(27,28) hese patients present reduced sodium and chloride renal excretion,(10,11,29) together with chloride shift from the extravascular to the intravascular compartments added to exogenous load during luid resuscitation,(30) frequently resulting in hyperchloremia.(27,31) herefore, we speculate that these factors most likely diferentiate the responses
of critically ill patients from stable patients when they are exposed to hypercapnia in terms of chloride and SIDai modulations.
he decrease in lactate after the initiation of hypercapnia was another interesting inding in our study. he lactate behavior in hypercapnic patients is consistent with the study of Carvalho et al.(6) In an experimental model of endotoxemia, lactate production decreased with
ongoing hypercapnia between 40mmHg and 60mmHg.(32)
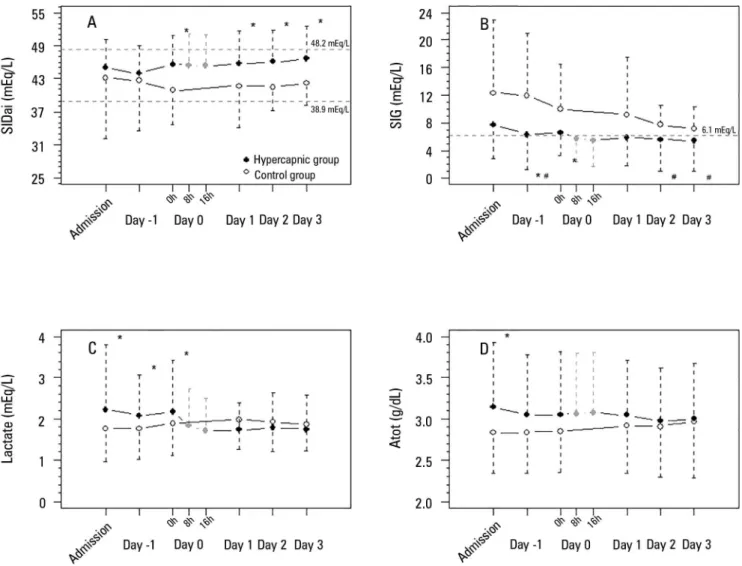
Figure 3 - Physicochemical variables of the acid-base metabolic component before and after hypercapnia initiation. A) SIDai evolution (mixed model fixed effects p = 0.646 for within-group factor analysis, p = 0.045 for between-group factor analysis, and p = 0.224 for group × time interaction analysis). B) Strong ion gap evolution (mixed model fixed effects p < 0.001 for within-group factor analysis, p < 0.001 for between-group factor analysis, and p = 0.007 for group × time interaction analysis). C) Lactate evolution (mixed model fixed effects p < 0.978 for within-group factor analysis, p < 0.001 for between-group factor analysis, and p = 0.975 for group × time interaction analysis). D) Atot evolution (mixed model fixed effects p = 0.141 for within-group factor analysis, p = 0.010 for between-group factor analysis, and p = 0.266 for group × time interaction analysis). SIDai - inorganic apparent strong ion difference; SIG - strong ion gap; Atot - weak acids in plasma. * Mann-Whitney’s post-hoc analysis p < 0.05 versus control group. # Wilcoxon’s post-hoc analysis p < 0.05 versus admission day.
interaction, which involves aerobic mitochondrial metabolism.(32)
In our patients, the presence of SIG acidosis at ICU admission can be observed in igure 3 - Panel B. his metabolic acidosis is common in critically ill infected patients, and its improvement during the irst ive days of ICU stay is associated with better clinical outcomes.(28) his extra source of metabolic acidosis can be a confounder of the pH evolution interpretation.
Unmeasured anion concentrations also decreased after the initiation of hypercapnia. hese unmeasured anions
Clearly, the PaCO2 decreased and was associated with the pH normalization during this study in a very important way. his observation probably represents the patient’s ventilatory improvement over time. However, metabolic adaptation also occurred, in a similar manner to the control group, but faster.
Our study has many limitations: the data were retrieved from a prospective collected database; diferent sources of ARDS and sepsis could inluence the metabolic adaptation to hypercapnia in diferent ways; other sources of metabolic acidosis are additional confounders, mainly in two diferent groups with diferent disease severities; individual variations were not considered in our study; and this study was drawn only as an explanatory analysis, as there is a paucity of data in this ield in the current literature.
CONCLUSION
In this explanatory study, the results indicate that metabolic acid-base adaptation, which is triggered by acute
persistent hypercapnia in patients with acute respiratory distress syndrome, is a complex process. he more rapid standard base excess adaptation than the control group involves decreases in lactate and the strong ion gap and increases in the inorganic apparent strong ion diference, which occur due to slight increases in serum sodium, magnesium, calcium, and potassium but not signiicant decreases in serum chloride.
Authors contributions
TG Romano analyzed the data and wrote the manuscript. MD Telles collected the data. PV Mendes participated in the data analysis. FG Zampieri designed the study and data analysis. AT Maciel participated in the design of the study and statistical analysis. M Park collected the data, designed the study, analyzed the data and wrote the manuscript. All of the authors approved the inal manuscript.
Objetivo: A hipercapnia resultante da ventilação protetora na síndrome do desconforto respiratório agudo desencadeia uma compensação metabólica do pH que ainda não foi completamente caracterizada. Nosso objetivo foi descrever esta compensação metabólica.
Métodos: Os dados foram recuperados a partir de uma
base de dados registrada de forma prospectiva. Foram obtidas as variáveis dos pacientes no momento da admissão e quando da instalação da hipercapnia até o terceiro dia após sua instalação. Analisamos 41 pacientes com síndrome do desconforto respiratório agudo, incluindo 26 com hipercapnia persistente (pressão parcial de gás carbônico acima de 50mmHg por mais de 24 horas) e 15 sem hipercapnia (Grupo Controle). Para a realização da análise, utilizamos uma abordagem físico-química quantitativa do metabolismo acidobásico.
Resultados: As médias de idade dos Grupos com
Hipercapnia e Controle foram, respectivamente, de 48 ± 18 anos e 44 ± 14 anos. Após a indução da hipercapnia, o pH diminuiu acentuadamente e melhorou gradualmente nas 72
horas seguintes, de forma coerente com os aumentos observados no excesso de base padrão. A adaptação metabólica acidobásica ocorreu em razão de diminuições do lactato sérico e do strong
ion gap e de aumentos na diferença aparente de strong ions
inorgânicos. Além do mais, a elevação da diferença aparente de
strong ions inorgânicos ocorreu por conta de ligeiros aumentos
séricos de sódio, magnésio, potássio e cálcio. O cloreto sérico não diminuiu por até 72 horas após o início da hipercapnia.
Conclusão: A adaptação metabólica acidobásica, que é
desencadeada pela hipercapnia aguda persistente em pacientes com síndrome do desconforto respiratório agudo, foi complexa. Mais ainda, aumentos mais rápidos no excesso de base padrão em pacientes com hipercapnia envolveram diminuições séricas de lactato e íons não medidos, e aumentos na diferença aparente
de strong ions inorgânicos, por meio de ligeiros aumentos séricos
de sódio, magnésio, cálcio e potássio. Não ocorreu redução do cloreto sérico.
RESUMO
REFERENCES
1. Rubenfeld GD, Caldwell E, Peabody E, Weaver J, Martin DP, Neff M, et al. Incidence and outcomes of acute lung injury. N Engl J Med. 2005;353(16):1685-93.
2. Azevedo LC, Park M, Salluh JI, Rea-Neto A, Souza-Dantas VC, Varaschin P, Oliveira MC, Tierno PF, dal-Pizzol F, Silva UV, Knibel M, Nassar AP Jr, Alves RA, Ferreira JC, Teixeira C, Rezende V, Martinez A, Luciano PM, Schettino G, Soares M; ERICC (Epidemiology of Respiratory Insufficiency in Critical Care) investigators. Clinical outcomes of patients requiring ventilatory support in Brazilian intensive care units: a multicenter, prospective, cohort study. Crit Care. 2013;17(2):R63.
3. Webb HH, Tierney DF. Experimental pulmonary edema due to intermittent positive pressure ventilation with high inflation pressures. Protection by positive end-expiratory pressure. Am Rev Respir Dis. 1974;110(5):556-65. 4. Ventilation with lower tidal volumes as compared with traditional tidal
volumes for acute lung injury and the acute respiratory distress syndrome. The Acute Respiratory Distress Syndrome Network. N Engl J Med. 2000;342(18):1301-8.
5. Gattinoni L, Pesenti A, Bombino M, Baglioni S, Rivolta M, Rossi F, et al. Relationships between lung computed tomographic density, gas exchange, and PEEP in acute respiratory failure. Anesthesiology. 1988;69(6):824-32. 6. Carvalho CR, Barbas CS, Medeiros DM, Magaldi RB, Lorenzi Filho
G, Kairalla RA, et al. Temporal hemodynamic effects of permissive hypercapnia associated with ideal PEEP in ARDS. Am J Respir Crit Care Med. 1997;156(5):1458-66.
7. Kregenow DA, Rubenfeld GD, Hudson LD, Swenson ER. Hypercapnic acidosis and mortality in acute lung injury. Crit Care Med. 2006;34(1):1-7. 8. Alfaro V, Torras R, Ibáñez J, Palacios L. A physical-chemical analysis of
the acid-base response to chronic obstructive pulmonary disease. Can J Physiol Pharmacol. 1996;74(11):1229-35.
9. Ramadoss J, Stewart RH, Cudd TA. Acute renal response to rapid onset respiratory acidosis. Can J Physiol Pharmacol. 2011;89(3):227-31. 10. Maciel AT, Park M, Macedo E. Urinary electrolyte monitoring in critically
ill patients: a preliminary observational study. Rev Bras Ter Intensiva. 2012;24(3):236-45.
11. Maciel AT, Park M, Macedo E. Physicochemical analysis of blood and urine in the course of acute kidney injury in critically ill patients: a prospective, observational study. BMC Anesthesiol. 2013;13(1):31.
12. ARDS Definition Task Force, Ranieri VM, Rubenfeld GD, Thompson BT, Ferguson ND, Caldwell E, Fan E, et al. Acute respiratory distress syndrome: the Berlin Definition. JAMA. 2012;307(23):2526-33.
13. Knaus WA, Draper EA, Wagner DP, Zimmerman JE. APACHE II: a severity of disease classification system. Crit Care Med. 1985;13(10):818-29. 14. Ledoux D, Canivet JL, Preiser JC, Lefrancq J, Damas P. SAPS 3 admission
score: an external validation in a general intensive care population. Intensive Care Med. 2008;34(10):1873-7.
15. Vincent JL, Moreno R, Takala J, Willatts S, De Mendonca A, Bruining H, et al. The SOFA (Sepsis-related Organ Failure Assessment) score to describe organ dysfunction/failure. On behalf of the Working Group on Sepsis-Related Problems of the European Society of Intensive Care Medicine. Intensive Care Med. 1996;22(7):707-10.
16. Stewart PA. Modern quantitative acid-base chemistry. Can J Physiol Pharmacol. 1983;61(12):1444-61.
17. Kellum JA, Kramer DJ, Pinsky MR. Strong ion gap: a methodology for exploring unexplained anions. J Crit Care. 1995;10(2):51-5.
18. Park M, Taniguchi LU, Noritomi DT, Liborio AB, Maciel AT, Cruz-Neto LM. Clinical utility of standard base excess in the diagnosis and interpretation of metabolic acidosis in critically ill patients. Braz J Med Biol Res. 2008;41(3):241-9. Erratum in Braz J Med Biol Res. 2011;44(3):267. Braga, A L [corrected to Libório, A B].
19. R Development Core Team. R: a language and environment for statistical computing. Vienna, Austria: R Foundation for Statistical Computing; 2009. 20. Tobin MJ. Culmination of an era in research on the acute respiratory
distress syndrome. N Engl J Med. 2000;342(18):1360-1.
21. Sinclair SE, Kregenow DA, Lamm WJ, Starr IR, Chi EY, Hlastala MP. Hypercapnic acidosis is protective in an in vivo model of ventilator-induced lung injury. Am J Respir Crit Care Med. 2002;166(3):403-8.
22. Pedoto A, Caruso JE, Nandi J, Oler A, Hoffmann SP, Tassiopoulos AK, et al. Acidosis stimulates nitric oxide production and lung damage in rats. Am J Respir Crit Care Med. 1999;159(2):397-402.
23. Lang JD Jr, Chumley P, Eiserich JP, Estevez A, Bamberg T, Adhami A, et al. Hypercapnia induces injury to alveolar epithelial cells via a nitric oxide- dependent pathway. Am J Physiol Lung Cell Mol Physiol. 2000;279(5):L994- 1002.
24. Sirker AA, Rhodes A, Grounds RM, Bennett ED. Acid-base physiology: the ‘traditional’ and the ‘modern’ approaches. Anaesthesia. 2002;57(4):348-56. Review.
25. Rosário AL, Park M, Brunialti MK, Mendes M, Rapozo M, Fernandes D, et al. SvO(2)-guided resuscitation for experimental septic shock: effects of fluid infusion and dobutamine on hemodynamics, inflammatory response, and cardiovascular oxidative stress. Shock. 2011;36(6):604-12. 26. Park M, Maciel AT, Noritomi DT, Brunialti MK, Salomão R, Schettino GP, et
al. Is persistent hypotension after transient cardiogenic shock associated with an inflammatory response? Braz J Med Biol Res. 2008;41(8):648-56. 27. Maciel AT, Park M. Differences in acid-base behavior between intensive
care unit survivors and nonsurvivors using both a physicochemical and a standard base excess approach: a prospective, observational study. J Crit Care. 2009;24(4):477-83.
28. Noritomi DT, Soriano FG, Kellum JA, Cappi SB, Biselli PJ, Libório AB, et al. Metabolic acidosis in patients with severe sepsis and septic shock: a longitudinal quantitative study. Crit Care Med. 2009;37(10):2733-9. 29. Maciel AT, Park M. Urine assessment in the critically ill: a matter of both
quantity and quality. Rev Bras Ter Intensiva. 2013;25(3):184-5.
30. Kellum JA, Bellomo R, Kramer DJ, Pinsky MR. Etiology of metabolic acidosis during saline resuscitation in endotoxemia. Shock. 1998;9(5):364-8. 31. Noritomi DT, Sanga RR, Amaral AC, Park M. Metabolic acid-base status in
critically ill patients: is standard base excess correlated with serum lactate level? Rev Bras Ter Intensiva. 2006;18(1):22-6.
32. Gnaegi A, Feihl F, Boulat O, Waeber B, Liaudet L. Moderate hypercapnia exerts beneficial effects on splanchnic energy metabolism during endotoxemia. Intensive Care Med. 2009;35(7):1297-304.
33. Abu Romeh S, Tannen RL. Amelioration of hypoxia-induced lactic acidosis by superimposed hypercapnea or hydrochloric acid infusion. Am J Physiol. 1986;250(4 Pt 2):F702-9.
34. Moviat M, Terpstra AM, Ruitenbeek W, Kluijtmans LA, Pickkers P, van der Hoeven JG. Contribution of various metabolites to the “unmeasured” anions in critically ill patients with metabolic acidosis. Crit Care Med. 2008;36(3):752-8.
![Table 1 - General characteristics of the patients in both groups Hypercapnic group (N = 26) Control group (N = 15) p-value Characteristic Age (year) 48 ± 18 44 ± 14 0.364 Gender M/F 15 (58)/11 (42) 5 (33)/10 (67) 0.239 Weight (kg) 56 [50;68] 55 [46;64]](https://thumb-eu.123doks.com/thumbv2/123dok_br/19077297.492386/4.892.67.426.128.668/general-characteristics-patients-hypercapnic-control-characteristic-gender-weight.webp)