C. K. Mukhopadhyay
[email protected] Indira Gandhi Centre for Atomic Research 603102 Kalpakkam, Tamil Nadu, IndiaT. Jayakumar
[email protected] Indira Gandhi Centre for Atomic Research 603102 Kalpakkam, Tamil Nadu, IndiaBaldev Raj
[email protected] Indira Gandhi Centre for Atomic Research 603102 Kalpakkam, Tamil Nadu, IndiaS. Venugopal
[email protected] Indira Gandhi Centre for Atomic Research 603102 Kalpakkam, Tamil Nadu, IndiaStatistical Analysis of Acoustic
Emission Signals Generated During
Turning of a Metal Matrix Composite
Acoustic emission technique (AET) has been used to monitor the progress of tool wear during turning of silicon carbide (20 wt.%) dispersed Al alloy metal matrix composite. Acoustic emission (AE) signals generated beyond a specific cutting distance increase abruptly. Statistical analysis based on assumed β distribution of AE energy showed that skewness and kurtosis vary with cutting time. Comparison of these results with b-parameter of amplitude distribution of AE hits presented in an earlier investigation has shown that while b-parameter is useful for monitoring tool wear up to 0.4 mm, skewness and kurtosis can better monitor the wear beyond that. Uncertainty measurement of AE energy for different cutting distances was determined as per ISO GUM. The combined uncertainty for the measurement of AE energy lies in the range of 0.38 to 1.69, with higher values for the cutting distance between 213.8 mm and 454.5 mm. Different parameters such as skewness and kurtosis of the statistical distribution, b-parameter of amplitude distribution and uncertainties can be used in a complimentary manner for comprehensive evaluation of tool wear.Keywords: acoustic emission, statistical analysis, turning, tool wear, metal matrix composite
Introduction1
Metal matrix composites (MMCs) are extensively used in automotive and aerospace industries due to their low density, high elastic modulus, wear resistance, thermal conductivity and thermal stability. These composites belong to a class of materials difficult to machine and pose challenge for improving cutting tool materials. The industrial demand in this direction can be met by optimization of tool materials, geometry and machining conditions for improved tool performance, consistent tool reliability during cutting operation etc. to obtain the machined components with consistent quality.
Cutting tools used in manufacturing processes are prone to failure either by gradual wear or by fracturing. Monitoring and/or detection of wear and sudden tool failure are important for improving reliability and promoting automation of manufacturing processes. Tool wear refers to the loss of material at the cutting lips of the tool because of physical interaction between the tool and the workpiece material. Wear is a progressive process, but it occurs at an accelerated rate once blunting of the tool takes place. Beyond certain amount of wear, further occurrence of the wear can cause sudden failure of the tool without any warning, resulting in considerable damage to the workpiece and even to the machine tool. The gradual wear of the cutting tool occurs in two ways: flank wear and crater wear. Flank wear occurs primarily as a result of the rubbing action between the flank face of the tool and the newly formed workpiece, while crater wear is associated with the contact between the chip and the rake face of the tool.
Acoustic emission technique (AET) has been used for monitoring different forming and machining processes (Dornfeld and Kannatey-Asibu, 1980; Nakao Yohichi and Dornfeld, 2003; Axinte Dragos et al., 2005; Jayakumar et al., 2005). During machining, acoustic emission is generated from (i) primary deformation zone ahead of the cutting tool where the initial shearing occurs during chip formation, (ii) secondary deformation zone along the chip-tool-rake face interface where sliding and bulk deformation occur, and (iii) tertiary deformation zone along the tool flank-workpiece interface (Dornfeld and Kannatey-Asibu, 1980). The formation of chips or the fracture of chips during formation of
Paper received 6 April 2011. Paper accepted 3 January 2012 Technical Editor: Marcelo Trindade
discontinuous chips also leads to the generation of AE signals (Dornfeld and Kannatey-Asibu, 1980).
Acoustic emission (AE) studies during machining processes have shown that the generation of AE during machining depends on the cutting speed (influencing strain rate), depth of cut and feed rate (both influencing volume of material undergoing deformation) and the material being machined (Kannatey-Asibu and Dornfeld 1981; Lan and Dornfeld, 1986). In order to improve machining accuracy, on-line AE monitoring during diamond turning has been carried out and it has been shown that use of AET helps to achieve 20% reduction in machining errors as compared to that in conventional position feedback control systems (Nakao and Dornfeld, 2003). Use of an array of acoustic emission sensors for finding the location of uneven events such as pluckings, laps, and smeared material occurring during machining of AISI type 1020 steel has been presented (Axinte et al., 2005). Acoustic emission during machining and chip formation in Ti-6Al-4V alloy has been investigated (Barry et al., 2001). AET has been applied for monitoring tool and/or workpiece surface anomalies during milling of Inconel 718 (Iulian and Axinte Dragos, 2008). A bicepstrum based blind system identification technique has been proposed for estimating transmission path and sensor impulse response of AE signals generated during machining and the proposal has been verified during turning of a single crystal (111) orientation Cu (Iturrospe et al., 2005). The unique requirements of monitoring of precision manufacturing processes, and the suitability of acoustic emission as a monitoring technique at the precision scale have been described (Lee et al., 2006), where use of AE sensor in the monitoring of precision manufacturing processes including grinding, chemical-mechanical planarization and ultraprecision diamond turning has been elaborated.
sensor(s) is an effective approach for AE-based intelligent tool condition monitoring (Dimla, 2000; Xiaoli, 2002). Possibility of on-line identification of tool wear using the AE signal based feedback control system has also been shown (Nakao and Dornfeld, 2003).
Acoustic emission generated due to progressive tool flank wear during turning was studied and it was reported that AE energy and event counts per cut increase significantly by increasing the magnitude of wear (Iwata and Moriwaki, 1978). The feasibility of using AET for the detection of breakage and chipping of cutting tool during turning was investigated (Lan and Dornfeld, 1984). It was reported that the AE signals are sensitive to tool fracture and can be used for on-line monitoring of the impending failure of a cutting tool. The fracture of single point insert tooling and the influence of the fracture area of the insert on the AE signals generated were investigated (Lan and Dornfeld, 1984; Kakino et al., 1983). These works, together with the studies on the wear and fracture of inserts during machining with multi-insert milling cutters (Diei and Dornfeld, 1987) led to the development of a model for tool fracture generated AE that is dependent upon the surface area of the fracture, the stress on the tool at fracture and properties of tool material. In another investigation (Jemielniak Krzysztof, 2000), AET for tool condition monitoring during turning of steel 45 with TiN+TiC coated sintered carbide has shown that the values of different AE parameters are fairly low until the tool coating is worn out, but beyond that, the values of the parameters increase significantly due to increase in tool wear. On-line AE monitoring of different machining operations has been reported, which includes high speed grinding of silicon carbide (Hwang et al., 2000), high speed machining of GGG40-quality steel (Haber Rodolfo et al., 2004), friction stir welding of 6061 Al alloy (Zeng et al., 2006), and turning of SiC dispersed metal matrix composite (Mukhopadhyay et al. 2006). It is known from these studies that amplitude of the AE signals increases with increase in the degree of tool wear. AET has been applied to study drilling in SAE 1040 steel with different degrees of wear in the drill bit, and a relationship between AE, torque measured during the drilling process, and degree of tool wear has been proposed (Martin et al., 2010).
Since the AE signals generated from any process are generally stochastic in nature, statistical methods are often applied for their analysis. In an earlier investigation (Gabriel et al., 1995), AE signals generated during tool wear tests of SAE 1045 steel were statistically analyzed using distribution moments. It was shown that the distribution parameters like skewness and kurtosis of an assumed β distribution based on root mean square (RMS) voltage of the AE signal are sensitive to both stick-slip transition from chip contact along the tool rake face and progressive wear on the flank face of the tool (Gabriel et al., 1995). In another investigation on machining of steel bars (Jemielniak and Otman, 1998), the skewness and kurtosis of an assumed β distribution based on the AE RMS voltage were reported to give better indication of catastrophic tool failure than the RMS voltage itself.
The above investigations on statistical analysis of AE signals generated due to either tool wear or tool failure (Gabriel et al., 1995; Jemielniak and Otman, 1998) were done on metallic materials. In a recent investigation (Mukhopadhyay et al., 2006) on use of AET during turning of a SiC dispersed metal matrix composite, it has been shown that AE during machining beyond a specific cutting distance and time increases abruptly due to progressive tool wear. The slope (b-parameter) of the cumulative amplitude distribution plot of the AE signals bears a two stage relation with maximum flank wear; initial rapid decrease up to the flank wear value of 0.45 mm and then b-parameter attains an almost constant value. The b-parameter is thus very sensitive for monitoring the progress in flank wear for lower cutting distances and shows limited sensitivity for higher cutting distances
(Mukhopadhyay et al., 2006). It can be noted that in SiC dispersed metal matrix composites, SiC particles and Al alloy possess totally different characteristics with respect to structure and mechanical behavior. SiC particles have high yield strength and very high elastic modulus, whereas Al alloy has low yield strength and good plasticity. Under the applied force, the stress on the matrix is not equal to that on the reinforcing particles. Thus, during cutting of the composite, when matrix material deforms plastically, SiC particles may only deform elastically; and also the boundary of the matrix and the particles may break between the tool and the particles causing wear on the tool flank. Thus the situation in the case of machining of SiC dispersed metal matrix composite is complex in comparison to that in metallic materials. In such situation, statistical analysis of the AE signals which were earlier applied on metallic materials (Gabriel et al., 1995; Jemielniak and Otman, 1998) is expected to show better sensitivity to the progress of tool wear as compared to the amplitude distribution analysis, particularly for longer cutting distances. In the present paper, the details of this attempt made by carrying out statistical analysis of the AE signals recorded earlier (Mukhopadhyay et al., 2006) are presented. The statistical analysis has been done using an assumed β distribution of AE energy to examine the suitability of applying various distribution moments to monitor the tool wear.
It is also known that with every measurement, an error is associated and the metrological concept that concerns with this subject is uncertainty (ISO-GUM, 1995). Different uncertainty parameters are defined in the ISO-GUM. Type A uncertainty is a part of the total uncertainty which is evaluated by standard deviation of the mean or by any other statistical parameter giving dispersion of the results. On the other hand, there are other parts of the uncertainty that cannot be evaluated just from statistical analysis, but can be evaluated from other considerations such as equipment setup, specifications of manufacturer, data from certificates or handbooks, etc. This kind of uncertainty according to ISO-GUM is defined as Type B. Both types of uncertainty are expressed as standard deviations (ISO-GUM, 1995; Cook 1999). The uncertainties associated with AE energy measurements in this investigation are also determined and presented in this paper.
Nomenclature
s = second
m = parameter of the β distribution n = parameter of the β distribution x = AE energy
S = skewness K = kurtosis
x
= mean energy s(x) = standard deviation n = sample size D = cutting distance uc(m) = uncertainty of the meanUc(E) = type A uncertainty of AE energy
Uc(R) = type B uncertainty of resolution of AE energy
Uc(C)= combined uncertainty
k = coverage factor Greek Symbols
β = beta distribution σ2
= variance
Experimental
used in the present study. The average size of the silicon carbide particulates is about 20 µm. The chemical composition of the base alloy is given in Table 1.
Table 1. Chemical composition (wt.%) of 6025 Al alloy.
Si Fe Cu Mn Mg Zn Ti Al
6.25-7.5 0.2 0.2 0.1 0.2-0.4 0.1 0.2 Bal.
Geedi Weiler Lathe tool was used for machining. The tool insert used in this study is from K20 series. The tool insert is coded as SPUN 120308. It has a thick layer of Al2O3on the top of a Ti(C,N)
layer. The total thickness of the coating is approximately 10 µm. The combination of a thick wear resistance layer and a tough cobalt enriched substrate give the tool insert an excellent combination of high wear resistance and good edge security. The tool holder is specified as R 174.2-2020-12. The tool and the tool holder were supplied by M/s. Sandwik Coramant.
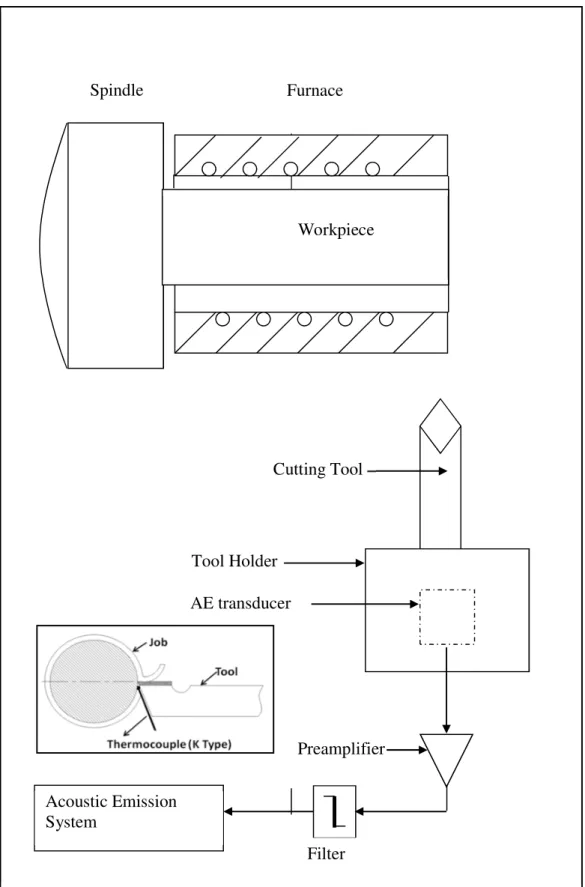
Details of experimental arrangement for recording of AE signals during tool wear tests can be found in the earlier paper (Mukhopadhyay et al., 2006). Tests were performed on Geedi Weiler Lathe at elevated temperature. Machining at elevated temperature was done to enhance the machining performance for these materials. In the MMCs, the presence of reinforcement particles leads to rapid wear of cutting tools during machining. Low cutting speeds are adopted since high wear rate results in a high machining cost. Thus, there is a need to enhance the machining performance for these materials. The enhancement of machining performance should lead to an increased material removal rate, prolonged tool life and improved surface finish. Machining at elevated temperatures is a viable approach to achieve these goals. In the present investigation, the workpiece was heated at 350oC (623 K). The workpiece is mounted on the lathe. The workpiece was heated in-situ using a removable shell type furnace with a heating capacity of 3 kW. The furnace has a slot for feeding the tool without removing the furnace so that the workpiece is heated in-situ for maintaining the test temperature at the desired set value. The temperature of cutting was measured by using a K-type sheathed thermocouple. The temperature data logger used had a measuring range from 0 to 900°C with an accuracy of ±0.5°C and a response time of <1/3 s. The diameter of thermocouple wire used is 0.2032 mm (32 SWG). A stainless steel sheathed K-type probe was connected to the data logger and was used to measure the temperature. As the workpiece cools down with time, the turning tests were done within a minimum time to prevent the heat loss due to convection and radiation. During turning, the workpiece is rotated on a spindle and the tool is fed into it to give the required surface finish. The three parameters in any turning operation are machining speed, feed rate, and depth of cut. The machining speed refers to the relative surface speed between tool and workpiece and is the speed at which the workpiece material moves past the cutting tool. The feed rate is the axial advance of the tool along the work for each revolution of the work. The depth of cut relates to the depth to which the tool cutting edge engages the work. In this work, the machining speed, feed rate and depth of cut were maintained at 70 m/min, 0.002 mm/rev and 0.25 mm respectively.
The turning operation was carried out for different cutting length or cutting distances viz. 5 mm, 10 mm, 20 mm, 40 mm, 80 mm, 160 mm and 400 mm using the same cutting tool. AE signals generated during the turning operations were recorded and analyzed using a Spartan 2000 acoustic emission system (M/s. Physical Acoustic Corporation, USA). A piezoelectric transducer (15 mm dia.) having a resonant frequency at 150 kHz, a preamplifier with 40 dB gain and a compatible filter (100-300 kHz) were used to capture the
AE signals. The amplified and filtered signal is passed to the A/D converter where the AE signal is digitized at rates up to 10 MHz. The digitized signal is passed to the feature extraction circuitry. The high speed feature extracted data is further processed by the signal processor. The sensor was mounted at the end of the tool holder with the help of silicone grease as couplant. By mounting the sensor at the tool holder, the distance between the cutting zone and the transducer element becomes small and the signal to noise ratio is improved. A total gain of 85 dB and a threshold of 55 dB were maintained throughout the experiment. Figure 1 shows the schematic setup for the turning operation alongwith that for recording the AE signals.
In order to fix the gain and threshold values, a number of trial machining tests were carried out. Initially, AE signals generated during free running of the machine were monitored. The proper acoustic contact between the transducer and the workpiece material was verified by conducting pencil lead break studies. Then AE signals were monitored during rotation of the lathe at the maximum speed (i.e. 600 rpm) for some time with the workpiece fixed on the machine, but without any cutting of the material. The maximum noise level generated by the machine during this rotation was noted and the gain and threshold values were selected appropriately so that no external noise was recorded during the actual experiments. Various parameters of the AE signal like AE energy and peak amplitude distribution of AE hits (events) were recorded during the experiments and used for analyzing the results.
The reliability and reproducibility of the captured AE data was established by conducting trial machining at 600 rpm speed at room temperature (298 K). The total energy of the AE signal generated during machining for a fixed time (15 s) for three consecutive trial runs were recorded. The coefficient of variation (ratio of standard deviation to average) associated with the total energy values for such trial runs was found to be consistently lower than 20%. The value of standard deviation for the trial runs was found to be 482 for an average total energy value of 4411. Since the coefficient of variation is a statistical measure of the deviation of a variable from its mean, so the higher the value of coefficient of variation, the higher is the variability and the lower the value, the higher is the consistency of the data. The low value of coefficient of variation associated with the total AE energy for machining indicates the reproducibility of AE experiments and the reliability of the test set up. Once this is established, all machining tests are carried out subsequently using the same set up. Thus AE data captured by the transducer during the tests can be considered reproducible and reliable. It should also be noted that, in the present investigation, AE data generated for any given experimental condition represents unique value.
Results and Discussion
Figure 1. Schematic of the experimental set up for turning and AE monitoring. The position of the thermocouple is shown in the inset.
P
Z
Workpiece
Spindle
Furnace
Workpiece
Spindle
Furnace
AE transducer
Cutting Tool
Tool Holder
Acoustic Emission
System
Preamplifier
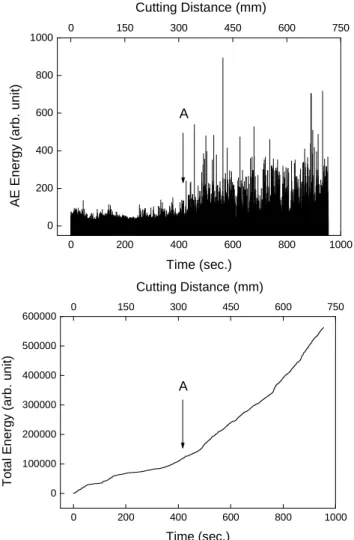
Figure 2. Variation of (a) AE energy and (b) total energy with time and cutting distance.
It should be mentioned here that the AE energy used in Fig. 2 is a parameter of burst type AE signals. The acoustic emission energy is proportional to the integral of the square of the transducer output voltage (Wadley et al., 1980). It was shown (Beattie, 1976) that energy analysis has an advantage in detecting higher amplitude events for which AE count analysis may fail to register the proper relative magnitudes. On the other hand, b-parameter is derived from amplitude distribution analysis and useful towards characterizing AE generated from a material when multiple sources are operating (Pollock, 1973). A higher value of b-parameter indicates a signal having a large number of small amplitude events, whereas a lower b
value specifies a signal consisting of an increased number of high amplitude events.
Statistical Analysis of AE Signals
In the present investigation, acoustic emission signals generated during the tool wear tests carried out earlier (Mukhopadhyay et al., 2006) have been evaluated by applying distribution moments based on an assumed β distribution of the AE signals. AE energy data for different cutting distances was considered for this analysis. The β functions are special mathematical functions used for characterizing surface typology and are given by (Whitehouse, 1978):
1
1 1
0
(
)
m(1
)
nβ
m,n
=
∫
x
−−
x
−dx
(1)where m and n are parameters of the β distribution and the variable x represents AE energy.
The values of the statistical parameters such as mean and variance are calculated first and then the values of skewness (S) and kurtosis (K) are calculated based on the moments of assumed β distribution of the measured AE signal. The mean of the random variable is the first order moment and variance is the second order central moment of the distribution function. While the mean is used to describe the location of a distribution, the variance specifies its spread. The standard deviation (s(x)) is given by the following equations:
s(x) = (σ2)1/2 (2)
)
)
(
))(
1
/(
1
(
1 i
2 2
∑
=−
−
=
n
nx
ix
σ
(3)
where σ2 is the variance, xi is the instantaneous AE energy,
x
is the mean AE energy and n is the sample size.The skewness is the normalized third order central moment of the distribution function and kurtosis is the normalized fourth order central moment. The values of skewness and kurtosis of the β distribution are given by the following equations (Whitehouse, 1978):
1/ 2
((2( )) / ( 2)).(( 1) / )
S= n−m m+ +n m+ +n mn (4)
2
(6(( ) ( 1) ( 2))) /
( ( 2)( 3))
K m n m n mn m n
mn m n m n
= − + + − + +
+ + + + (5)
the parameters m and n in the above equations can be expressed in terms of mean (
x
) and variance (σ2) of the distribution:2 2 2
( /
)(
)
m
=
x
σ
x
−
x
−
σ
(6)2 2 2
((1 )/ ))( )
n= −x
σ
x−x −σ (7)The skewness of a distribution is a measure of symmetry around the mean, whereas the kurtosis indicates sharpness of peak of the distribution. A positive value of S generally indicates a shift of the bulk of the distribution to the right of the mean, and a negative S
indicates a shift to the left. A high K value is indicative of a sharp distribution peak (concentrated in a small area) while a low K value indicates essentially flat characteristics. Therefore, by knowing the values of mean and variance of a distribution, the parameters m and n can be obtained, and the values of S and K can be calculated. In the earlier investigations (Gabriel et al., 1995; Jemielniak and Otman, 1998), skewness and kurtosis values of the β distribution were estimated based on RMS voltage of the AE signal and used for detection of tool wear and tool failure. In the present investigation, skewness and kurtosis of the β distribution are calculated by using energy data of the AE signal. AE energy was found to have good correlation with progressive wear of the tool in the earlier investigation (Mukhopadhyay et al., 2006). The skewness and kurtosis values are calculated according to Eq. (4) and Eq. (5) and are related to the time of cutting and tool wear.
0 200 400 600 800 1000
0 200 400 600 800
1000 0 150 300 450 600 750
Cutting Distance (mm)
A
A
E
E
n
e
rg
y
(
a
rb
.
u
n
it
)
Time (sec.)
0 200 400 600 800 1000
0 100000 200000 300000 400000 500000
600000 0 150 300 450 600 750
Cutting Distance (mm)
A
T
o
ta
l
E
n
e
rg
y
(
a
rb
.
u
n
it
)
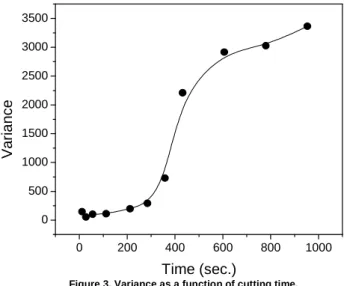
The values of AE energy obtained from AE data files were used as inputs for the calculation of the statistical parameters. While the AE data generated for the cutting distances 5 mm, 10 mm, 20 mm, 40 mm and 80 mm were used directly, the data files pertaining to the cutting distances of 160 mm and 400 mm were divided into smaller files of equal time intervals. The mean and variance of all data sets were then calculated and from these values, the parameters m and n were calculated. The values of m and n are then used to calculate the skewness and kurtosis using Eq. (4) and Eq. (5). The values of variance were plotted as a function of cutting time in Fig. 3. The values of coefficient of variation CV (ratio of the standard deviation to the mean) were also calculated and plotted as a function of cutting time in Fig. 4. The coefficient of variation (CV) is used to describe the dispersion of a variable in a way that does not depend on the unit of the variable. The higher the CV, the greater is the dispersion in the variable and vice versa. Figures 3-4 indicate that the values of both variance and coefficient of variation, after the first measurement, increase with time. Increase in variance and CV up to around 300 s is lower. Beyond this, there is drastic increase in these parameters with time up to around 500 s. The increase in these parameters with time is reduced beyond 500 s.
Figure 3. Variance as a function of cutting time.
The values of skewness and kurtosis are shown in Table 2. These values are also plotted as a function of time in Figs. 5a-5b. Figure 5a indicates that, skewness initially decreases with cutting time up to around 300 s. Beyond 300 s, reduction of skewness is drastic up to around 500 s and beyond that, the reduction is gradual. On the other hand, kurtosis marginally increases up to around 300 s, reduces drastically up to 500 s, but increases gradually beyond that (Fig. 5b). Thus, for the first 300 s cutting time, these two parameters vary differently to each other. Between 300 and 500 s, they vary similarly and beyond 500 s, they again vary differently with time. Thus these two parameters exhibit different variations with cutting time for a continuous cutting process and can be effectively used to monitor the cutting process.
Figure 4. Coefficient of variation as a function of cutting time.
Figure 5. Variation of (a) skewness and (b) kurtosis as a function of cutting time.
Table 2. Values of skewness (S) and kurtosis (K) for different cutting distances (D)
D (mm) 8.5 20.8 41.6 84.2 159 213.8 268.5 324 454.5 585 715
S -1.44 -0.71 -0.98 -1.052 -1.43 -1.78 -3.36 -7.35 -8.33 -9.04 -10.99
K 4.31 0.96 1.89 2.19 4.28 7.03 37.88 -221 -177 -164 -151
0 200 400 600 800 1000
0 500 1000 1500 2000 2500 3000 3500
V
a
ri
a
n
c
e
Time (sec.)
0 200 400 600 800 1000
-12 -10 -8 -6 -4 -2
0 (a)
S
k
e
w
n
e
s
s
Time (sec.)
0 200 400 600 800 1000
-250 -200 -150 -100 -50 0
50 (b)
K
u
rt
o
s
is
Time (sec.)
0 200 400 600 800 1000
0.1 0.2 0.3 0.4 0.5 0.6 0.7 0.8 0.9
C
o
e
ff
ic
ie
n
t
o
f
V
a
ri
a
ti
o
n
The amount of flank wear on the tool insert was measured at the end of each machining distance, using a tool maker’s microscope. The variation of flank wear with cutting time is shown in Fig. 6, which shows that flank wear increases gradually with increase in the cutting time up to around 300 s, and beyond that, it increases even more. The variation of flank wear with cutting time can be explained in the following manner. Initially the tool is sharp and there is no wear land on the flank. Upon start of machining, the wear land develops rapidly because of abrasion, adhesion, shear, etc. and wear rate is high. Upon continuation of machining, the frictional stresses and maximum temperature on flank go on increasing with time. The wear land then grows at a slower rate compared to the initial rapid wear. Beyond the cutting time of around 300 s flank wear increases again at an accelerating rate.
Figure 6. Variation of flank wear of the tool with cutting time.
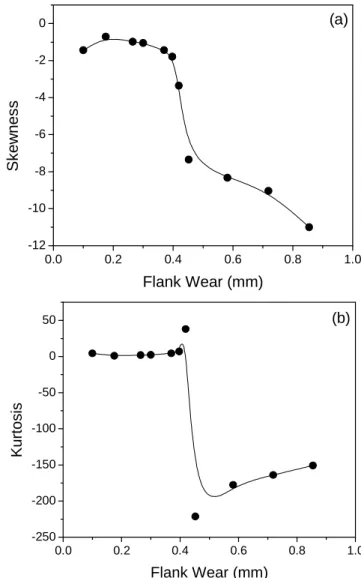
The values of skewness and kurtosis obtained for various cutting times were correlated with the values of flank wear estimated from Fig. 6. The variations in skewness and kurtosis with flank wear are shown in Figs. 7a-7b. Figure 7a indicates that skewness initially decreases with flank wear up to around 0.4 mm, beyond which the decrease is drastic up to around 0.5 mm wear and further beyond that, the decrease is gradual. Kurtosis plotted in Fig. 7b shows that this parameter initially increases marginally with flank wear up to around 0.4 mm, reduces drastically beyond that and increases gradually again beyond around 0.5 mm flank wear. The drastic reduction in the value of kurtosis between 0.4 mm and 0.5 mm flank wear can be understood from the fact that beyond the cutting time of around 400 s, mean and variance of AE energy increase drastically. Since mean and variance are used to calculate kurtosis, any change in the mean and variance is also reflected in the kurtosis value. In a statistical distribution, skewness describes whether the given distribution is positive skewed or negative skewed compared to the symmetrical bell-shaped normal distribution. On the other hand, kurtosis describes whether the given distribution has a central peak that is either flatter (platykurtic), or more pointed (leptokurtic) than the standard bell-shaped normal distribution (mesokurtic). The distribution is considered mesokurtic or normal for K = 3, flattened or platykurtic for K > 3 and less flattened than normal or leptokurtic for K < 3.
Figure 7. Variation of (a) skewness and (b) kurtosis as a function of flank wear.
It is known that in metal matrix composites, wear takes place by hard SiC particles present in the matrix resulting in scratching and removal of small portions of the cutting tool (Lin et al., 1995). Scratched grooves are found parallel to the directions of chip flow and workpiece material movement. Those grooves are formed by abrasion between the workpiece material and the tool due to irregular shape of particulate SiC reinforcement and loose particles found during machining (Lin et al., 1995; Xiaoping and Seah, 2001). The occurrence of multiple slopes in the variations of skewness and kurtosis with time can possibly be attributed to the occurrence of different wear mechanisms in the composite. Scanning electron microscopy (SEM) results were reported in an earlier paper (Mohan et al., 2008). This showed that the cutting tool experiences abrasive wear at the flank face, as well as chip breakage and scooping of the SiC particles.
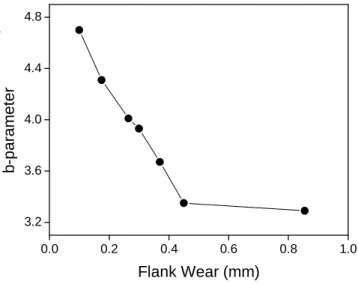
The statistical parameters obtained are compared with the b-parameter of the amplitude distribution analysis presented in the earlier paper (Mukhopadhyay et al., 2006). The variation of the b-parameter with flank wear (Mukhopadhyay et al., 2006) is reproduced here (Fig. 8). Comparison of Figs. 7a-7b with Fig. 8 shows that, up to around 0.4 mm flank wear, while the changes in skewness and kurtosis are marginal, b-parameter decreases sharply. The sharp decrease in the value of b-parameter with increasing wear
0 200 400 600 800 1000
0.0 0.2 0.4 0.6 0.8 1.0
F
la
n
k
W
e
a
r
(m
m
)
Time (sec.)
0.0 0.2 0.4 0.6 0.8 1.0
-250 -200 -150 -100 -50 0
50
(b)
K
u
rt
o
s
is
Flank Wear (mm)
0.0 0.2 0.4 0.6 0.8 1.0
-12 -10 -8 -6 -4 -2
0
(a)
S
k
e
w
n
e
s
s
in this region is due to the occurrence of higher and higher amplitude hits associated with progressively higher amount of tool wear. But beyond the wear value of 0.4 mm, while b-parameter becomes almost constant, skewness and kurtosis change significantly. Thus it can be stated that b-parameter of the amplitude distribution is useful for monitoring the progress in tool wear up to the wear value of 0.4 mm, but beyond that, skewness and kurtosis show superiority over the b-parameter for revealing the progressive changes in tool wear.
.
Figure 8. Variation of b-parameter with flank wear.
Uncertainty Measurement
Type A and type B uncertainties associated with AE energy measurement have been determined. Type A uncertainty is usually more important than Type B in acoustics testing (Costa-Felix, 2006). Uncertainties associated with calibration of AE sensors have been reported (Keprt Jiri and Benes Petr, 2009). The uncertainty in calibration measurement of AE sensors by reciprocity calibration method was reported to be ±3dB in the frequency range between 60 kHz and 285 kHz and up to ±8dB in the frequency range between 285 kHz and 1 MHz. The main source of uncertainty is the accuracy in the measurement of
amplitude of the signal analyzer (Keprt Jiri and Benes Petr, 2009). In the present investigation, main sources of error in the
measurement of AE signals and the associated uncertainty can arise from coupling of the AE transducer to the tool holder; calibration and sensitivity of the transducer and the AE system. The sensor was
mounted after proper cleaning of the tool holder and by fixing the sensor using couplant and an adhesive tape. All the experiments were conducted by keeping the sensor at the same location. Thus any variation in AE signal due to variation in mounting of the sensor was removed. The coupling and the sensitivity of the sensor before and after the turning experiments were checked by auto sensor test, a built-in feature of the Spartan 2000 AE system. The auto sensor test capability generates a pulse that is sent through the rear panel into the preamplifier of the selected channel of the AE system.
In the present investigation, AE energy values obtained for various cutting distances were used as inputs for calculation of the statistical parameters. The acoustic emission energy is generally assumed to be proportional to the integral of the square of the transducer output voltage (Wadley et al., 1980). The absolute measurement of the AE source energy depends on the sensitivity and frequency response of the transducer. Uncertainty for machining each cutting distance was therefore determined for the AE energy values. For each cutting distance, mean AE energy is associated with a standard deviation. If machining of the same length or cutting distance is repeated several times, a number of mean AE energy values would be obtained and these mean values would themselves show a small random variation. It is then possible to estimate the standard deviation of these mean values using the following equation (Veronika, 2007, IAEA-TECDOC-1585):
1/ 2
( )
1 / (( )
) ( )
c
u m
=
n
s x
(8)
where uc(m)is the uncertainty of the mean and provides a measure of the width of the distribution of mean values that would be expected and s(x) is the standard deviation. If enough readings are taken per mean value, then the distribution of mean values will be roughly Gaussian, in which case the standard uncertainty corresponds to a confidence probability of 68%.
Type A uncertainty for measurements of voltage and current towards the calculation of total uncertainty associated with the calibration of AE sensors was determined by Jiri and Petr (2009). They determined the type A uncertainty associated with the measurements of voltage and current in the manner similar to that described by Eq. (8). The standard uncertainty of the mean for each cutting distance in the present investigation was thus determined using Eq. (8) and are shown in Table 3. The uncertainty component derived in this way, by statistical analysis, is known as type A estimate of uncertainty, Uc(E) (
IAEA-TECDOC-1585). It is seen from Table 3 that the uncertainty
ranges from 0.38 to 1.69 with higher values of uncertainty for the cutting distance between 213.8 mm and 454.5 mm.
Table 3. Values of type A (Uc(E)), type B (Uc(R)) and combined uncertainties (Uc(C)) for different cutting distances (D).
D(mm) 8.5 20.8 41.6 84.2 159 213.8 268.5 324 454.5 585 715
Uc(E) 0.379 0.473 0.502 0.630 0.528 1.267 1.538 1.688 1.290 0.688 0.725
Uc(R) 0.012 0.009 0.014 0.01 0.011 0.01 0.011 0.010 0.012 0.012 0.012
Uc(C) 0.379 0.473 0.502 0.630 0.528 1.267 1.538 1.688 1.290 0.688 0.725
Uncertainty of type B can arise from signal analyzer of the AE system used for recording the data and such uncertainty is characterized by homogeneous rectangular distribution (Keprt Jiri and Benes Petr, 2009). The value of type B uncertainty does not change with repeated measurements and thus is not determined by statistical analysis. The rectangular distribution is preferred in situations when no detailed knowledge of the distribution function is available. In the case of present investigation, type B uncertainty was determined for AE energy. The resolution of recording AE
energy as obtained from Spartan 2000 AE system is one energy count. The type B uncertainty for resolution of AE energy (Uc(R)) is
found out from a/√3 where 2a is the width of the rectangular distribution (Veronika, 2007; IAEA-TECDOC-1585) and equals to one in the present study, and this works out to be in the range of 0.01 to 0.014 relative to the recorded instantaneous AE energy (Table 3). The rectangular distribution with standard uncertainty 1/√3 covers 58% of the data. The combined uncertainty (Ui(C)) for
0.0 0.2 0.4 0.6 0.8 1.0
3.2 3.6 4.0 4.4 4.8
b
-p
a
ra
m
e
te
r
each cutting distance was determined using the following equation (Veronika, 2007):
1/2 2
( )
( )
n
c i
i
U C
=
u
x
∑
(9)
where u(xi) is the standard uncertainty of factor xi. The combined
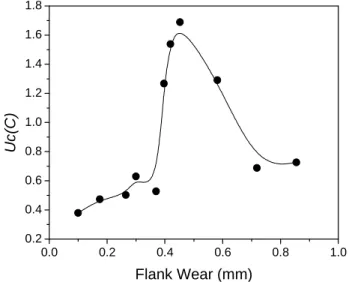
uncertainty works out to be in the range of 0.38 to 1.69 (Table 3). The combined uncertainties plotted as a function of flank wear (Fig. 9) shows that it increases gradually up to around 0.4 mm flank wear and beyond which it increases drastically up to around 0.5 mm flank wear and decreases beyond that. Thus, for the first time, it is shown that, b-parameter from the peak amplitude distribution of AE signal, skewness and kurtosis for statistical distribution and uncertainties associated with the measurement of AE signals can be used in a complimentary manner for comprehensive evaluation of tool wear.
Figure 9. Variation of combined uncertainties (Uc(C)) with flank wear.
The standard uncertainties of the distribution functions cover a range of 68% and 58% of the expected data for the uniform and rectangular distributions respectively. However, a 95% level of confidence is usually needed which requires the standard uncertainties to be expanded with an appropriate coverage factor k (Veronika, 2007). The resulting expanded uncertainty is obtained by multiplying the standard uncertainty with k. The value of k for a normal distribution is 1.96 and for a rectangular distribution is 1.65. In the case of a combined uncertainty, the expansion depends on the type of the distribution which dominates the combined uncertainty. In the case of present investigation, since the values of uncertainty A is much higher than the uncertainty B, the combined uncertainty given in Table 3 can be multiplied by coverage factor of 2 to cover 95% confidence level of the expected data.
Conclusion
Acoustic emission generated due to tool wear during turning of a silicon carbide dispersed Al alloy metal matrix composite has been studied. The statistical parameters, such as variance and coefficient of variation of the AE energy show variation with time of cutting. Statistical analysis of the AE signals based on an assumed β distribution of AE energy obtained during the wear test was carried out. The parameters of the β distribution namely skewness and
kurtosis are found to vary with flank wear. These results obtained are compared with the b-parameter of the amplitude distribution of AE hits presented in an earlier investigation. This shows that while b-parameter is suitable for monitoring early stage tool wear up to 0.4 mm, skewness and kurtosis show superiority over the b-parameter for monitoring later stages of flank wear. The variations of skewness and kurtosis with time have been attributed to different wear mechanisms in the composite, i.e., scratching and removal of tool material, and abrasion. Measurement of uncertainty of AE energy was determined as per ISO GUM. The combined uncertainty lies in the range of 0.38 to 1.69 with higher values for the cutting distance between 213.8 mm and 454.5 mm. It can be concluded that b-parameter from the peak amplitude distribution of AE signal, skewness and kurtosis for statistical distribution and uncertainties associated with the measurement of AE signals can be used in a complimentary manner for comprehensive evaluation of tool wear.
Acknowledgement
Authors thank Dr. P. R. Vasudeva Rao, Director, Metallurgy and Materials Group, Indira Gandhi Centre for Atomic Research, Kalpakkam for discussions.
References
Axinte Dragos A., Natarajan Deepak R. and Gindy Nabil N.Z., 2005, “An Approach to use Array of Three Acoustic Emission Sensors to Locate Uneven Events in Machining – Part 1: Method and Validation”,
International J. of Machine Tools and Manufacture, Vol.45, pp. 1605-1613. Barry J., Byrne G. and Lennon D., 2001, “Observations on Chip Formation and Acoustic Emission in Machining Ti–6Al–4V Alloy”,
International J. of Machine Tools and Manufacture, Vol. 41, pp. 1055-1070. Beattie A.G., 1976, “Energy Analysis in Acoustic Emission”, Mater. Eval., Vol. 34, pp. 73-78.
Cook R.R., 1999, “Assessment of Uncertainties of Measurement”, National Association of Testing Authorities, Australia.
Costa-Felix, 2006, “Type B Uncertainty in Sound Power Measurements using Comparison Method”, Measurement, Vol. 39, pp. 169-175.
Diei E. and Dornfeld D.A., 1987, “A Model of Tool Fracture Generated Acoustic Emission during Machining”, Trans. of the ASME J. of Engineering for Industry, Vol. 109, pp. 227-234, & “Acoustic Emission Sensing of Tool Wear in Peripheral Milling”, pp. 234-240.
Dimla Dimla E. Snr., 2000, “Sensor Signals for Tool-Wear Monitoring in Metal Cutting Operations - A Review of Methods”, International J. of Machine Tools & Manufacture, Vol. 40, pp. 1073-1098.
Dornfeld D.A. and Kannatey-Asibu E. Jr., 1980, “Acoustic Emission during Orthogonal Metal Cutting”, International J. of Mechanical Sciences, Vol. 22, pp. 285-296.
Gabriel V., Matusky J., Prusek A. and Zizka J., 1995, “Study of Machining Process by Acoustic Emission Method”, Proceedings of the IV International Conference on Monitoring and Automatic Supervision in Manufacturing, Miedzeszyn, CIRP, pp. 143-148.
Haber Rodolfo E., Jose Jiménez E., Peres C.R. and Alique R.J., 2004, “An Investigation of Tool-Wear Monitoring in a High-Speed Machining Process”, Sensors and Actuators A, Vol. 116, pp. 539-545.
Hwang T.W., Whitenton E.P., Hsu N.N., Blessing G.V. and Evans C.J., 2000, “Acoustic Emission Monitoring of High Speed Grinding of Silicon Nitride”, Ultrasonics, Vol. 38, pp. 614-619.
IAEA-TECDOC-1585, “Measurement Uncertainty - A Practical Guide for Secondary Standards Dosimetry Laboratories”, May 2008.
ISO-GUM, “Guide to the Expression of Uncertainty in Measurement”, BIPM, IEC, IFCC, ISO, IUPAC, IUPAP, OIML, Geneva, Switzerland, 1995. ISO 5725-2, Accuracy (trueness and precision) of measurement methods and results—Part 2: Basic method for the determination of repeatability and reproducibility of a standard measurement method, International Organization for Standardization, Geneva, Switzerland, 1994.
Iturrospe Aitzol, Dornfeld David, Atxa Vicente and Abete José Manuel, 2005, “Bicepstrum based Blind Identification of the Acoustic Emission (AE) Signal in Precision Turning”, Mechanical Systems and Signal Processing, Vol. 19, pp. 447-466.
0.0 0.2 0.4 0.6 0.8 1.0
0.2 0.4 0.6 0.8 1.0 1.2 1.4 1.6 1.8
U
c
(C
)
Iwata K. and Moriwaki T., 1978, “Cutting State Identification and In-process Tool Wear Sensing by Acoustic Emission Analysis”, Bulletin of the Japan Society of Precision Engineering, Vol. 12, pp. 213-215.
Jayakumar T., Mukhopadhyay C.K., Venugopal S., Mannan S.L. and Baldev Raj, 2005, “A Review of the Application of Acoustic Emission Technique for Monitoring Forming and Grinding Processes”, Jr. of Materials Processing Technology, Vol.159, pp.48-61.
Jemielniak Krzysztof, 2000, “Some Aspects of AE Application in Tool Condition Monitoring”, Ultrasonics, Vol.38, pp.604-608.
Jemielniak K. and Otman O., 1998, “Tool Failure Detection based on Analysis of Acoustic Emission Signals”, J. of Materials Processing Technology, Vol.76, pp.192-197.
Jeon-Ha Kim, Deok-Kyu Moon, Deuk-Woo Lee, Jeong-suk Kim, Myung-Chang Kang and Kwang Ho Kim, 2002, “Tool Wear Measuring Technique on the Machine using CCD and Exclusive Jig”, J. of Materials Processing Technology, Vol. 130-131, pp. 668-674.
Kakino Y., Suizo H., Hashitani M., Yamada T., Yoshika H. and Fujiwara A., 1983, “In-process Detection of Thermal Crack of Cutting Tool by Making use of Acoustic Emission”, Bulletin of the Japan Society of Precision Engineering, Vol. 17, pp. 241-246.
Kannatey-Asibu E., Jr. and Dornfeld D.A., 1982, “A Study of Tool Wear using Statistical Analysis of Metal Cutting Acoustic Emission”, Wear J, Vol. 76, pp. 247-261.
Kannatey-Asibu E., Jr. and Dornfeld D.A., 1981, “Quantitative Relationships for Acoustic Emission from Orthogonal Metal Cutting”, Trans. of ASME, Journal of Engineering for Industry, Vol. 103, pp. 330-340.
Keprt Jiri and Benes Petr, 2009, “Determination of Uncertainty in Calibration of Acoustic Emission Sensors”, International J. of Microstructure and Material Properties, Vol. 4, pp. 85-103.
Lan M.N. and Dornfeld D.A., 1984, “In-process Tool Fracture Detection”, ASME J. of Engineering Materials & Technology, Vol. 106, pp.111-118.
Lan M.N. and Dornfeld D.A., 1986, “Acoustic Emission and Machining – Process Analysis and Control”, J. Advanced Manufacturing Processes, Vol. 1, pp. 1-21.
Lee D.E., Hwang I., Valente C.M.O., Oliveira J.F.G. and Dornfeld D.A., 2006, “Precision Manufacturing Process Monitoring with Acoustic Emission”, International J. of Machine Tools and Manufacture, Vol. 46, pp. 176-188.
Lin J.T., Bhattacharyya D. and Lane C., 1995, “Machinability of a Silicon Carbide Reinforced Aluminium Metal Matrix Composite”, Wear, Vol. 181-183, pp. 883-888.
Marinescu Iulian and Axinte Dragos A., 2008, “A Critical Analysis of Effectiveness of Acoustic Emission Signals to Detect Tool and Workpiece Malfunctions in Milling Operations”, International J. of Machine Tools and Manufacture, Vol. 48, pp. 1148-1160.
Martín P. Gomez, Alfredo M. Hey, José E. Ruzzante and Carlos E. D. Attellis, 2010, “Tool Wear Evaluation in Drilling by Acoustic Emission”, Physics Procedia, Vol. 3, pp. 819-825.
Mohan B., Venugopal S., Rajadurai A. and Mannan S.L., 2008, “Optimization of the Machinability of the Al-SiC Metal Matrix Composite using the Dynamic Material Model”, Metallurgical and Materials Transactions A, Vol. 39, pp. 2931-2940.
Mukhopadhyay C.K., Venugopal S., Jayakumar T., Nagarajan R., Mannan S.L. and Baldev Raj, 2006, “Acoustic Emission Monitoring during Turning of Metal Matrix Composite and Tool Wear”, Materials Evaluation, Vol. 64, pp. 323-330.
Nakao Yohichi and Dornfeld D.A., 2003, “Diamond Turning using Position and AE Dual Feedback Control System”, Precision Engineering, Vol. 27, pp. 117-124.
Pollock A.A., 1973, “Acoustic Emission-2: Acoustic Emission Amplitudes”, Nondestructive Testing, Vol. 6, pp. 264-269.
Slavko Dolinsek, Janez Kopac, 1999, “Acoustic Emission Signals for Tool Wear Identification”, Wear, Vol. 225-229, pp. 295-303
Veronika R. Meyer, 2007, “Measurement Uncertainty”, J. of Chromatography A, Vol. 1158, pp. 15-24.
Whitehouse D., 1978, “β Functions for Surface Typology”, Ann., Vol.27, pp.491–497.
Xiaoli Li, 2002, “A Brief Review: Acoustic Emission Method for Tool Wear Monitoring during Turning”, International J. of Machine Tools & Manufacture, Vol.42, pp.157-165.
Xiaoping L. and Seah W.K.H., 2001, “Tool Wear Acceleration in Relation to Workpiece Reinforcement Percentage in Cutting of Metal Matrix Composites”, Wear, Vol. 247, pp. 161-171.
Wadley H.N.G., Scruby C.B. and Speak J.H. 1980, “Acoustic Emission for Physical Examination of Metals’, Int. Metals Rev., Vol. 2, pp. 41-64.