Klaus Schützer
[email protected] Universidade Metodista de Piracicaba (UNIMEP) Laboratório de Sistemas Computacionais para Projeto e Manufatura (SCPM) Santa Bárbara d’Oeste 13451-900 SP, BrazilAntonio Álvaro de Assis Moura
[email protected] Universidade Metodista de Piracicaba (UNIMEP) Laboratório de Sistemas Computacionais para Projeto e Manufatura (SCPM) Santa Bárbara d’Oeste 13451-900 SP, BrazilReiner Anderl
[email protected] Darmstadt University of Technology (TUD) Department of Computer Integrated Design (DiK) 64287 Darmstadt, GermanyChristian Mosch
[email protected] Darmstadt University of Technology (TUD) Department of Computer Integrated Design (DiK) 64287 Darmstadt, GermanyA Web Service Application to Support
Distributed Manufacturing
Manufacturing as an industrial activity that starts with the conceptual project and ends with proper material disposal or its reuse has evolved from a centralized to a distributed process. The several components of the process are distributed according to space and time. This evolution was possible due to the support of information technology, which allows manufacturing data management. However, this evolution happened in an independent way in each process phase, creating isolated solutions and consequently a high heterogeneity in data management. The development of a Federative Factory Data Management offers a solution of a transparent support to the users who need to obtain information from different proprietary systems. As an example of a service that demonstrates the possibility of federative management of manufacturing data in service oriented architecture within a heterogeneous and flexible environment, this article presents the estimated calculation of the manufacturing time for a complex surface.
Keywords: manufacturing oriented support, service oriented architecture, Federative
Factory Data Management
Introduction1
The manufacturing process has become a collaborative activity over the years and this process has been supported by computer aided systems. From a collaborative activity, but still centralized in one production plant, the manufacturing process became a distributed process, where each process phase can be executed by different companies or persons. This evolution was possible thanks to the information technology developments supporting the whole management process.
Nowadays the manufacturing process uses multiple independent systems, which generate a group of heterogeneous data. The management of this complex group of data implies great difficulty in interaction and little flexibility, since the mere data change between systems is a challenge in itself.
One possible solution to this increasing complexity is a Service Oriented Architecture (SOA), in which the stages of the product development chain requests services and receives the appropriated information, using appropriate languages and protocols.
This paper shows a Web Service which makes an estimation of the manufacturing time as an example to demonstrate the possibility of interaction of support systems given to manufacturing. The use of an available Web Service without time or space restrictions is useful in showing the functionality of the concept of a distributed and collaborative structure in a Service Oriented Architecture, where each manufacturing phase is done by available services on the Web, resulting in distributed data management with high flexibility.
Manufacturing Complexity
According to Urbanic and ElMaraghy (2006), manufacturing can be understood as a group of relations among the product project,
Paper received 2 August 2010. Paper accepted 21 March 2011 Technical Editor: Anselmo Diniz
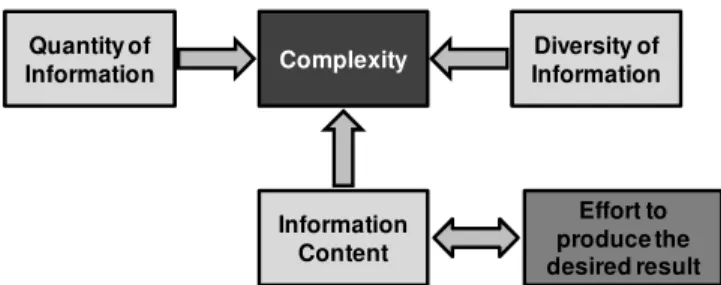
the materials, the production equipment and support systems, or in short, as a group of relations among the products, processes and resources. These elements and their connections in different levels lead to a scenario of complexity which can be considered, partly, as an association between the understanding and the management of a great group of information with much variety. Figure 1 shows a heuristic model of manufacturing complexity, introduced by Urbanic and ElMaraghy (2006) and composed of three basic elements: the quantity of information, the diversity of this information, and its content, which is the measurement of the effort to achieve the desired result.
Figure 1. Complexity Model (Urbanic and ElMaraghy, 2006).
The cause of this complexity can be attributed to the complexity of the product, which, according to Tudorache (2006), has its origin in the explosion of variants due to a customization process in mass. In the literature, most of the complexity is in the great variety of information that must be managed (Schleich, Schaffer and Scavarda, 2003) and which is intensified by the fact that the data, which describe the product, the processes and resources to the manufacture are originated from different sources (Grabowski and Meis, 1997).
Quantity of Information
Information Content
Diversity of Information
Complexity
The complexity in the manufacturing may have at least three negative consequences (Grabowski and Meis, 1997):
•Failure in product development integration; •Loss of efficiency in the process;
•Problems of cooperation among the various actors of the process.
These problems affect confidence and quality of the final product in such a way that pro-active actions must be taken to manage the manufacturing data (Urbanic and ElMaraghy, 2006).
Manufacturing in its broader conception also considers transversal or external factors. This enlarges the number of interactions and also the variety inserted in the process and at the same time demands a more coordinated performance from the systems that manage this information (Schwarzenbacher and Wagner, 2005). Another factor, equally important, is the consideration of legacy systems, since historically, manufacturing deals with autonomous systems which are often chosen by operational and not strategic criteria (Masson, 2006). These legacy systems must be incorporated into the manufacturing data management system, aggregating this information to the central model.
Due to data generation through isolated systems, external factors and legacy systems, the manufacturing activity shows a high degree of complexity.
Heterogeneous Data Management
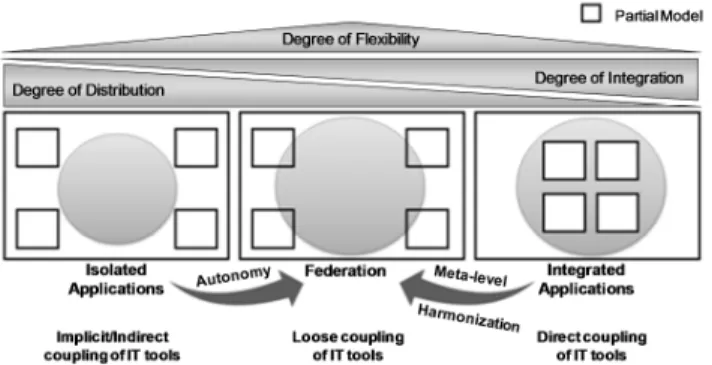
One of the reasons for manufacturing complexity is the fact that the data come from various sources, generated by specific applications to each phase of the product development. This leads to the need for integration among heterogeneous databases, which, according to Sheth and Larson (1990) can be defined along three orthogonal axes: heterogeneity, due to the possible different interpretations; autonomy, due to the possibility for each application to generate and manipulate the data; and distribution, due to the location of the database components. The management of the heterogeneous data can be done in three different ways with different degrees of distribution, flexibility and integration, as presented in Fig. 2.
Figure 2. Data management models (Abeln, 1997; Montau, 1995; Pedersen, 2005).
The maintenance of the distributed data in isolated applications keeps a high degree of distribution, and preserves the autonomy of the data which can be manipulated independently by each application. The data of each isolated application are coupled in an indirect way to the central model of the product. This model has little flexibility and a low degree of integration due to the implicit couplings of Information Technology (IT) tools. In this model there is some difficulty in dealing with data of coupling systems, which need a specific application for insertion into the central model.
Another option is the choice of a totally integrated model, where data of the partial models are assembled into the central model, generating a monolithic database. In this model there is no data distribution and the construction of the central model occurs through direct links. Like the previous model, this one does not have much flexibility, due to the fact that each change in an application or in a partial model implies the change of the central model and also presents some difficulty in dealing with legacy systems. The high degree of interaction permits complete control of the system, but it reduces the autonomy of each application to generate the data that belong to the application.
The intermediate solution between the two presented models consists in enabling the distribution of the data in isolated applications, but the construction of the central model must be executed through weak connections. Thus, the characteristic of autonomy to data management for each application is kept, and the central model stays harmonic. This intermediate solution not only keeps the independence of each application but also makes each part collaborate with the whole according to its specific ability (Schwarzenbacher and Wagner, 2005).
This model allows data insertion of a legacy system to a central model only with the creation of an interface of data adjustment, without the need to modify the model as a whole.
Due to these characteristics this model presents the greatest flexibility without losing its integration and distribution characteristics. The implementation of this model assumes a federative layer which is able to ask for information to the distributed databases making the interface between the partial models and the central model.
According to Abramovici and Bellalouna (2007), a federative data model is the solution to the integration of the partial models that exist in the manufacturing activity, since it serves both the distribution and the integration requirements while keeping a high degree of flexibility.
Web Services
To access a federative system one can use the Web Services technology which is based on the construction of new applications through the combination of available services on the Web so that, together, they can achieve the desired goal. This kind of construction allows for the interoperability of the existing systems as well as for the possibility of applications in real time (Fileto, 2003).
According to Booth (2004), Web Services are defined as a software system that enables machine to machine interaction in a web and has an interface described in a format, which can be interpreted automatically, specifically the WSDL (Web Service Description Language). The communication of other systems with a Web Service occurs with a message through SOAP (Single Object Access Protocol).
Web Services normally, but not necessarily, use the HTTP protocol (Hypertext Transfer Protocol) with data described in XML (eXtensible Markup Language).
The concrete implementation of a Web Service is made through the message exchange between agents who belong to a service requester, and a service provider, who provides the requested response. The messages exchanged between the requester and the provider varies from a simple datum to complex objects.
on the Web, which is allocated in a specific address. The access to this address presents the access interface with the necessary information for the correct use of the available services through the semantics description of the service.
This description contains the format of the message, the data type, the communication protocol, the serialization mechanisms as well as the site where the service will be available on the Web, this whole description is made in WSLD which is based in the XML format.
With this information, the service requester agrees with the semantics and with the other characteristics of the available service and then can consume the service through requests. Inside a Web Service context, the semantics includes the expectations for the service behavior, particularly in the response to sent messages. To an isolated Web Service the semantics issue is not so important, but in an architecture based on services to a distributed system, the Web Service semantics is essential to adapting the request to the correct response. While the service description represents a contract between parts, semantics represents the contract which governs the meaning and purpose making the automation of the services possible.
In general, the use of a Web Service occurs as presented in Fig. 3, following the steps, which can or cannot be automatized:
1. the requester and the provider know each other;
2. the requester and the provider agree on the semantics which will support the interaction;
3. the service description and the semantics are executed; 4. the requester and the agent provider exchange messages,
sending requests, processing them and receiving responses.
Figure 3. The general process of engaging a Web Service (Booth, 2004).
The messages exchanged by a Web Service use Single Object Access Protocol (SOAP), which, although originally projected to use HTTP as transport protocol, can run in other web protocols such as FTP (File Transfer Protocol), or SMTP (Simple Mail Transfer Protocol). The SOAP protocol is extensible and allows different types of communication such as one-way, request-response or multi-cast. Furthermore, SOAP is not linked to any language or technology.
Therefore, Web Service technology serves the needs of federative management of data, enabling data of partial models to become accessible in real time and to be present in the central model, while simultaneously, allowing for the autonomy of the local management of specific data.
FEDMAN Proposal
The FEDMAN project, acronym for “Federative Factory Data Management (FFDM) based on Service Oriented Architecture (SOA) and Semantic Model Description on XML and RDF for Manufacturing Products”, is a research project, which belongs to the BRAGECRIM program – Brazilian-German Collaborative Research
Initiative on Manufacturing Technology. This research project proposes a layered structure to manage the data related to manufacturing in a federative way with the use of Web Services for the exchange of messages in XML through the Single Object Access Protocol (SOAP).
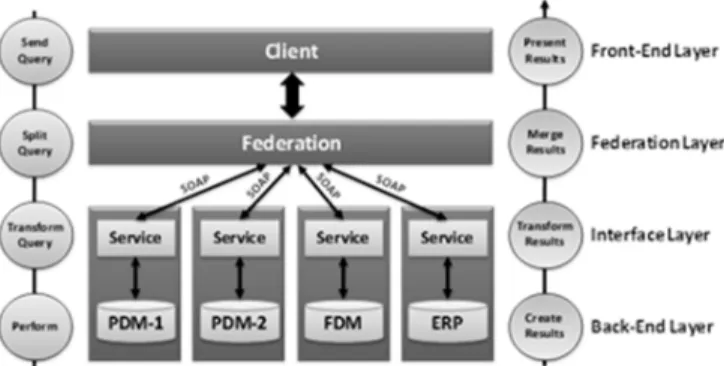
The structure of the project, presented in Fig. 4, is composed of four layers: front-end, federation, interface and back-end.
Figure 4. FEDMANproposal structure, adapted from (Anderl, Rezaei, Schützer and Moura, 2009).
The back-end layer is responsible for the data related to the collaborative process of manufacturing which are generated locally by the applications used in each of the phases of this process. Thus, isolated applications are responsible for the creation and maintenance of the necessary data for this phase. For example, the project data are generated and kept by project systems aided by computers. Once the data are generated by other phases, they are available through a specific application of the system. These data, in XML format, are then available to the FEDMAN system. Equally this occurs with other isolated systems that compose the group belonging to the manufacturing activity.
The data made available by the local applications are kept on the Web and can be accessed by services specifically created for this objective. The Web Services serve a request made by the client in the front-end layer; however, it is distributed by the federative layer. The Web Service collects the necessary data and sends a response to this request, and the complete exchange of messages is made in XML. As a responsible agent for receiving the request and sending the response, the Web Service has the capacity of transforming the request asked by the client and adjusting the response according to the data made available by the application.
The federative layer and the front-end layer are aggregated in a browser which allows the manufacturing process planner to manage the process data, coming from the Computer Aided Manufacturing (CAM) and Business Process Modeling (BPM) systems; product data, coming from Computer Aided Design (CAD) systems; and resources data, coming from Enterprise Resources Planning (ERP) and BPM systems. Since these data are generated and managed from various isolated systems, they are heterogeneous. The front-end layer has the functionalities of enabling data access through requests, which are presented in a matrix format relating Product x Process, Product x Resources and Process x Resources.
The information flow proposed by the FEDMAN project starts in the front-end layer, where the client who wants this information on the manufacturing activity planning makes the request. This request passes through the federative layer which makes the choice of the adequate services and sends them to the interface layer. In this layer the service accesses the data made available by the applications in the back-end layer and obtains the response to the request. The response is then sent to the federative layer which matches the results and presents them to the client in the front-end layer.
1. Parties “become know” to each other
Semantic
WSD
Requester Agent 3. Input Semantics
and WSD
Semantic
WSD
Provider Agent
3. Input Semantics
and WSD Semantic WSD
2. Agree on Semantics and WSD
4. Interact Requester
Human
Provider Human
FEDMAN Browser
The structure in layers enables the users to work with high levels of complexity. In the FEDMAN project the front-end and federative superior layers are grouped in a browser which presents the data related to the manufacturing process to the system user and manages the access to Web Services which are able to obtain these data.
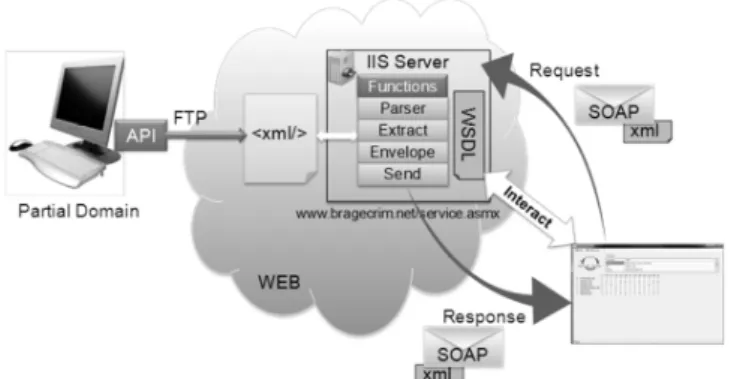
Figure 5 presents the functionality of the FEDMAN project. The partial domains, like CAD, CAM or BPM applications, through the dedicated interfaces, release the data in conditions to be used by the system as a whole. For example, when the planner considers that the product data are mature enough to contribute to the system, he delivers this version, sending the data to the Web. In the FEDMAN project these data are always in XML.
Figure 5. FEDMAN project functionality.
On the other side of the system, the planner requests a vision of the product development opting for one of the three existing visions: Product x Processes; Product x Resources; and Processes x Resources. The browser then establishes the links with the Web Services through their descriptions, in WSDL, and sends an information request through a message in SOAP.
The Web Service receives the message and activates the adequate function to the requested service, analyzes the available information on the Web, extracts the pertinent data, envelopes them in a SOAP message and sends them back to the browser.
Finally, the browser collects the information obtained by the services and presents them in a matrix, allowing the user to designate the links among the three reference axes informing which parts of the product are related to which resources and with which processes.
Web Service Application – Machining Time Estimate
Determining the real machining time is a key factor in the process decision about cutting parameters and machining strategies. Very often there are no systems capable of estimating the machining time with enough precision due to the lack of effective observation equipment or tools, which are required to exactly measure the minimum federates. There are several papers on this topic, which present different strategies for estimating the machining time (e.g. Jong et al. (2009); So et al. (2007); Maropoulos (2000); Lai-Yuen and Y.-S. Lee (2002); Monaro and Helleno (2010) and Heo et al. (2006)).
In this paper the Web Service method proposed by Heo et al. (2006) will be used to exemplify the federative approach in a manufacturing scenario. In this method, the acceleration and deceleration distance are considered as shown in Fig. 6. As this calculation takes into account intrinsic parameters concerning the machine to be used, it is necessary to get this information with the
machine producer or with practical experiments. In the Heo, D. et al. (2006) paper, a practical experiment was made to determine these parameters for a specific machine. Considering this procedure as a service, the final user may request a real estimate for the machining time starting from a cutter location data file generated by a CAM system. After the upload of the file and the calculation, the final user receives the response. However, based on the previously cited paper, it is possible to consider the dynamic information about the machine in use, even before the finalization of the Numerical Control (NC) programming of a part in a CAM system.
Heo et al. (2006) proposed a classification of the NC blocks in four cases, as shown in Fig. 6. In the first case (Fig. 6(a)) the NC block is long enough to accelerate, stabilize and decelerate; therefore, the machining time can be calculated by Eq. (1).
Figure 6. Four cases of feed rate behaviors (Heo et al., 2006).
)
(
)
(
)
(
)
1
(
)
(
)
(
i
F
acc
i
F
i
F
acc
i
F
i
F
i
t
=
−
m−
+
−
m+
∆
i−
∆
ai−
∆
di (1)where:
t(i) = machining time for ith block [min]; F(i) = feed Rate for ith block [mm/min];
Fm(i-1) = starting speed for ith block [mm/min] equals ending speed of previous block;
Fm(i) = ending speed for ith block [mm/min]; acc = acceleration [mm/min2];
i
∆
= block length for ith block [mm];ai
∆
= acceleration space for ith block [mm];di
∆
= deceleration space for ith block [mm].If the NC block is not long enough to accelerate and decelerate, then the feed rate will not be achieved and a different maximum speed for the block must be calculated. The block in this case has two sectors, one for acceleration and another for deceleration, as shown in Fig. 6(b). The machining time for this case is calculated by Eq. (2).
acc
i
F
i
F
i
F
i
t
(
)
=
2
(
)
−
m(
−
1
)
−
m(
)
(2)Some NC blocks are so small that a complete acceleration is not possible (Fig. 6(c)) or there is a complete deceleration (Fig. 6(d)). In any of these cases, a new ending speed must be calculated and the machining time is obtained following Eqs. (3) and (4).
acc
i
F
i
F
i
t
(
)
=
m(
)
−
m(
−
1
)
(3)acc
i
F
i
F
i
To make the NC machining time estimate as a Web Service, it is necessary to receive the NC program as a message, make the service (i.e. the calculation of machining time) and the delivery of the response (in this case the machining time) as a message. To calculate the estimated manufacturing time, two pieces of information are needed: the NC program – in a Cutter Location Data file format, and the information about the programmed advance speed, which normally is the maximum. For this, the Web Service asks for the Cutter Location Data file and, inside this file, extracts the information about the programmed advance speed. The message sent to the Web Service is in the form of a string with the physical location of the Cutter Location File, in this case representing a linear interpolated tool path, and a string with the value (in a text format) of the programmed federate. With this information the file is uploaded and then the coordinates of the points for each segment of the linear interpolated tool path are read. In addition, it is possible to calculate the estimated machining time for a Cutter Location Data File, according to the structogram shown in Fig. 7.
The Web Service splits each NC block according to the Heo et al. (2006) classification criteria, and for each case determines the machining time. Afterwards the sum of all machining times is made in order to obtain the total machining time.
Figure 7. Structogram for estimated machining time for a Cutter Location Data File.
Figure 8 shows the structogram for the calculation of machining time for one NC block. First the ending speed is calculated and the initial speed is assumed to be the ending speed of the previous block. In principle the maximum speed for the block is the programmed federate. With these parameters it is possible to find the space needed to accelerate and decelerate. If the block length is long enough to accelerate and decelerate then the block has three sectors and the machining time can be calculated. Otherwise, if the block length is not long enough, a new maximum speed is calculated according to Eq. (5).
Figure 8. Structogram for one NC Block Machining Time.
2
)
(
)
1
(
.
)
(
2 2
i
F
i
F
acc
i
F
m mi M
+
+
+
∆
=
(5)where:
FM(i) = maximum speed for ith block [mm/min].
Nevertheless, some blocks are only long enough to accelerate or decelerate. When this occurs the acceleration space or deceleration space is equal to zero, and the block is type C (only acceleration) or type D (only deceleration), see Fig. 8.
The Web Service also provides functionality to add the number of blocks of each type described in Fig. 6 and the total number of blocks in the cutter location data file.
The machining time estimation is made on an experimental basis and is only valid for the machine tool used on these tests, which consider the acceleration characteristic of the specific machine. To extend this support to any machine tool in the shop floor, it would be necessary to get the dynamic parameters of the machines. Also the machine tool producers could make available this kind of service through a Web service, so any NC programmer with the FEDMAN application could use this service.
Final Considerations
This example of integration between CAD and CAM systems made through Web Services presents a possibility for managing the manufacturing complexity in a distributed and collaborative Time Machining Estimation
block = normal Feed Rate
False True
Create a block object with programmed Feed Rate
Create a block object with Rapid Feed Rate Block (0). startingVelocity = 0.0
Determine the time machining for the i-th block
Block(i+1).startingVelocity = Block(i).endingVelocity
Total Time Machining = 0.0
Total Time Machining += Block(i).timeMachining For i = 0 to number of blocks
For i = 0 to number of blocks
For i = 0 to number of blocks
Machining Time Calculation for one NC Block
Fi = Fm (previous block) Starting speed
Fm = Fm (feedrate, angle) Ending speed
FM = Fm Maximum speed
AccSpace = (FM ^ 2 – Fm ^ 2) / 2 * acc
DeaccSpace = (FM ^ 2 – Fm ^ 2) * acc
Block Length > AccSpace + DeaccSpace
False True
Block Type A New FM
New AccSpace
New DeaccSpace
AccSpace<>0 .AND. DeaccSpace<>0
False True
Block Type B Fm>Fi
Fm>Fi
False True
Block Type C Block Type D
Machining Time Calculation Machining
Time Calculation Machining
Time Calculation Machining
environment. In the reality presented in this example, machine manufacturers of numeric controls and research institutes, among others, may offer services to be consumed in a totally independent way.
Although this is an example of only one service, it is possible to notice the intermediate level of autonomy and integration as well as the high degree of flexibility that a federative system can present.
The division into layers enables the system to be updated with no change in functionality, which can affect the whole system. It enables the services here presented to be integrated into a complex system as well as to offer adaption for the inclusion of legacy systems.
The federative management of manufacturing data in service oriented architecture with the use of Web Services is one of the solutions to deal with the complexity of distributed manufacturing.
Acknowledgements
The authors thank the support of the “Coordenação de Aperfeiçoamento de Pessoal de Nível Superior” (CAPES) through the project BRAGECRIM #007/09 – “Federative Factory Data Management (FFDM) based on Service Oriented Architecture (SOA) and Semantic Model Description on XML and RDF for Manufacturing Products” for the realization of the present paper.
References
Abeln, O., 1997,“Innovationspotentiale in der Produktentwicklung: Das
CAD-Referenzmodell in der Praxis”. Stuttgart: Teubner Verlag.
Abramovici, M. and Bellalouna, F., 2007, “Integration and Complexity Management within the Mechatronics Product Development”. In Y. Takata,
Shozo And Umeda (Ed.), Advances in Life Cycle Engineering for
Sustainable Manufacturing Businesses, pp. 113-118, London: Springer London. doi: 10.1007/978-1.
Anderl, R., Rezaei, M., Schützer, K. and Moura, A.Á.A., 2009, “A Federative Factory Data Management Approach for the Integration of
Product and Process Models”. ProduktDaten Journal, (2), pp. 49-53. ISSN
1436-0403
Booth, D., 2004, “Web Services Architecture”, W3C Working Group. Retrieved from http://www.w3.org/TR/2004/NOTE-ws-arch-20040211/.
Fileto, R., 2003, “A abordagem POESIA para a integração de dados e serviços na Web Semântica”, Doctoral Thesis, Universidade Estadual de Campinas.
Grabowski, H., and Meis, E., 1997, “Using ontologies for the Integrated Product Model Development”. AAAI Tecnnical Report SS-97-06, 7. Retrieved from www.aaai.org.
Heo, E.-Y., Kim, D.-W., Kim, B.-H., and Chen, F.F., 2006, “Estimation of NC machining time using NC block distribution for sculptured surface
machining”. Robotics and Computer-Integrated Manufacturing, 22(5-6), pp.
437-446. doi: 10.1016/j.rcim.2005.12.008.
Jong, W.-ren, Lin, T.-chun, Lai, P.-jung, Li, T.-chih, Wu, C.-hsien and Li, M.-yan, 2009, “Integration of Mold Design and Mold Manufacturing”, In Proceedings of ANTEC 2009 Plastics: Annual Technical Conference, pp. 1775-1780. Chicago, IL: Society of Plastics Engineers. doi: 978-0-9753707-7-3 Lai-Yuen, S.K. and Lee, Y.-S., 2002, “Turn-Mill Tool Path Planning and Manufacturing Cost Analysis for Complex Parts Machining”, Industrial Engineering Research (IERC) Conference. Orlando, FL.
Maropoulos, P., 2000, “Integration of tool selection with design Part 2:
Aggregate machining time estimation”, Journal of Materials Processing
Technology, 107(1-3), pp. 135-142. doi: 10.1016/S0924-0136(00)00688-9. Masson, C., 2006, “SOA can light up manufacturing IT”, Computer Weekly. Retrieved from http://www.computerweekly.com/Articles/2006/11 /09/219795/soa-can-light-up-manufacturing-it.htm.
Monaro, R.L.G. and Helleno, A.L., 2010, “Desenvolvimento de um índice de desempenho dinâmico (IDDyn) para avaliação da estratégia de usinagem em máquinas-ferramentas”, IV Congresso Nacional de Engenharia Mecânica (p. 16). Campina Grande.
Montau, R., 1995, “Föderatives Produktdatenmanagement anhand semantischer Informationsmodellierung”, Düsseldorf: VDI Verlag. doi: 10.3929/ethz-a-001638863
Pedersen, S., 2005, “Interoperabilität heterogener Informationsquellen im Gesundheitswesen auf Grundlage von Standards für die medizinische”, Kommunikation und Dokumentation Dissertation der Universität Oldenburg. Schleich, H., Schaffer, J. and Scavarda, L.F., 2003, “Managing
complexity in automotive production”, ICPR – International Conference on
Production Research. Valparaiso, Chile.
Schwarzenbacher, K. and Wagner, J., 2005, “The Federative Principle in Business Architecture 2 Business Architecture: Vision and Reality”. In D. Konstantas, J.-P. Bourrières, M. Léonard and N. Boudjlida (Eds.), “Interoperability of Enterprise Software and Applications”, pp. 567-579. Geneva: Springer. doi: 1-84628-151-2.
Sheth, A.P. and Larson, J.A., 1990, “Federated Database Systems for
Managing Distributed, Heterogeneous, and Autonomous Databases”, ACM
Computing Surveys, 22(3), pp. 183-236. doi: 10.1145/96602.96604. So, B., Jung, Y., Park, J. and Lee, D., 2007, “Five-axis machining
time estimation algorithm based on machine characteristics”. Journal of
Materials Processing Technology, 187-188, 37-40. doi: 10.1016/j. jmatprotec.2006.11.159.
Tudorache, T., 2006, “Employing Ontologies for an Improved Development Process in Collaborative Engineering”, Doctoral Thesis, University of Berlin.