Marcos Pinotti
Laboratório de Bioengenharia – LABBIO Department of Mechanical Engineering Universidade Federal de Minas Gerais – UFMG Av. Antono Carlos, 6627 31270-901 Belo Horizonte, MG. Brazil [email protected]Edna M. de Faria
Centro de Pesquisas em Hidráulicae Recursos Hídricos-CPH Universidade Federal de Minas Gerais – UFMG Av. Antono Carlos, 6627 31270-901 Belo Horizonte, MG. Brazil
Critical Flow Regions in Tissue
Artificial Heart Valve Assessed by
Laser Doppler Anemometer in
Continuous Flow
Flow diagnosis using non-invasive techniques such laser Doppler anemometer (LDA) is an important tool to improve the design of artificial heart valves. In the present study, an experimental protocol to obtain flow velocity field and colour coded maps of turbulent eddies dimensions using LDA measurements in a 25 mm bovine pericardium bio prosthesis valve is reported. A transparent Plexiglas chamber was specially designed to allow optical access to the flow passing through the valve. Experiments were conducted for non-pulsate flow (to study the valve performance in the peak flow) for the aorta Reynolds number ranging from 3300 to 6800. LDA interrogation volume visited five thousand and one hundred points along the flow (2500 points upstream and 2600 points downstream) for each Reynolds number. Post-processing methodology was employed to obtain haemolytic potential colour-coded maps, which were related to turbulent quantities. It was observed that haemolytic regions tend to move downstream the valve when the flow rate is increased.
Keywords: Laser doppler anemometry, artificial heart valve, steady flow, bio prosthesis
Introduction
Artificial heart valves obtained from modified biological tissues represents about 35 % of the world market of valve prostheses (in Brazil it represents about 80 % of the implanted artificial valves). Red blood cell damage (haemolysis) and thrombo-embolism are the major concerns regarding the implantation of artificial heart valves. In the last decades, a great number of in vitro studies have been conducted to improve the valve design and to understand the trans-valvular flow patterns under steady state and pulsate conditions (Castellini et al., 2001). Steady state tests are useful to study the flow established upstream and downstream the valve prosthesis in the moment of the peak flow rate. Flow diagnosis using non-invasive techniques such laser Doppler anemometer (LDA) may be associated to steady state test rig to improve haemolytic evaluation of a specific valve design.1
In the present study, LDA was employed to measure the velocity field in a pre-commercial model of bio prosthesis (low profile, bovine pericardium valve) in steady state flow. In order to provide good conditions to investigate the flow field using optical equipment, a transparent test rig was specially designed.
Nomenclature
A = cross sectional area of the valve, area, m2 D = inner valve diameter, diameter, m L =Characteristic length of the flow passage, m Ld =Characteristic length of the turbulent eddies, m Q = flow rate, L/min
Re = Reynolds number of the fluid flow, Reynolds number, dimensionless
u = velocity fluctuation, RMS velocity, m.s-1 X,Y,Z = Cartesian axes.
Greek Symbols
ν = fluid kinematic viscosity, m2.s-1 ρ = fluid density, kg.m-3
σ = Reynolds normal stress, N.m-2
Paper accepted May 2006. Technical Editor: Atila P. Silva Freire.
Subscripts
n relative to normal stress
d relative to the smallest turbulent eddies
Haemolysis and Turbulence
The information of the smallest turbulent eddies is an important evaluation parameter because it is possible to correlate the dimensions of the turbulent eddies and the red blood cell (RBC) damage. The basic concept which is learned from the literature is that the way in which turbulence affects the RBC in a shear flow. It clearly depends on how the turbulent eddies are dissipated in the flow. The phenomenology of such dissipation is known, in the basic turbulence literature (Hinze, 1959), as Energy Cascade.
The basic idea of this theory (experimentally observed in many real situations) is that larger eddies are continuously transferring their energy to smaller eddies through inertial interaction. At the same time viscosity effects and, with them, dissipation become more and more important for the smaller eddies. When the smallest eddies, at the end of the Energy Cascade, are the size of a red blood cell, they can be dissipated through interaction with the cell and transfer their energy to the cell membrane. Such dissipation causes the membrane rupture with the consequent release of haemoglobin into the plasma. On the other hand, if the smallest eddies are greater than the erythrocyte, the cell will be convected away and its membrane will experience only the relative motion in respect to the turbulent fluid.
Kramer (1970) seems to be the first to recognize that the characterization of the red cell trauma due to turbulence may be described by three essential influence parameters, namely the size of the turbulent eddies, the turbulent shearing stresses and the time in which RBC remain in zones of high turbulence. His experiments with perforated disks showed that in the same flow regime, the haemolysis rate may vary at stenoses with the same pressure loss but different geometry.
4 3 ≈ ν uL L L d (2)
Where, L is the characteristic length of the flow [m], u is the velocity fluctuation (considering isotropic turbulence) [m/s] and ν is the kinematic viscosity [m2/s] of the fluid.
Since u is directly related to the Reynolds normal stress (σn),
2 1 = ρ σn u (3)
An expression for Ld may be derived:
8 3 4 1 n d L k L σ = (4)
Where ρ is the fluid density [kg.m-3] and =ν34ρ38 k
Using the information arising from the Energy Cascade theory and the Kolmogorov micro scale calculations, Baldwin et al. (1994) has estimated the smallest eddies lengths for forward and for regurgitant flow (52µm and 6µm, respectively) in a prosthetic mechanical heart valve (Björk-Shilley type) installed in the Penn State artificial ventricle. The calculations suggested that the regurgitant flow is likely to be more damaging to blood cells than the forward flow because the turbulent micro scale in regurgitant flow is of the order of magnitude of a red blood cell (≈8µm). Similar strategy was employed by Jones (1995) to demonstrate that the correlation between Reynolds shear stress and blood cell damage is not direct. It is important to keep in mind that Reynolds Stresses are convective acceleration terms, and the term shear stress derives from their effect on the mean velocity profile, not on the local forces (White, 1991). As Jones pointed out, Reynolds stresses arise from the larger turbulent eddies and, as mentioned above in the present paper, the majority of viscous dissipation occurs at smaller length scales. Unfortunately, a direct measurement of the latter quantity imposes an excessive spatial resolution for the available instrumentation. On the other hand, a methodology for non-intrusive measurements of Reynolds stresses is established both for laser Doppler anemometer (Yoganathan et al., 1986) and pulsed Doppler ultrasound (Hasenkam et al., 1988).
It is not clear yet which turbulent quantities may be associated to the blood cell damage in shear flows, but turbulent micro scales emerge naturally as the link between viscous dissipation at the cellular scale and the measurable turbulent quantities. Equations 2, 3 and 4 provide the link between the large-scale quantities of the flow (dimension of the turbulence generator, L, a measure of the energy which is dissipated in the Energy Cascade) and the dimension of the smallest eddies. The map of the smallest turbulent eddies dimensions was obtained by using the methodology develop by Pinotti (2000).
Materials and Methods
The Bovine Pericardium Artificial Heart Valve
The bio-prosthesis tested in the present paper (Fig.1) is a model of slow profile bovine pericardium with implantation diameter of 25mm (internal diameter of 19.6mm and external diameter of 24.6mm; COMEX Ltda., Brazil).
(a) (b)
Figure 1. (a) Downstream and (b) Upstream views of the bio prosthesis tested.
Experimental System and Measurement Technique
A typical in vitro test circuit was employed to reproduce flow similitude with aorta in the moment of peak flow (aorta Reynolds number in the range from 3300 to 6800).
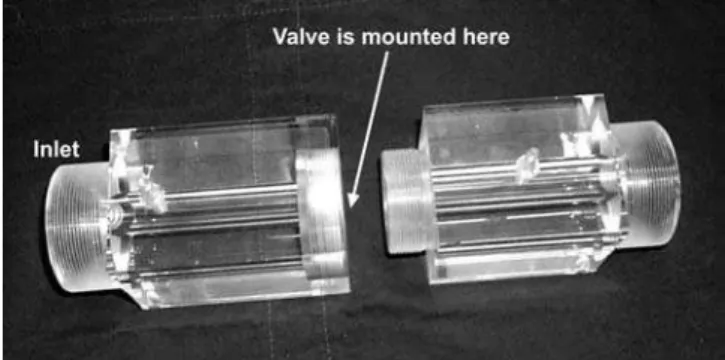
A special designed test chamber (Fig. 2) was devised to allow non-invasive measurement of the flow field by using laser Doppler anemometer in the diametric middle planes. It consists of a solid Plexiglas block manufactured to form a circular channel where the valve prosthesis was installed. All Plexiglas surfaces were polished to provide high quality optical access. The working fluid (water) was seeded with polyamide particles of 5µm diameter and 1030kg/m3 of density.
Figure 2. Transparent test chamber made of a high quality Plexiglas.
Two-beams, Argon ion-based LDA system (Dantec, Denmark) was used in backscattering configuration for one-component velocity measurements. A fibre optic probe was employed for beam delivery and for collection of the scattered light. The beams of identical wavelengths were crossed at the beam waist to form an ellipsoidal measurement volume. The resulting ellipsoid computed inside the test chamber had diameter of 0.078mm and length of 0.978mm for the green (514.5mm) component. To measure negative velocities, Bragg cell was used to shift by 40MHz the frequency of one of the two beams. The collected signal was analysed by 58N40 processor (Dantec, Denmark).
Figure 3, Valve orientation in the test chamber and its relative position in respect of the two orthogonal measurement planes.
In order to minimise the influence of the eventual poor particle concentration and particle diameter dispersion on the measurements, a minimum quality criterion was defined in terms of data rate (>0.7Hz) and percentage of valid data (>75%).
Measurements Points Inside the Test Chamber
Five thousands and one hundred points were visited by the measurement volume upstream and downstream the valve (2500 points upstream and 2600 points downstream). The measurement points were distributed along two orthogonal planes. In the axial direction, the measurement points were not distributed uniformly. They were concentrated in regions where it was expected to have flow disturbances – few millimetres upstream and downstream the valve.
Figures 4 and 5 show the measurement points distribution in the radial direction and in the axial direction, respectively. It was employed two orthogonal planes, the Measurement Plane 1 (light grey dots in Fig. 4) and the Measurement Plane 2 (dark grey dots in Fig. 4).
Figure 4. Measurements point distribution in the radial direction. The test chamber was rotated by 90 degrees in order to allow measurements in two orthogonal planes.
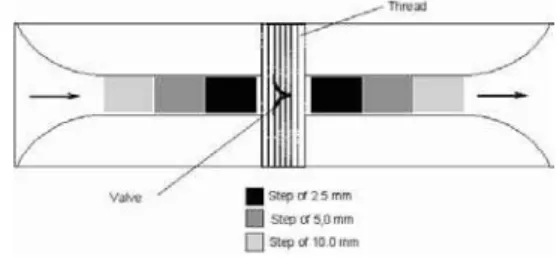
In the axial direction, the smallest step for the measurement volume movement was set immediately upstream and downstream the valve (Fig. 5).
Figure 5. Measurements point distribution along the axial direction.
Flow visualisation near the leaflets and in the entrance region of the valve was not possible because of the test chamber design. Thread mounting system has shadowed a region of 1.4 millimetres
thick upstream and downstream the valve. On the other hand, high quality flow visualisation was possible to perform where proper optical access was achieved. The loss of flow information near the valve was not considered detrimental because of the nature of the steady state flow regime imposed to the valve. It was possible to observe the fluid jet development upstream and downstream the valve, and its interaction with the test chamber walls.
To prevent flow disturbances caused by external sources (mainly the vibration induced by the pump operation), a special anti-shock system was devised for the test circuit bed.
Results and Discussion
Tests were conducted with two flow rates: 3L/min e 6.4L/min, which correspond to Reynolds number of about 3300 and 6800, respectively. Reynolds number in the range of 3000 and 7000 are commonly encountered in the aorta root (KNOCH et al., 1998).
The Reynolds number was calculated by using Eq. (1) as follows:
ν
i i
A D Q
=
Re (1)
Where, Q is the flow rate [m3.s-1], ν is the kinematic viscosity of the working fluid [m2.s], Di is the inner diameter of the valve [m] and Ai
is the valve cross section area [m2].
Measurements of the fluid velocity were performed in the orthogonal planes shown in Fig. 3 and following the mesh presented in Figs. 3 and 4.
Figure 6 shows the interpolated map (linear interpolation between measured points) of the axial velocity field obtained along the Measurement Plane 1 for the flow rate of 3 L/min (Re=3300) and flow rate of 6.4L/min (Re=6800). Viscous forces play an important role in the flow pattern passing through the valve. For the situation of the lower Reynolds number (Re=3300), the jet downstream the valve exhibits perturbation in the flow produced by the valve geometry and by the orientation of the valve leaflets. The situation changes when the inertia forces effects become important (Re=6800). It is possible to identify clearly the jet upstream the valve and the perturbation produced by the reduction of the annular space do not produce recirculation zone downstream the valve, in contrast of what occurs for the lower Reynolds number flow.
Figure 7 presents the map of the smallest eddies dimensions in the flow upstream and downstream the valve for the two situations studied in in vitro tests. It shows that the smallest turbulent eddies have the dimensions of about 25µm for the situation of Re=3300, occurring 4 millimetres upstream the valve. The most critical situation for the RBC appears in the flow downstream the valve where the smallest dimension of the turbulent eddies reaches the value of 12µm in the downstream flow (at 5 millimetres away from the valve) for the situation of Re=6800.
Figure 6. Axial velocity field upstream and downstream the valve for two experimental situations: Re=3300 and Re=6800. The flow occurs from left to right. The original colour-coded maps of 256 colours were converted into grey scale map due to publication constraints.
Figure 7. Dimensions of the smallest turbulent eddies upstream and downstream the valve for two experimental situations: Re=3300 and Re=6800. The region downstream the valve for Re=6800 imposes the worst situation for blood cell damage.
Conclusions
An experimental protocol was devised to measure the flow field passing through an artificial heart valve by using laser Doppler anemometer. The geometry of the test chamber allows velocity measurements in only two orthogonal planes of the fluid flow field. By observing the flow in these measurement planes it was possible to identify regions in the flow upstream and downstream of the valve where the perturbations may trigger undesirable blood degradation such haemolysis and thrombus formation. Colour coded maps of the axial velocity field and the characteristic length of the turbulent eddies were employed to point out regions in the flow where the conditions could lead to haemolysis, based on the evidences found in the literature. In the flow conditions imposed to
the valve, it was possible to locate two hot spots in the flow, considering haemolysis, the first one occurring 4 millimetres upstream the valve for Reynolds number of 3300, and the second one being observed at 5 millimetres downstream the valve for Reynolds number of 6800.
Acknowledgements
References
Baldwin, JT, Deutsch, S, Geselowitz, DB, Tarbell, JM., 1994, “LDA Measurements of Mean Velocity and Reynolds Stress Fields within an Artificial Heart Ventricle”. TRANS ASME - J. Biomechanical Engineering, Vol.116, pp.190-200.
Castellini P, Pinotti M, Scalise L., 2001, “Particle Image Velocimeter for Flow Analysis in Mechanical Artificial Heart Valves”. Progress in Biomedical Optics and Imaging.; Vol.2, n.34, pp.187-191.
Hasenkam JM, Westphal D, Nygaard H, Reul H, Giersiepen M, St∅dkilde-J∅rgenhen H.,1988, “In Vitro Stress Measurements in the Vicinity of Six Mechanical Aortic Valves Using Hot-Film Anemometry in Steady Flow”. Journal of Biomechanics; Vol.21, n.3, pp.243-247.
Hinze, J.O., 1959. “Turbulence - An Introduction to its Mechanism and Theory”, New York: McGraw-Hill.
Jones, AS., 1995, “A Relationship Between Reynolds Stresses and Viscous Dissipation: Implications to Red Cell Damage”, Annals of Biomedical Engineering, Vol.23, pp.21-28.
Knoch M., Reul H., Kroger R., Rau G., 1988, “Model Studies at Mechanical Aortic Heart Valve Prostheses - Part I: Steady-State Flow Fields and Pressure Loss Coefficients”. Trans. ASME - J. Biomech. Eng.,Vol.110, pp.334-343.
Kolmogorov, AN., 1941, “The Local Structure of Turbulence in Incompressible Viscous Fluid for Very Large Reynolds Number”, Dokl. Akad. Nauk. SSSR, Vol.30, pp.301-305.
Kramer, C., 1970, “Studies on Flow Induced Mechanical Haemolysis”. Advisory Group for Aerospace Research and Development Conference Proceedings on Fluid Dynamics of Blood Circulation and Respiratory Flow - North Atlantic Treaty Organisation, Vol.65, Naples.
Pinotti, M., 2000, “Is There Correlation Between the Turbulent Eddies Size and Mechanical Hemolysis ?”. J. Braz. Soc. Mechanical Sciences, v.22, n.4, pp.565 – 569.
White, F.M., 1991. “Viscous Fluid Flow”. 2ed., New York: McGraw-Hill.