M
ASTER OF
S
CIENCE IN
F
INANCE
M
ASTERS
F
INAL
W
ORK
D
ISSERTATION
T
HE
D
ETERMINANTS OF
V
ALUE
A
DDED
T
AX
R
EVENUES IN
P
ORTUGAL
C
ARMEN
S
OFIA
F
ERNANDES DA
S
ILVA
M
ASTER OF
S
CIENCE IN
F
INANCE
M
ASTERS
F
INAL
W
ORK
D
ISSERTATION
T
HE
D
ETERMINANTS OF
V
ALUE
A
DDED
T
AX
R
EVENUES IN
P
ORTUGAL
C
ARMEN
S
OFIA
F
ERNANDES DA
S
ILVA
S
UPERVISOR:
P
ROFESSORD
OUTORJ
OAQUIMJ
OSÉM
IRANDAS
ARMENTOi
Abstract
Since VAT was first introduced, several authors have studied the determinants of VAT revenues in several countries, or group of countries, however Portugal has received little attention. The literature on the determinants of VAT revenues in Portugal is merely conceptual, with little empirical evidence. We therefore intend to study the determinants of VAT revenues in Portugal. This study is innovative, in the sense that it is probably the first study of the determinants of VAT revenues in Portugal and it contributes with additional insights to the study of VAT. Moreover, the results obtained can be useful for Portuguese policy makers as they help to understand how VAT revenues in Portugal can be optimized.
To perform this study, we collected monthly data on specific economic and tax variables from January 1998 to May 2015, and performed a time-series analysis through the use of regression models to estimate the determinants of VAT revenues. We developed two sets of regression models - one using the OLS method, and the other using the Prais-Winsten and Cochrane-Orcutt method. The results reveal that economic growth, consumption, the public deficit, and the level of the reduced and intermediate VAT rates all have a positive impact on VAT revenues, while unemployment has negative impact on VAT revenues.
JEL Classification: C22; H25; H26
Key Words: VAT determinants; VAT revenues; time-series analysis; regression
ii
Resumo
Desde que o IVA foi introduzido, vários autores têm estudado as determinantes da receita de IVA para vários países ou grupos de países, contudo pouca atenção tem sido dada a Portugal. A literatura referente às determinantes da receita de IVA em Portugal é meramente conceptual com pouca evidência empírica. Assim, pretendemos estudar as determinantes da receita de IVA em Portugal. Este estudo é inovador na medida em que é provavelmente o primeiro estudo empírico sobre as determinantes da receita de IVA em Portugal e contribui com conhecimentos adicionais para o estudo do IVA. Adicionalmente, os resultados obtidos podem ser úteis para os decisores políticos Portugueses na medida em que ajudam a compreender como a receita do IVA em Portugal pode ser optimizada.
De forma a efectuar este estudo, recolhemos dados mensais de variáveis económicas e fiscais específicas desde Janeiro de 1998 até Maio de 2015 e efetuámos análise de séries temporais através do uso de modelos de regressão para estimar as determinantes da receita de IVA. Desenvolvemos dois conjuntos de modelos de regressão, um usando o método dos Mínimos Quadrados (OLS) e outro usando o método de Prais-Winsten e Cochrane-Orcutt. Os resultados revelam que o crescimento económico, o consumo, o défice público e o nível das taxas reduzida e intermédia de IVA têm um impacto positivo na receita de IVA, enquanto o desemprego tem um impacto negativo na receita de IVA.
Classificação JEL: C22; H25; H26
Palavras-Chave: determinantes do IVA; receita de IVA; análise de séries temporais;
iii
Acknowledgments
I would have never done this dissertation if it were not for the help and support of some people. These people had an important role during the months I was working in this dissertation.
I would like to thank my supervisor, Professor Joaquim Sarmento, for his patience, guidance and help. I am very grateful for all he has done for me. I feel honored for having the opportunity of working with Professor Joaquim Sarmento. He is a great academic and also an exceptional person. More than a supervisor, he is a friend. I am thankful for all his insights and for all I have learned during this time.
I would also like to thank Professor Pierre Hoonhout for helping me with the econometrics of this dissertation. If it were not for his insights, I could have never untied the knots we had with our regression models.
Not less important is my family. I specially thank my mother, Helena, for all the values she though me that were necessary to walk this path and for all the support she gave me. Thank you! A special thanks to my sister, Vanda and to my brother in law, Tony for all their support and friendship. I also leave a special thanks to my aunts Marita and Saudade, my uncles Ramiro and Zé, my cousins Vera, Tó Manuel, Lena, Carlos, Pedro, Carolina, Marisa and Letícia. They always believed in me.
A special thanks is also addresses to Ana Jeanete Farinha, my thesis companion. Thanks for all the good times we spend together collecting data. If it were not for her, it would become boring.
I thank my great friend Anaísa Sena for all her friendship and support.
I thank to Sandra and Santiago Carreño, and Fernanda and Cleto Silva for all their patience and support and to all of the people from the amazing family God gave me.
There is a long list of people I would like to thank, but because I do not want to be unfair by forgetting someone, I will not write their name. I thank all those people from the bottom of my heart for all their support, friendship, help, patience and kindness.
iv
Table of Contents
Abstract ... i
Resumo ... ii
Acknowledgments ... iii
List of Tables ... v
List of Figures ... v
List of Abbreviations ... vi
1 Introduction ... 1
2 Literature Review ... 4
2.1 Concepts ... 4
2.2 Determinants of VAT Revenues ... 12
2.3 Studies ... 17
3 Methodology and data ... 21
3.1 Some Econometric Considerations ... 21
3.2 Dependent Variable ... 26
3.3 Explanatory Variables ... 27
3.4 Hypotheses ... 29
3.5 Regression Models ... 30
4 Results ... 31
4.1 The evolution of VAT revenues in Portugal ... 31
4.2 Analysis of the Results ... 32
5 Conclusions and Future Research ... 35
References ... 37
v
List of Tables
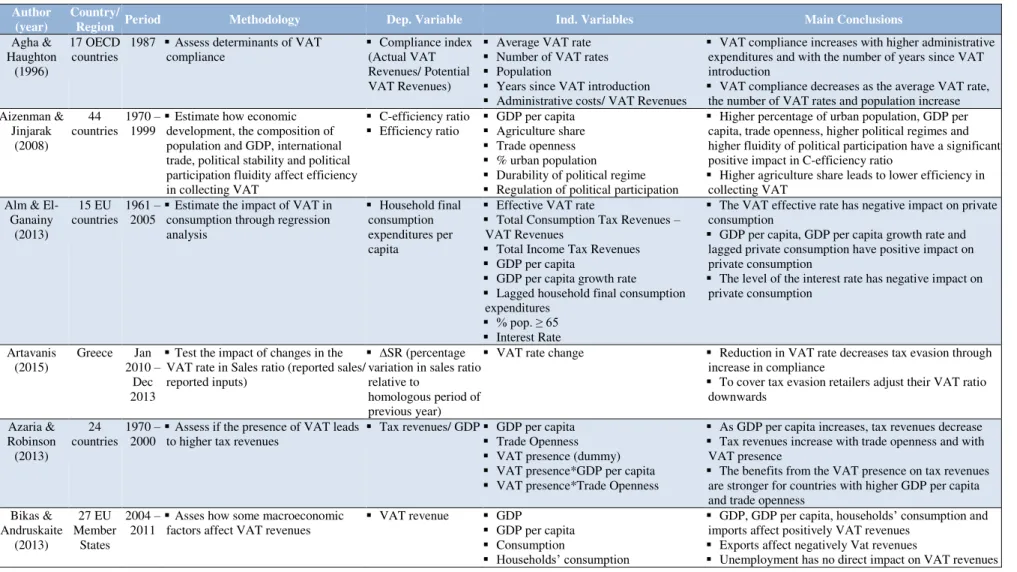
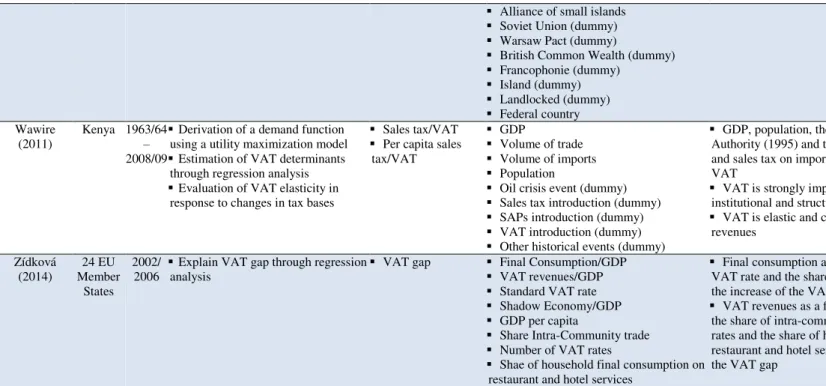
Table I - Literature Review Summary Table of Empirical Papers ... 40
Table II - Literature Review Summary Table of Conceptual Papers ... 45
Table III - Literature Review Summary Table of Independent Variables ... 46
Table IV - Hypotheses and Explanatory Variables ... 52
Table V - Table of Descriptive Statistics... 53
Table VI - Correlation Matrix ... 53
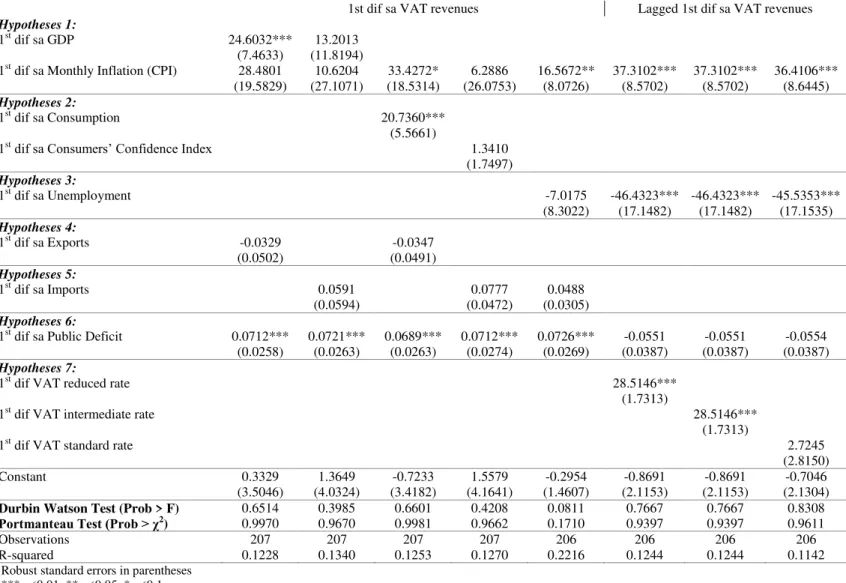
Table VII - Regression models using Ordinary Least Squares method ... 54
Table VIII - Regression models using Prais-Winsten and Cochrane-Orcutt method .... 55
List of Figures Figure 1 - Monthly VAT Revenues (in millions of Euros) ... 51
Figure 2 - Seasonally adjusted monthly VAT revenues (in millions of Euros) ... 51
Figure 3 - First difference of seasonally adjusted monthly VAT revenues (in millions of Euros) ... 51
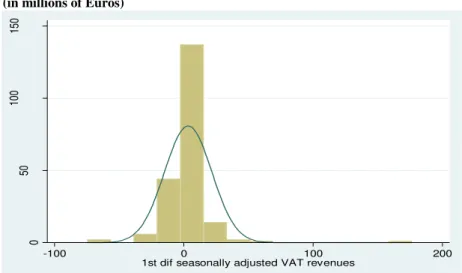
Figure 4 - Histogram of first difference of seasonally adjusted VAT Revenues (in millions of Euros) ... 51
vi
List of Abbreviations
ADF - Augmented Dickey-Fuller CPI – Consumer Price Index
DGO – Direção Geral do Orçamento EEC – European Economic Community EU – European Union
GDP – Gross Domestic Product IMF – International Monetary Fund INE – Instituto Nacional de Estatística IVA – Imposto sobre o Valor Acrescentado
OECD – Organization for Economic Co-operation and Development OLS – Ordinary Least Squares
PIT – Personal Income Tax
SAP – Structural Adjustment Program UK – United Kingdom
1
1 Introduction
Over the years, the number of countries adopting VAT has risen substantially, especially during the 1980s and the 1990s, with a huge spike in the number of countries adopting VAT after the dissolution of the Soviet Union (Ufier, 2014). The rate of adoption then decreased in the middle of the 2000s (Keen & Lockwood, 2010; Ufier, 2014). The introduction of VAT is considered to be the main tax reform for developing countries, and also the main tool for progress in tax policy and administration (Keen & Lockwood, 2010). In 2012, more than 150 countries had already introduced VAT (OECD, 2012). Through its history, only five countries withdraw VAT after introducing it: Vietnam, Grenada, Ghana, Malta, and Belize and three of those (Ghana, Malta and Vietnam) have now re-introduced VAT (Ebrill et al, 2001).
VAT became the most important source of revenue for government budgets (Bikas & Rashkauskas, 2011). Keen & Lockwood (2006) and Keen (2007) find a positive relationship between VAT revenues and total tax revenues. Countries introducing VAT experience increases in their tax ratios, that is to say, tax revenues as a fraction of Gross Domestic Product (GDP) (Keen & Lockwood, 2006; Nellor, 1987). Furthermore, the tax ratio does not decrease later on, but instead, it persists at higher levels (Nellor, 1987). Azaria & Robinson (2005) and Keen & Lockwood (2010) found that the presence of VAT has a positive and significant impact on total tax revenues.
In recent years, the increase of the percentage of the elderly population has revealed the need for pension and healthcare plans and, as a result, many countries are creating, or increasing their social programs. Consequently, governments’ need for revenues has increased (Bikas & Andruskaite, 2013; Bikas & Rashkauskas, 2011;
Lindholm, 1970; Maček, 2011; Ufier, 2014). To face this higher revenue need, many countries adopted VAT to take advantage of its revenue-enhancing capabilities.
2
the improvement of VAT collection by implementing measures to increase compliance, fighting fraud and evasion. Such measures include the increase of the quality of auditing and the increase of penalties due to noncompliance (Le, 2003; Lejeune, 2010; Lindholm, 1970). However, Jenkins & Kuo (2000) mention that in some countries, mainly due to tax evasion and ineffective tax administration in developing countries, the actual VAT revenues collected are far below the potential revenues that could be collected with an effective system.
VAT is also considered to be a revenue stabilizer (Ebeke & Ehrhart, 2011; Lindholm, 1970). Firstly, VAT is collected in all stages of the production chain and therefore a break or a failure to pay VAT in one of the stages of the chain will not affect the revenue collected, as that revenue will be secured by the other stages. Secondly, the increase in VAT revenues has been accompanied by the reduction in revenues from tariffs that result from trade liberalization. Because VAT is a consumption tax, and as consumption is assumed to be more stable than exports or imports, more stability is expected (Ebeke & Ehrhart, 2011). Ebeke & Ehrhart (2011) show that the presence of VAT leads to around 40% to 50% less instability in tax revenues.
Tax harmonization has for a long time been one of the major objectives of the European Union (EU) concerning Fiscal Policy. One of the requirements to be an EU Member State is to have a VAT system (Ufier, 2014). The first regulations on VAT appeared in 1970, with the First and Second Derivatives from the European Economic Community (EEC). Later, in 1977, the Sixth Derivative introduced the first steps towards the harmonization of VAT among State Members of the EU (Bikas & Andruskaite, 2013; Cnossen, 2003). Currently, most EU countries have standard VAT rates between 19% and 23%. On average, the 27 Member States of the EU have a VAT rate of 21.4%. The weight of VAT in the economy makes it one of the most relevant taxes. On average, VAT revenues account for 7.1% of GDP, and for 22% of total tax revenues for the 27 Member States (Sarmento & Alvarez, 2015).
In Portugal, VAT, which is known as “IVA – Imposto sobre o Valor Acrescentado”, was introduced in 1986 and its importance as a source of revenues has
3
being 23% in 2014 (Sarmento & Alvarez, 2015). Currently, in 2016, the standard VAT rate remains at 23%. During its history, the Portuguese standard VAT rate has only decreased once from 21% to 20%, in July 2008. In 2010 the standard VAT rate went back up to 21%.
Portuguese VAT revenues as a fraction of GDP increased from 7.6% in 1998 to 8.4% in 2012. However, from 2007 to 2009, VAT revenues as a fraction of GDP experienced a sharp decrease of 1.3%, being 7.1% in 2009. This result can be explained by the decrease of 13% in the VAT revenues that resulted from an abrupt fall in consumption and in the reduction of the standard VAT rate by 1% (Sarmento & Alvarez, 2015).
There are several empirical studies regarding the determinants of VAT, but none of them focusses on Portuguese VAT revenues particularly. In this dissertation, we intend to empirically determine the main economic and tax factors that influence VAT revenues. More specifically, we will estimate the determinants of VAT revenues in Portugal. Knowing the main determinants of VAT revenues can be helpful to policy makers in the sense that they can optimize the collection of VAT revenues through adjustment of economic and fiscal policies that have a direct impact on the determinants of VAT revenues. This way, increased VAT revenues can be achieved, not only by adjusting directly the fiscal policy on VAT, but also through the adjustment of other variables that have a direct impact on VAT. Moreover, this study contributes to the scientific community by adding some more insights on this subject.
To perform our study, we collected monthly data on several specific economic and tax variables from January 1998 through to May 2015. Then we built several regression models to estimate the impact of our explanatory variables on the collection of VAT revenues. We performed two sets of regressions, one using a simple Ordinary Least Squares method, and the other using the Prais-Winsten and Cochrane-Orcutt method. The results show that economic growth, consumption, the public deficit, and the level of the reduced and intermediate VAT rates all have a positive impact on VAT revenues, while unemployment has a negative impact on VAT revenues. Exports, imports and the standard VAT rate do not influence VAT revenues.
4
and imports to have no significant impact on VAT revenues. Even more surprising was the fact that we found the standard VAT rate to be statistically insignificant in explaining VAT revenues. This has some major implications regarding the regulation of fiscal policy. These results imply that adjusting the fiscal policy on VAT may not be very effective for increasing VAT revenues. Our results demonstrate that modeling other economic variables such as GDP, inflation, consumption, and unemployment may be more effective.
2 Literature Review
2.1 Concepts
Maurice Lauré was the first to put VAT in practice, implementing it in France in 1954 (Lejeune, 2010; Maček, 2011; Ufier, 2014).
VAT is essentially a consumption tax (Agha & Haughton, 1996; Godin & Hindriks, 2015). According to Bikas & Andruskaite (2013), VAT is “an indirect tax
levied on public and private consumption”. VAT is taxed when the product is sold by applying a percentage to the price (Lindholm, 1970). At each intermediate stage of production or distribution, the tax burden is transferred from sellers to buyers of the product until it reaches the final stage where products are sold to the final consumer. The final consumer is unable to claim tax credits and thus it is they who bear the tax burden (Bikas & Andruskaite, 2013; Godin & Hindriks, 2015; Jenkins & Kuo, 2000; Matthews, 2003). Producers pay VAT on the inputs used, however they are able to deduct VAT from their tax liability later on (Bikas & Andruskaite, 2013; Ebrill et al, 2001; Godin & Hindriks, 2015; Jenkins & Kuo, 2000; Lindholm, 1970). In the end, producers only pay tax on the actual value added during production (Desai & Hines, 2005; Jenkins & Kuo, 2000; Nellor, 1987).
5
claim a VAT credit later on (Keen & Smith, 2006; Le, 2003). Invoices can be used by the tax administration to check for fraud, by comparing reported inputs with reported sales, facilitating the auditing process (Agha & Haughton, 1996; Aizenman & Jinjarak, 2008; Le, 2003). In this sense, some authors suggest that VAT is somewhat “self
-enforcing” as it reduces the incentives for tax evasion (Agha & Haughton, 1996; Aizenman & Jinjarak, 2008; Keen & Smith, 2006; Matthews, 2003; Nellor, 1987). Nevertheless, this method still generates opportunities for fraud and evasion (Agha & Haughton, 1996; Keen & Smith, 2006; Le, 2003). Even so, VAT compliance is still higher when compared to the alternatives, allowing for higher revenues (Le, 2003).
VAT can be classified into three types: consumption VAT; income VAT, and; gross product VAT. For the consumption type, only goods and services incorporate the base, and investment and intermediate goods are excluded. The consumption type is typically preferred by most countries, as it can boost investment, generate economic growth and it simplifies the tax system. For the income type, intermediate goods and depreciation are excluded from the tax base and for the gross product type, all goods and services, including investment, are included in the tax base, with the exception of intermediate goods (Le, 2003; Lindholm, 1970).
Another important concept is the one of “exemption”. “Exemption” means that the seller does not charge VAT on the goods and services sold, and is not eligible to claim for a VAT refund for the inputs bought (Jenkins & Kuo, 2000; Keen &
Lockwood, 2006; Le, 2003; Maček, 2011; Nishiyama, 2012). Exemptions are much used in services such as education, healthcare, and financial services, as they are considered to be originators of positive externalities, and are services that are mainly consumed by people with lower levels of income (Le, 2003). Additionally, exemptions are seen as being a way to reduce the regressive character of VAT (Le, 2003; Lejeune, 2010).
Exempt goods and services create an extra cost for businesses, as the cost of VAT paid on inputs cannot be imposed on customers but producers are also unable to claim its refund. VAT paid on inputs becomes a cost, which creates distortions in
6
2010). Thus, exemptions are considered by many authors to be a large problem, as they break the VAT chain and create distortions (Bikas & Rashkauskas, 2011; Cnossen, 2003; Crossley et al, 2009; Le, 2003; Nishiyama, 2012).
Exports are usually subject to a zero rate of VAT, meaning that the seller does not charge VAT on sales, but is able to deduct the VAT paid on inputs (Jenkins & Kuo,
2000; Keen & Lockwood, 2006; Le, 2003; Maček, 2011). Many countries use the
“destination principle”, under which goods and services are taxed at the place they are consumed, and not where they are produced or shipped. Translating into international trade, this means that exports are taxed at a zero rate VAT, and imports are taxed the same way as domestic goods (Agha & Haughton, 1996; Desai & Hines, 2005). Exporters are freed from the obligation of charging VAT, but are still eligible to claim for a refund regarding VAT paid on inputs (Le, 2003). If the zero-rate were to be applied at the final stage, then the final consumer would not pay VAT, and the tax revenues regarding the transaction would be lost (Jenkins & Kuo, 2000; Le, 2003).
Rate differentiation is very common among EU Member States. Some goods are taxed at higher or lower rates than others, given their characteristics. The common argument is that goods such as alcohol, petrol and foods with high levels of fat are considered to raise costs to society, namely through higher pollution and healthcare requirements, and therefore they should be taxed at higher rates (Crossley et al, 2009; Nishiyama, 2012). On the other hand, goods such as healthy foods and books may have positive effects on society and, therefore, should be taxed at lower rates, in order to stimulate their consumption (Bikas & Andruskaite, 2013; Crossley et al, 2009; Nishiyama, 2012). Additionally, lower rates also apply to some goods and services that are considered to be a necessity (Lejeune, 2010).
7
(Agha & Haughton, 1996; Cnossen, 2003; Lejeune, 2010). Le (2003) questions the main purpose of VAT, arguing that its implementation and design has the objective of raising revenues, and does not have equity issues as a primary concern. Keen (2007) notes that the regressive effect of VAT would be maintained under any other type of consumption tax. Progressivity is better achieved through a well design and effective income tax, or through social benefits (Ballard et al, 1987; Crossley et al, 2009; Le, 2003; Nishiyama, 2012).
The use of reduced rates, zero-rates, and exemptions is thus unadvised. Reducing the range of goods and services exempted or taxed with reduced or zero rates and broadening the VAT base is usually recommended (Agha & Haughton, 1996; Bogetić & Hassan, 1993; Cnossen, 2003; Crossley et al, 2009; Jenkins & Kuo, 2000; Lejeune, 2010; Nishiyama, 2012). Legeida & Sologoub (2003) show that increasing the VAT base by 1%, leads to an increase of 0.64% in VAT revenues in Ukraine. Additionally, reducing zero and reduced rates would eliminate some of the distortions created, including those affecting consumption and production choices (Crossley et al, 2009). The use of a single VAT rate is frequently recommended (Agha & Haughton, 1996; Bogetić & Hassan, 1993; Jenkins & Kuo, 2000; Lejeune, 2010; Nishiyama, 2012). Ballard et al (1987) find that the welfare gains from introducing a differentiated rate structure would be 25% to 40% smaller when compared to a single-rate VAT. Additionally, this should be followed by the modernization of the mechanisms to improve enforcement and compliance (Bogetić & Hassan, 1993; Jenkins & Kuo, 2000; Nishiyama, 2012).
In the EU, the VAT Directive 2006/112/EC establishes a minimum standard VAT rate of 15%, and allows no more than two reduced rates of at least 5%. A list of goods and services that can be exempt is also provided in this Directive (Bikas & Andruskaite, 2013; Maček, 2011; Mathis, 2004). However, many exceptions are
allowed for some Member States, which results in highly differentiated rate structures
across Member States (Maček, 2011; Mathis, 2004). Some countries have an excessive number of reduced rates, and some are even allowed to have rates below the maximum permitted of 5%, known as super reduced rates (Mathis, 2004).
8
standard VAT rate was only being applied to about 69% of the total taxable base, and that reduced rates were covering, on average, 23% of the taxable base, which is a large number. In Portugal, the percentage of the taxable base subject to the standard VAT rate was below the European average, being 63%, and 37% of the taxable base was being taxed with reduced rates. These results demonstrate that the application of reduced rates is not an exception, as it should be under the principles of the Sixth Directive, and that there is an excessive share of the taxable base subject to non-standard rates.
Another important issue is the level of revenues at which an individual or company is required to register as VAT payers - the threshold (Bikas & Rashkauskas, 2011; Le, 2003). In the EU, different Member States set different levels of thresholds (Bikas & Rashkauskas, 2011; Lejeune, 2010). In Portugal, Decreto-Lei nº 71/ 2013, de 30 de Maio establishes the Regime de Contabilidade de Caixa, under which VAT is
only demanded for companies with a turnover of less than € 500,000, that have their tax affairs in order, and which have been in operation for over a year (Marques & Sarmento, 2015).
Thresholds are intended to remove the tax burden from small business. Furthermore, tax administrations would need to have the capacity to be able to collect VAT from all these small businesses, and even if this was possible, the revenues collected would be only a small share of the total VAT revenues, with the costs of collection being probably higher than the actual collection itself (Bikas & Rashkauskas, 2011; Le, 2003). However, most countries allow voluntary registration of small businesses with a turnover that is below the threshold level (Lejeune, 2010; Le, 2003). By allowing voluntary registration, there is the risk of a large number of small businesses to registering voluntarily, and this annuls the effect for which the threshold was designed, thus annulling its purpose (Le, 2003). Lejeune (2010) argues a common threshold for all Member States would be more efficient. Nishiyama (2012) argues against the use of thresholds, claiming that the different threshold levels applied in each country generate distortions in competition between countries.
9
order to reduce VAT liability, which is common when several VAT rates exist; 4) not declaring VAT on goods consumed by the owner or their employees; 5) collection of VAT, but this is not remitted to the tax authorities; 6) false claims for a credit or refund; and, 7) claiming VAT on non-creditable purchases, which usually happens when traders buy goods or services for their own personal use and then claim VAT credit on those goods or services as if they were inputs (Agha & Haughton, 1996; Keen & Smith, 2006; Nishiyama, 2012).
It happens very frequently that traders do not deliver the VAT to the tax authorities. In Portugal, the 2nd Article, No.1 of the Regime Geral das Infracções Tributárias states that the failure to deliver a tax that was not previously received
cannot be considered a culpable fact (“facto culposo”). Thus, such traders are not considered responsible for not delivering what was not paid, but they are only accountable when there is proof that the failure to deliver the tax to the State was fraudulent and wrongful, that is to say, if the individual that received the tax does not deliver it to the State. Otherwise, retailers cannot be accused of the crime of fiscal abuse provided for in the 205th Article of the Código Penal (Marques & Sarmento, 2015).
In 1993, the EU abolished the commercial barriers between Member States (Godin & Hindriks, 2015; Keen & Smith, 2006; Sarmento & Santos, 2013) and, in the face of that decision, the EEC imposed a VAT regime in 1991, known as the Regime do IVA nas Transações Intracomunitárias (RITI) (so named in Portugal), which establishes
the rules for taxing VAT on transactions between Member States (Sarmento & Santos, 2013).
The abolishment of controls on these transactions led to the appearance of a specific type of fraud - the carousel fraud (Keen & Smith, 2006; Sarmento & Santos, 2013). In Portugal, the Tribunal Central Administrativo Sul defined in the Acordão de 22 de Abril de 2012 (proc. nº 05523/12) a situation of “carousel fraud”, as being one
10
Basically, in this type of fraud, a company A, located in country A, exports goods to a company B (missing trader) in country B. As exports are zero-rated, no VAT is paid by the exporting company, A. The importing company, B, then sells the goods to company C, which is also located in country B, charging VAT on the operation, but the fails to deliver the charged VAT to the tax authorities, disappearing in the meantime. Company C then re-sells the goods back to company A, or to other companies that serve as buffers to cover the scheme, with the objective of reaching company A, and then asks for the refund of the VAT paid to the tax authorities when buying the goods. The goods reach company A, and the cycle is then repeated, creating a “carousel” (Keen & Smith,
2006; Sarmento & Santos, 2013).
Missing traders (in this example, company B) usually sell their products at prices below market price, in order to make sure that they sell the products and take benefit from their fraudulent activity (Keen & Smith, 2006; Sarmento & Santos, 2013).
Sarmento & Santos (2013) argue that carousel fraud has three main impacts: 1) the reduction of VAT revenues; 2) the legitimacy of those commercial sectors where carousel fraud is more common, and; 3) the distortion caused in market competition by fraudulent companies selling their products at lower prices, with the intention of practicing fraud.
Proposals to reduce the tax evasion problem pass through simple administrative actions, such as strengthening supervision on registration, making sure that companies register when reaching the threshold level, and also by creating rules under which traders are liable and responsible for the fraud that happens elsewhere along the production and distribution chain until the final consumer (Keen & Smith, 2006; Sarmento & Santos, 2013). Sarmento & Santos (2013) suggest that, given the weight VAT has in most countries as a major source of revenues, the harmonization of VAT procedures between Member States is essential to fight fraud. Member States should cooperate with each other, improving the capacity of their tax administrations.
Other proposals go deeper and require a redesign of the VAT system. These include: “reverse charging”, where the buyer bears the VAT liability, instead of the seller; “reverse withholding”, where the seller is liable for the VAT charged on the output, but it is the buyer that remits the VAT to the tax authorities, and; “VAT
11
deposited, and; a “third party guarantee” where the VAT payment would be guaranteed by a third party (Keen, 2007; Keen & Smith, 2006; Nishiyama, 2012; Sarmento & Santos, 2013).
To attenuate fraud and evasion resulting from international trade, Poddar &
Hutton (2001) propose the “P-VAT”, Versano (2000) proposes the “CVAT”, and Keen
& Smith (1996, 2000) propose the “VIVAT”. Under the “P-VAT”, goods would only leave customs after the tax authorities have confirmed that the VAT on the import has been paid. Under the “CVAT” proposal, exports would be zero-rated, but the importing country would have the right to a totally creditable VAT compensation. Under the
“VIVAT” proposal, all business-to-business transactions (domestic and cross-country) of participating countries would be subject to a common single VAT rate, and the rate to be applied to the sales to the final consumer would be selected by each country (Keen, 2007; Keen & Smith, 2006; Nishiyama, 2012).
Currently, one of the tools used by the EU to increase enforcement and compliance is the attribution of an identification number for each taxable person. This control system, named the VAT Information Exchange Service (VIES), allows for a better control of intra-community trade and a better monitoring by tax administrations. Additionally, this system allows taxpayers to gather information about their business partners (Nishiyama, 2012).
Considering the wide list of arguments against VAT, one would question why countries still choose VAT over other options for consumption taxation. The choice of VAT as the main indirect tax is based on the argument that VAT is the type of tax that creates fewer distortions when compared to others (Matthews, 2003). In many countries, the main purpose of VAT was to replace other types of consumption tax that have some unpleasant characteristics, such as turnover tax, which created a “cascading
12
2.2 Determinants of VAT Revenues
Bogetić & Hassan (1993) argue that although many countries have similar VAT rates, their revenue performance is different. This difference is explained by the rate structure adopted by each country, by the extension of the tax base, and by the capacity of the tax administration. Keen & Lockwood (2010) also note that the VAT design differs from country to country, not only regarding their rates, but also their base type, level of zero-rates and exemptions, and in the timing of refunds.
According to Keen (2013) VAT revenues as a percentage of GDP can be decomposed into three drivers: standard VAT rate; C-efficiency ratio, and; consumption as a percentage of GDP. For high-income countries over the 1996 to 2000 period, Keen (2013) estimated that when the standard VAT rate increased on average by 1%, then the C-efficiency ratio increased, on average, by 2.6% and consumption as a fraction of GDP decreased, on average, by about 0.6%, which results in a VAT revenue increase of 3%. These results show that the major driver of VAT revenues was the changes in the C-efficiency ratio.
Among the most studied determinants are those concerning the design of the VAT system, namely, the standard VAT rate and reduced rates. A positive relationship between the VAT rate and VAT revenues is usually found (Bikas & Rashkauskas, 2011; Bogetić & Hassan, 1993; Engel et al, 2001; Matthews & Lloyd-Williams, 2000; Pagán et al, 2001). Ebrill et al (2001) find the same positive relationship between the VAT rate and VAT revenues as a fraction of private consumption. Pagán et al (2001) found the opposite relationship to also be true, whereby increases in VAT revenues lead to increases in the standard VAT rate, which, according to Pagán et al (2001), means that governments might adjust VAT rates when expected revenues are not sufficient to cover the expected fiscal needs.
13
where further increases to the VAT rate will increase non-compliance, leading to lower levels of VAT revenues. They estimated this rate to be 20%. Matthews (2003) estimates the revenue-maximizing VAT rate to be between 18% and 19.3%.
Kaczyńska (2015) notes that, although the standard VAT rate in Poland was increased from 22% to 23% in 2011 in the face of the financial crisis, VAT revenues actually decreased. The efficiency rate also decreased from 2010 to 2013, reflecting a decrease in the effectiveness of the tax administration in collecting VAT revenues. Tagkalakis (2014) also notes that since measures of the the Economic Adjustment Programme were implemented in Greece, VAT revenues have decreased, even after the increase in the standard VAT rate. He advances the idea that such decreases in VAT revenues can be due to shifts in consumption towards necessity goods (those with lower VAT rate) and due to worse tax compliance, which is a common occurrence during recessions. Sarmento & Alvarez (2015) note that countries that received an intervention from the “Troika”, such as Portugal, are those with the highest increases in the standard VAT rate, which reveals that countries increase their VAT rates in an attempt to reduce their deficits. In fact, the International Monetary Fund (IMF) (2014) reveals that most of those EU countries that increased their VAT rates in the face of the subprime financial crisis did not experience higher VAT revenues, but instead a decrease in VAT revenues that resulted from a reduction in collection effectiveness.
Artavanis (2015) demonstrates that a decrease in the Greek VAT rate during an economic crisis can generate benefits that largely compensate the fiscal costs. Firstly, retailers increase compliance and reduce under-reporting and the decrease in VAT revenues is compensated by an increase in sales revenues. Secondly, this can have a positive effect in the industry through an increase in competitiveness.
14
The number of years since VAT introduction also has a positive impact on the ratio of VAT revenues to private consumption, demonstrating that as the years since the introduction of VAT pass, the higher experience and knowledge of the tax administration contributes to an increase in compliance, which translates into higher efficiency and a better administration of the tax. Furthermore, as time passes, it is expected that people become more comprehensive and understand and accept VAT more easily (Ebrill et al, 2001; Bikas & Andruskaite, 2013).
Economic variables were also tested as main determinants of VAT revenues. Bikas & Andruskaite (2013), Kaczyńska (2015) and Wawire (2011) find a positive relationship between GDP and VAT revenues. Bikas & Andruskaite (2013) also find that GDP per capita is also positively associated with VAT revenues. On the other hand, Azaria & Robinson’s (2005) results show that as GDP per capita increases, tax revenues tend to decrease.
Regarding efficiency, a positive relationship between GDP growth rate and VAT revenue efficiency was found. However, when an economy is in recession, efficiency tends to be lower (Tagkalakis, 2014). GDP per capita has a positive impact on the C-efficiency ratio, which is a measure of VAT revenue C-efficiency, defined as being the ratio between VAT revenues to consumption and the standard VAT rate (Aizenman & Jinjarak, 2008). A contrary relationship is given by the share of agriculture of the economy that is negatively related with the C-efficiency ratio (Aizenman & Jinjarak, 2008). These results together imply a strong dependence of VAT revenues on the economic cycle, that is to say, on economic circumstances (Kaczyńska, 2015).
15
Bikas & Andruskaite (2013) found a positive relationship between imports and VAT revenues, but on the other hand, they found a negative relationship between exports and VAT revenues. Aizenman & Jinjarak’s (2008) results reveal the existence of a positive relationship between trade openness and the C-efficiency ratio. Wawire (2011) claims that the positive relationship between international trade and VAT revenues implies that VAT revenues can be increased through the expansion of international trade.
Bikas & Rashkauskas (2011) find that as unemployment increases, VAT revenues decrease substantially. As individuals purchase goods and services with their salary, unemployment decreases the purchasing power of individuals, leading to a reduction of consumption, and, ultimately, to a reduction in VAT revenues. A different perspective is given by Bikas & Andruskaite (2013), who suggest that unemployment has no direct effect on VAT revenues, but that it indirectly negatively affects VAT revenues through its direct negative effect on the available income of families and, consequently, on their consumption. Their results show a positive relationship between
households’ consumption and VAT revenues.
Inflation is positively related with VAT revenues and with the VAT rate, that is to say, higher inflation leads to higher VAT revenues and a higher VAT rate, meaning that VAT rates are adjusted in the face of inflation, in order that the government can achieve the necessary revenues to meet their projected expenditures (Pagán et al, 2001).
The increase in the share of VAT revenues as a fraction of GDP is accompanied by an increase in the complexity of the administration of VAT. Moreover, as complexity increases, corruption and the share of black economy also increases. In fact, both the share of the black economy and the level of corruption (measured by the Corruption Perception Index) are negatively related to VAT efficiency ratio (Sokolovska & Sokolovskyi, 2015).
16
import and export tariffs with VAT can cause substantial reductions in welfare for countries with a large informal sector, which is very concerning, and jeopardizes the validity of VAT as being the best option for a consumption tax in those countries. Keen (2007) argues that developing countries, which are usually the ones with larger informal sectors, might be better off by using tariffs, rather than VAT.
Zídková (2014) suggests that the VAT gap, which is the difference between potential VAT revenues and the VAT revenues actually collected, is a good proxy for tax evasion, and he finds that final consumption as a fraction of GDP, the standard VAT rate, and the percentage of the black economy all contribute to the increase of the VAT gap. On the other hand, VAT revenues as a percentage of GDP, GDP per capita, intra-community trade, the number of VAT rates, and the share of consumption of households regarding restaurant and hotel services all contribute to the decrease of the VAT gap.
Tagkalakis (2014) shows that improving the tax administration’s ability to fight tax evasion would increase efficiency. Engel et al (2001) find that an increase of 1 dollar with Internal Revenue Service expenditures would lead to an increase in VAT revenues of 31.2 dollars in Chile, and Agha & Haughton (1996) find that an increase of 1 dollar with administrative expenditures is expected to raise VAT revenues by 12% for a set of 17 OECD countries. It is thus possible to conclude that an increase in expenditures on enforcement would reduce tax evasion, and thus increase VAT revenues.
Political factors also affect VAT revenues. Aizenman & Jinjarak (2008) argue that current governments, as policy makers, can select a tax system design that might
jeopardize efficiency during future governments’ appointments. Their results reveal that political stability has a positive effect on the C-efficiency ratio. A higher probability for the current government to be reappointed will generate a more efficient tax system, as policy makers will maintain the investment aimed to increase tax capacity and to reduce tax evasion.
17
government spending. Keen & Lockwood (2006) found no evidence that the adoption of VAT leads to increases in government size. Ufier (2014) finds that those countries adopting VAT experience lower levels of government spending.
Some demographic elements were also found to be important determinants of VAT revenues. Wawire (2011) finds that the size of the population has a positive impact on VAT revenues, and Aizenman & Jinjarak (2008) show that the percentage of urban population is associated with a higher C-efficiency ratio, which is expected, as it is more difficult to collect taxes in rural areas. A control of population is suggested, as this would have an impact on VAT revenues (Wawire, 2011).
Illiteracy also plays a role in determining tax revenues, but its sign is negative, meaning that countries with higher levels of illiteracy tend to collect less VAT revenues as a fraction of private consumption (Ebrill et al, 2001).
Some asymmetric shocks, such as the 1973 oil crisis, and participation in a war also have a considerable negative impact on VAT revenues and on the adoption of VAT
(Čížek et al, 2012; Wawire, 2011).
One would question why different authors achieve different results when studying the relationship between the same variables. It is important to note that these results were achieved through studies for different countries, or groups of countries, developed for different time periods, and use different methodologies. Table I, Table II and Table III in the Appendixes present full details regarding the region, period and methodology used in each study as well as the main results obtained. Table I presents the results of empirical studies, Table II presents conceptual studies, and Table III presents the conclusions achieved for each independent variable allowing for a better comparison between similar and opposite conclusions regarding the same variable. Theoretical studies were excluded from the tables as their main ideas are presented in the Literature Review.
2.3 Studies
18
OECD countries, the United States of America (USA) is the only one that did not adopt VAT, claiming that it does “too good of a job” in raising revenues (Ebrill et al, 2001; Keen, 2007; Keen & Lockwood, 2006).
Keen & Lockwood (2006) show the VAT is a “money machine”, as countries with VAT are able to generate more revenues than those without VAT. However, not all studies are in accordance with this conclusion. Ebrill et al (2001) find no evidence that the presence of VAT leads to higher tax revenues.
Regarding the determinants of VAT adoption, Čížek et al (2012) find a negative
relationship between GDP per capita and VAT introduction, which means that poor countries are more likely to adopt VAT than rich countries. He suggests this result is a consequence of the recent VAT spread pattern, as more recent adopters are located mainly in Africa. Agriculture share and rents from natural resources both have a significant negative impact on the probability of the adoption of VAT (Čížek et al, 2012; Keen & Lockwood, 2010; Ufier, 2014). Countries governed as federations tend to have a reduced probability of adopting VAT (Čížek et al, 2012; Ufier, 2014), which, according to Ufier (2014), is due to the fact that they have decentralized tax collection systems. Trade openness also has a negative impact on VAT adoption probability
(Čížek et al, 2012; Keen & Lockwood, 2010). Čížek et al (2012) find that countries with low tax revenues have a higher probability of adopting VAT, which reflects their beliefs in VAT being a powerful revenue generator.
On the other hand, participating in an IMF programme designed for recovery from a financial crisis is positively associated with VAT adoption, which means that those countries that participated in the IMF programme for crisis resolution appear to be more willing to adopt VAT, which reflects the importance of the IMF in the spread of
VAT (Čížek et al, 2012; Keen & Lockwood, 2010; Ufier, 2014). Furthermore, if a country in a region adopts VAT, then the probability of countries in the same region adopting VAT increases as well (Čížek et al, 2012; Keen & Lockwood, 2010).
Countries with a large population, as well as countries with a large share of elder population, are more likely to adopt VAT. This comes from the need for higher revenues which are required to finance social programmes (Čížek et al, 2012; Ufier,
19
countries, it is harder to collect tax from imports, given the higher number of possible entry locations, and VAT can help increase efficiency in doing so (Ufier, 2014).
Finally, Francophone countries adopted VAT earlier, when compared to other countries. On the contrary, small islands and former members of the Warsaw Pact are less likely to adopt VAT (Ufier, 2014).
Interesting results are also obtained by studies that look at the consequences of VAT adoption. Desai & Hines (2005) show that the presence of VAT has a negative impact on openness and on exports. Furthermore, higher reliance on VAT (higher ratio of VAT revenues to total tax revenues), leads to smaller levels of trade openness and smaller levels of exports. All these relationships become stronger for low-income countries. Desai & Hines (2005) suggest some possible factors to justify these results. Firstly, VAT falls more heavily on traded sectors of the economy, and in this way it is natural that VAT affects international trade. Furthermore, the use of VAT to replace other types of tax that can impact on trade can be a cause. Additionally, governments are not always efficient in providing exports deductions.
The reaction of inflation to the presence of VAT was also tested. According to Le (2003), countries that adopted VAT did not experience higher inflation. He believes that by generating more revenues, VAT may help governments to adjust monetary policy in such a way that prices decrease, instead of increasing. In this sense, VAT may actually be deflationary, instead of inflationary. However, the timing of the introduction of VAT has to be right. Introducing VAT during a time when inflation is increasing may lead to the perception that VAT is inflationary, which makes VAT harder to accept by people. Ufier (2014) shows that those countries adopting VAT experience lower inflation. On the other hand, investment tends to be higher for countries that adopt VAT, when compared to those that did not (Ufier, 2014).
20
Alm & El-Ganainy (2013) find a negative relationship between the effective VAT rate and private consumption. Gábriel & Reiff (2006) study the impact of the increase in the middle VAT rate from 12% to 15% in January 2004 in Hungary, and the decrease in the upper VAT rate from 25% to 20% in January 2006. The results show that prices increased more than what they should have done with the VAT increase. These results show that not only did retailers pass the full VAT increase to final consumers, but that they also seized the opportunity to raise prices and increase their profit margin. Additionally, the price of products for which the VAT remained at the same level also increased, especially products considered to be close substitutes of those where the VAT rate increase was applied, and products that incorporate both VAT subject and non-VAT subject products. On the other hand, the decrease of the upper VAT rate led to a decrease in prices, but the VAT relief was not fully transferred to final consumers, that is to say, the decrease in prices was smaller than that which it should have been if prices had incorporated the VAT decrease to its full extent. Once again, retailers took advantage of a VAT change to increase their profit margins.
Blundell (2009) and Crossley et al (2009) study how the 2008 temporary VAT cut in the United Kingdom (UK) from 17.5% to 15% during 13 months affected consumer demand, and how much of the VAT reduction would be passed on to final consumers. Blundell (2009) estimates that around 75% of the VAT cut would be transferred to final consumers in the form of lower prices. As prices are reduced in the face of a VAT cut, consumers are expected to maintain their level of expenditures, thus increasing demand in quantity. To maintain the expenditure level, the increase in demand will be proportional to the decrease in prices. On the other hand, Crossley et al (2009) estimate that a 2.5% decrease in the VAT rate would lead to a 1.2% decrease in prices, which would result in an increase in purchases of the same magnitude. Consumers who are not financially constrained would take advantage of the lower prices to buy goods and services that are not considered to be necessity goods, more specifically, durable goods. For financially-constrained consumers, lower prices would encourage them to buy a greater quantity of goods and services in proportion to the decrease in prices.
21
affect compliance and evasion. As the average VAT rate increases, compliance becomes lower. The introduction of an additional VAT rate is expected to decrease compliance. On the other hand, as the number of years since VAT introduction increases, compliance also increases. Each additional year of experience is estimated to increase compliance by 1% (Agha & Haughton, 1996).
3 Methodology and data
In this dissertation, the objective is to answer the question “What are the main determinants of VAT revenues in Portugal?” We intend to estimate the variables that have a potential impact on the collection of VAT revenues. We have collected data on economic and tax variables from several sources (“Banco de Portugal”, “Direção-Geral
do Orçamento”, “Instituto Nacional de Estatística”, and the European Commission (2015)). Monthly data was collected for the period starting in January 1998, up until May 2015, with a total of 209 months.
3.1 Some Econometric Considerations
Econometrically speaking, we collected data on several time series. As we are working with time series, it is important to have some notes in mind before we introduce our variables. When carrying out an econometric analysis using time series, one needs to be careful about any trend, cycle, or seasonal component present in the time series that prevents the time series from being stationary. This subsection only addresses the theoretical background of our econometric model. Subsection 3.2 will detail how we have dealt with these issues practically, with regards to our study and sample.
As we are working with monthly data, we expect to find a strong seasonal component in our time series. Seasonality exists when there is the presence of regular and predictable movements in the time series during the time period. More specifically, there is seasonality when it is possible to predict when the series will increase or decrease based on its passed behaviour, as it always has that same behaviour at that time
22
series have a strong seasonal component will not allow us to understand the real relationship between variables, as seasonality interferes by hiding the time series’ long term behavior. Thus, the first step is to seasonally adjust all the time series to ensure that seasonality will not interfere with the econometric analysis. In our case, we adjusted seasonality by applying a moving average filter. Later, in Subsection 3.2, we present further details on how seasonality was adjusted.
After adjusting for seasonality, we are left with the real pattern of the time series during time, without the fluctuations that repeat every year. When working with economic data, it is common that after removing seasonality we are left with a trend. However, when performing regression analysis between two or more time series with a trend, it is expected that they would show a positive or a negative relationship, even if they are independent from each other. This is known as a spurious regression problem, that is to say, two uncorrelated variables may be given as positively or negatively correlated by a regression model. In order to avoid spurious regressions, it is necessary to ensure that all the time series in the model are stationary.
A stationary time series is one where the mean, the variance, and the autocorrelation of the variable time series are constant over time, that is to say, a process 𝑋1, 𝑋2, … , 𝑋𝑇 is stationary if:
𝐸(𝑋𝑡) = 𝜇 < ∞, ∀𝑡 (1)
𝑉𝑎𝑟(𝑋𝑡) = 𝐸[(𝑋𝑡− 𝜇)2] = 𝛾0< ∞, ∀𝑡 (2)
𝐶𝑜𝑣(𝑋𝑡, 𝑋𝑡−𝑘) = 𝐸[(𝑋𝑡− 𝜇)(𝑋𝑡−𝑘− 𝜇)] = 𝛾𝑘< ∞, ∀𝑡 (3)
Applying the Ordinary Least Squares method when using non-stationary time series will lead to regression outputs with high R-squares and highly statistically significant variables, however the estimators will be inconsistent, and the standard values of any statistical test such as a t-test or an F-test will not be correct.
23
𝑋𝑡 = ∅0+ ∅1𝑋𝑡−1+ ⋯ + ∅𝑝𝑋𝑡−𝑝+ 𝜀𝑡 (4)
where p is the number of lags of Xt. Then Xt has a unit root if x = 1 is a solution to the
equation of the autoregressive polynomial:
∅(𝑋) = 1 − ∅1𝑋 − ⋯ − ∅𝑝𝑋𝑝= 0 (5)
The Augmented Dickey-Fuller (ADF) test can be used to test for the presence of a unit root and to verify if a time series is stationary, or non-stationary. Furthermore, the ADF test allows us to understand how to transform the time series in order to make it stationary. In the test, we can include only an intercept, or an intercept and a trend. The decision on what to include in the test is based on the economic reasoning behind the time series. As most economic indicators tend to continually grow over time, an upward trend is expected. Visual inspection of the time series plot can confirm the existence of a trend. The presence of an upward or downward trend implies the inclusion of a trend in the test. If there is no trend, then only the intercept should be included. If we include an intercept and a trend, then the equation estimated by the test is:
𝑋𝑡= 𝛽0+ 𝛽1𝑡 + 𝜋 𝑋𝑡−1+𝛿1𝑋𝑡−1+ ⋯ + 𝛿𝑝−1𝑋𝑡−𝑝+1+ 𝜀𝑡 (6)
If we only include an intercept, then the estimated equation will be:
𝑋𝑡 = 𝛽0+ 𝜋 𝑋𝑡−1+𝛿1𝑋𝑡−1+ ⋯ + 𝛿𝑝−1𝑋𝑡−𝑝+1+ 𝜀𝑡 (7)
where 𝜋 = ∅1+ ⋯ + ∅𝑝− 1 and 𝛿1, … , 𝛿1 are parameters that do not depend on ∅1+ ⋯ +
∅𝑝.
Mathematically, the test is the following:
{𝐻𝐻0: 𝜋 = 0 <=> 𝑋𝑡~𝐼(1)
1: 𝜋 < 0 <=> 𝑋𝑡~𝐼(0) (8)
The test statistics is: 𝑡𝜋̂ =𝜎̂(𝜋̂)𝜋̂ , being 𝜎̂ the standard error.
The Augmented Dickey-Fuller test can result in three different conclusions, depending on the type of test applied. The time series can be stationary, difference-stationary, or trend-stationary.
Test including only the intercept: The non-rejection of the null hypothesis
24
∆𝑋𝑡 = 𝑋𝑡− 𝑋𝑡−1 (9)
The rejection of the null hypothesis indicates that there are no unit roots, and therefore the time series is already stationary and no transformations are needed.
The test includes intercept and trend: If the test includes a trend, not rejecting
the null hypothesis means there is a unit root, and that the time series is difference-stationary. Once again, stationarity can be achieved by taking the first-difference, as in equation 9. Rejecting the null hypothesis indicates the absence of a unit root. If it does not have unit roots, then the time series is trend-stationary, and we should de-trend it, that is to say, remove the trend, in order to make it stationary. The de-trended time series will be the series of the residuals of a regression between the trend-stationary time series and the time variable t.
If the necessary transformations are not correctly applied to each of the time series when developing a regression model, there is a high probability that the model will reveal the presence of autocorrelation, that is to say, the error terms will probably be correlated. This violates a necessary assumption of the Gauss-Markov Theorem that the disturbance terms must be uncorrelated. Mathematically, no autocorrelation means:
cov(εt, εt−s|X) = 0 , s = 1,2, … , T − 1. (10)
Autocorrelation, or serial correlation, is a typical problem when using time series, and this happens because the order in which data is presented is relevant. Autocorrelation means that the errors in a given moment are positively or negatively correlated with the errors in other moments, whether in the past or in the future. Because the error terms are correlated, a necessary assumption of the Ordinary Least Squares (OLS) method is violated, and the Gauss Markov Theorem stating that the OLS is the best unbiased estimator in a linear regression with uncorrelated errors does not hold. In the face of serial correlation, the OLS estimator will provide estimators with large variance, meaning that the OLS estimator is not efficient. Moreover, the test statistics of the t and F-tests will not be valid. Thus, it is necessary to correct all the time
25
The most well-known statistical tool to test for autocorrelation is the Durbin-Watson test. The Durbin-Durbin-Watson tests if the error terms are independent from each other. Formally, the Durbin-Watson tests the following hypothesis:
𝐻0: 𝜌 = 0
𝐻1: 𝜌 > 0 (11)
The Durbin-Watson test uses the following test statistic:
𝑑 =∑ (𝑒𝑛𝑖=2∑𝑖− 𝑒𝑖−1)2 𝑒𝑖2 𝑛 𝑖=1
(12)
where 𝑒𝑖 = 𝑦𝑖 − 𝑦̂𝑖 which is the difference between the actual observed value and the value predicted by the model and corresponds to the residuals. After calculating the test statistics, one needs to compare the test statistic with the Upper and Lower bounds, dU
and dL, given by the Durbin-Watson table for the respective values of k and n, where k
is the number of explanatory variables and n is the number of observations in the
sample. The conclusion about serial correlation is made through the following rule:
If d < dL we reject the null hypothesis and conclude there is autocorrelation;
If d > dU we do not reject the null hypothesis and conclude there is no autocorrelation;
If dL < d < dU we cannot conclude about the presence of autocorrelation.
As the test statistic follows an F-distribution, one can also conclude about autocorrelation by analyzing the p-value given by the test. For a 5% confidence level, if the p-value is smaller than 0.05, we reject the null hypothesis and there is autocorrelation. If the p-value is higher than 0.05, we do not reject the null hypothesis, and there is no autocorrelation.
As we are working with time series, more important than ensuring no autocorrelation is ensuring that the residuals of the regression are white-noise, or, in other words, ensuring that the process has zero-mean, constant variance, and that the correlation between residuals is always zero over time. Ensuring that the residuals follow a white-noise process guarantees that the estimated parameters of the model are efficient. Mathematically, the error terms follow a white-noise process if:
𝐸(𝜀𝑡) = 0, ∀𝑡 (13)
𝑉𝑎𝑟(𝜀𝑡) = 𝜎2, ∀𝑡 (14)
26
One can test if the residuals follow a white-noise process by running the
Box-Ljung “portmanteau” test, also known as Q test. We will be testing the following: {𝐻𝐻0: 𝑐𝑜𝑟𝑟(𝜀̂𝑡, 𝜀̂𝑡−𝑘) = 0
1: 𝑐𝑜𝑟𝑟(𝜀̂𝑡, 𝜀̂𝑡−𝑘) ≠ 0 , 𝑘 = 1,2, … (16)
Under the null hypothesis, the test statistic is:
𝑄 = 𝑛(𝑛 + 2) ∑𝑛 − 𝑘 ~𝜒𝑟̂𝑘2 𝑚2 𝑚
𝑘=1
(17)
where 𝑟̂𝑘 is the sample autocorrelation at lag k:
𝑟̂𝑘 =∑ 𝑢̂𝑡𝑢̂𝑡−𝑘 𝑛
𝑡=𝑘+1
∑𝑛𝑡=1𝑢̂𝑡2
(18)
As the Q converges to a chi-square distribution of order m, at a 5% confidence
level, we reject the null hypothesis if the p-value is smaller than 0.05, and conclude that the residuals are not white-noise, and we do not reject the null hypothesis if the p-value is higher than 0.05 and conclude the residuals are white-noise.
3.2 Dependent Variable
Since we intend to estimate the determinants of VAT revenues, it is straightforward to think of the VAT revenues in millions of Euros as the main candidate for the dependent variable.
VAT revenues (in millions of euros): are the total monthly revenues collected
from the tax on the value added of goods and services in Portugal. It is one of the most important sources of revenues. In 2012, the total VAT revenues accounted for 8.4% of GDP.
In Figure 1, we show the monthly VAT revenues in millions of Euros from January 1998 through May 2015. It is possible to observe that the variable has a strong seasonal component, meaning that we first need to seasonally adjust it. As a way to seasonally adjust the time series variable, we applied a simple moving average smoother. When applying this method, data is transformed so that the adjusted values will be the simple unweighted average (the mean) of the past n observations. In our
27
𝑋̂𝑡 =12 ∑ 𝑋1 𝑡−𝑖 12
𝑖=0
=𝑋𝑡+ 𝑋𝑡−112+ ⋯ + 𝑋𝑡−12 (19)
The seasonally adjusted time series plot is shown in Figure 2. Now it is clear that monthly VAT revenues have been increasing over time. This behaviour was impossible to observe when using the time series with the seasonal component. However, the trend means that our variable is not stationary and therefore using this variable to perform regression analysis would originate a spurious regression problem. After running the Dickey-Fuller test on the seasonally adjusted variable, we conclude that the variable is difference-stationary, and therefore we took the first-difference, in order to make it stationary. After taking the first-difference of the seasonally adjusted variable we obtain the time series presented in Figure 3.
Now we finally have a stationary variable and the Gauss-Markov Theorem can be applied when using this variable in the regression model. In this way, our dependent variable is the first-difference of the seasonally adjusted monthly VAT revenues (in
millions of euros).
Figure 4 presents the histogram of this variable, where one can see that it is normally distributed.
One may ask why we did not use other options as dependent variables, such as the logarithm of the VAT revenues. The reason is because most of our explanatory variables contain a large number of observations with negative values. This makes it impossible to take the logarithm of these variables, as most observations would be lost. Because we are not able to apply logarithms to our explanatory variables, we decided not to take the logarithm of the dependent variable as a manner of consistency.
3.3 Explanatory Variables
________________________________________ 1. Índice Coincidente de Actividade Económica 2. Índice de Preços no Consumidor
3. Índice Coincidente do Consumo Privado
28
GDP growth is the growth rate of the Gross Domestic Product, and it was used
as a measure of economic growth. Given the unavailability of monthly data on GDP, the
index of economic activity1 from Banco de Portugal was used as a proxy for GDP. Monthly Inflation is given by the Consumer Price Index2, and is an indicator of
the evolution of the price level of all goods and services in a given economy. We collected data on this variable from Instituto Nacional de Estatística.
Consumption is the general level of expenditures made by private entities. As no
data on monthly consumption was available, the index of private consumption3 from Banco de Portugal was used as a proxy for private consumption.
The Consumers’ Confidence Index is a measure of optimism regarding the economic and financial situation of the economy and personal financial situation. Data
on the Consumers’ Confidence Index can be found in the database from Banco de Portugal.
Unemployment measures the percentage of the active population that is
searching for a job, but has still not found one. Information on this variable can be found at Instituto Nacional de Estatística.
Exports are the share of all internally produced goods and services that are sold
to another country. In Portugal, exports are exempt from VAT. Data on this variable was collected from Banco de Portugal.
Imports are the share of goods and services produced in another country, but
finally consumed in national territory. Unlike exports, imports are subject to VAT. We collected data on this variable from Banco de Portugal.
Public deficit (in cash) is a measure of how much government expenditures
exceed government revenues. This information is available in the monthly reports from
Direção Geral do Orçamento.
Standard, Intermediate and Reduced VAT rates are the three different VAT rates