Supported by the Portuguese Science and Technology Foundation (FCT) (Projects No. UID/CVT/00772/2013 and No. UID/CVT/00772/2016). G. Paixão holds a PhD grant from the Animal Science Doctoral Program (AniSci), operation number NORTE-08-5369-FSE-000040, co-funded by the European Social Fund and the Regional Opera-tional Programme Norte 2020.
Demographic Structure and Genetic Diversity
of the Endangered Bísaro Pig: Evolution and Current Status
Gustavo Paixão
1*, Alexandra Esteves
1, Rita Payan-Carreira
1, Nuno Carolino
21Animal and Veterinary Research Centre, University of Trás-os-Montes and Alto Douro, Vila Real, Portugal
2National Institute of Agrarian and Veterinarian Research, Research Unit of Biotechnology and Genetic Resources, Vale de Santarém, Portugal
*Corresponding author: [email protected]
ABSTRACT
Paixão G., Esteves A., Payan-Carreira R., Carolino N. (2018): Demographic structure and genetic diversity of the endangered Bísaro pig: Evolution and current status. Czech J. Anim. Sci., 63, 452–461.
Bísaro pig, a local endangered swine breed, has gained popularity in the recent years. A complete pedigree was used to evaluate the population structure and investigate the current breed’s genetic variability in two reference populations (AlivePop and AliveBpop). Since the breed’s foundation, the number of registered animals, producers, and farrowing records has increased. The mean progeny size for sires was 116.17 ± 210.81, and 3.24% of the breed-ing boars originated 26.54% of all registered births showbreed-ing a marked unbalanced use of certain sires. The mean calculated equivalent generations was 4.54, and 98.1% of all the animals had known parents, indicating a good degree of pedigree completion and depth. Approximately half of the individuals were inbred, with average inbreed-ing values of 10.41, 9.02, and 8.58% for the whole and reference populations, respectively. Considerinbreed-ing both reference populations, a low effective founder/ancestor ratio was obtained (1.12), showing a well-balanced founder/ancestor contribution, and subsequent genetic transfer. However, the effective founder/founder ratio was particularly low (0.06 and 0.12) compared with other native breeds. The founder genome/effective founder ratios were 0.37 and 0.41 for AlivePop and AliveBpop. Contrarily to the whole population, the random genetic drift weighted significantly more than the drift due to unequal founder contribution in the reference populations. The effective population size based on the increase in coancestry ranged from 62.39 and 54.66, and 16.74 and 24.84 based on the increase of individual inbreeding, for the whole and reference populations. The genetic conservation index steadily grew over the years with a mean value of 6.53 for the whole pedigree. Genetic variability losses and diffuse structuring might have occurred in the Bísaro population. Notwithstanding, the recent genetic variability indicators seem positive, yet supported by an open herdbook policy. These characteristics must be taken into account to define future mating policies and selection programs.
Keywords: conservation; genetic variation; inbreeding; pedigree analysis; swine
Sustainable use of genetic resources, in adaptive breeding and conservational programs, depends on good management of genetic diversity (Uimari
and Tapio 2011). Bísaro pig (BP) is an autochtho-nous Portuguese breed descending from the Celtic line (Gama et al. 2013), famous for its high valued
453 smoked-cured products. BP farms are concentrated
in the north of Portugal and are divided between smallholders using traditional systems and me-dium scale free-range farms (Paixao et al. 2018). Following the industrialization of the pork sector, Bísaro numbers have been drastically reduced to almost extinction until the mid-90’s decade, due to the lowered value of animal fats and the introduc-tion of more efficient exotic breeds (Santos Silva and Tirapicos Nunes 2013). In 1994, the breed was classified endangered of extinction by the Portuguese Ministry of Agriculture, Forest and Rural Development, followed by FAO placing BP in the critically endangered category (Sherf 2000). The National Bísaro Pig Producer Association (ANCSUB) has managed the animal registrations, later designated as a herdbook, which has been maintained open to new animal registrations, with unknown progenitors, since. More recently, we have witnessed an increase in demand for Bísaro certified smoked-cured products, and the popula-tion has been thriving since then. At the end of 2017, the herdbook had 6818 breeding females and 682 boars registered in a total of 215 farms.
Regardless of these recent events, a clear breed differentiation has been demonstrated, but opinion regarding genetic variability differs amongst the scientific community. Vicente et al. (2008) believe high variability still exists whereas Ramos et al. (2003) demonstrated low to moderate variability. Consensually, it is believed that inbreeding had happened to a certain degree (Carolino et al. 2007). Although these studies have been conducted using molecular methodologies, the pedigree analysis is the easiest and most economical way to assess genetic diversity and demographic parameters of a population over generations (Oliveira et al. 2016).
In small livestock populations suffering from drastic population reduction, the occurrence of inbreeding is unavoidable and a consequence of the biparental relatedness. Inbreeding leads to increased homozygosity, which often results in reduced individual and maternal performance (inbreeding depression), and decreased population viability (Silio et al. 2013). In these circumstances, the knowledge of the inbreeding coefficient be-comes a priority for local endangered breeds. It is also imperative to investigate the occurrence of possible changes in genetic variability distribu-tion. These changes are inherent to the selective process that may have happened at the producer’s
level. Selection can additionally create an unbal-anced ratio between the number of females and males available for reproduction, which is often considered an important factor for genetic vari-ability loss (Barros et al. 2017). The demographic structure analysis will then explain changes that might have happened in the genetic history of a given population.
This study intends to assess the evolution and current demographic structure, and the genetic diversity of the endangered BP population. This assessment is necessary to design an effective genetic improvement programme and adjust the current conservational program, in a joint breed-ing strategy. A question arises if any conservation programme is compatible with an efficient breed-ing programme necessary to improve production traits and profitability, and indirectly guarantee the breed’s future.
MATERIAL AND METHODS
The Bísaro pedigree data was available from ANCSUB. Data was validated for individual iden-tification, date of birth, and sex consistency. In-dividual records were checked for duplicates and filiation completeness. After editing, the database file included pedigree records from 219 701 ani-mals born from January 1994 to September 2017. Several demographic and genetic parameters were computed by Endog v4.8 (Gutierrez and Goyache 2005), based on the concept of identity by descent. These parameters were calculated for the whole pedigree (n = 219 701) and for reference populations AliveBpop (n = 4336) and AlivePop (n = 81 951), defined as alive individuals at the moment of analysis used for breeding or not. Ad-ditional demographic parameters were obtained with the statistical analysis software JMP Ver-sion 7.0 (SAS Institute Inc., 2007).
The average age of parents at the birth of their offspring and generation intervals were defined as the average age of parents at the birth of all their progeny or the one that is kept for reproduction, respectively. Both parameters were calculated on the four parent−offspring pathways using the birth dates registered in the herdbook.
The degree of pedigree completeness was cal-culated by the equivalent complete number of generations, which is defined by the number of
generations separating the individual from its fur-thest ancestor and percentage of known progeny, up to the 3rd parental generation, by period of time.
Individual inbreeding coefficient (Fi) is the prob-ability that an individual has two genes identical by descent (Wright 1931). The average relatedness coefficient (AR) of each individual is defined as the probability that an allele randomly chosen from the whole population in the pedigree belongs to a given animal. It can be interpreted as the rep-resentation of the animal in the whole pedigree regardless of the knowledge of its pedigree, and it was estimated according to Gutierrez and Goy-ache (2005). These notions are closely related to the concept of genetic contributions described by James and Macbride (1958), the same as param-eters such as the effective number of founders (fe) and non-founders (nfe) and founder genome equivalents (fg), which are related between them by the expression 1/2fg =1/2fe +1/2nfe, according to Caballero and Toro (2000). The effective num-ber of ancestors (fa) was also obtained from the marginal contributions as proposed by Boichard et al. (1997). While fe quantifies the founder con-tribution to the base population, fg reflects the gene diversity due to founders in the current population. The difference between them estimates the gene diversity gathered by non-founder individuals in the current population. These parameters were used to measure the amount of gene diversity accounting for loss due to genetic drift and unequal founder contribution (GD), as well as for loss due to unequal
founder contribution only (GD*) (Lacy 1995). The difference between GD and GD* estimates the loss of gene diversity by the random genetic drift ac-cumulated over non-founders generations.
Effective population sizes (Ne) were calculated based on individual rate of inbreeding (ΔFi) (Guti-errez et al. 2009) and based on paired increase in coancestry (ΔCij) (Cervantes et al. 2011).
The genetic conservation index (GCI) was es-timated following Alderson’s (1992) procedure, and computed from the genetic contributions of all the identified founders as
GCI = 1/Σpi2
where:
p2 i= proportion of genes of founder in the pedigree of an
animal. RESULTS
Demographic analysis. The number of registered
animals and producers increased from 64 and 27 in 1994, to 23 946 and 129 in 2016, with an average annual increase of 51.21 and 9.51%, respectively (Figure 1). The farrowing records had followed a similar trend. They grew from 37 to 3891, regis-tering a 29.90% mean annual rise.
The ratio of breeding females per male, with a registered litter in the last year, increased over the years and stabilised at around eight sows per boar. The mean progeny size, defined as the number of
Figure 1. Number of registered animals, farrowings, and active producers in herdbook Sheet1 175 200 30 ls a nd 125 150 20 d an ima l x1000) N um 100 125 egistere d w ings (x m ber of p 50 75 10 m ber of r e fa rro w roducer s 25 50 N um s 0 0 1994 1996 1998 2000 2002 2004 2006 2008 2010 2012 2014 2016 1 1 1 2 2 2 2 2 2 2 2 2
Animal registrations Farrowings Producers
Page 1
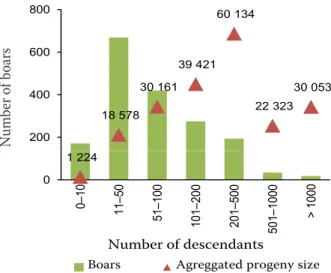
455 descendants per lifetime, was 19.18 ± 15.40 for
dams and 116.17 ± 210.81 for sires. Nevertheless, the majority of boars only had between 11 to
50 de-scendants with a limited contribution of 8.98% of total births registered (Figure 2). Contrarily, 3.24% of all breeding boars, representing animals with more than 501 descendants, originated 26.54% of all registered births. This small group of animals had genetically contributed close to 69.63% of all boars, which had 100 or fewer descendants.
On average, boars are bred at 1.15 ± 0.63 years of age and kept for 2.17 ± 1.24 years, having 15 ± Figure 2. Distribution of boars per number of descendants,
and aggregated progeny size per category
18 578 30 161 39 421 60 134 22 323 30 053 20000 30000 40000 50000 60000 70000 200 400 600 800 Nu m be r o f b oa rs 1 224 0 10000 0 0– 10 11 –5 0 51 –1 00 10 1– 20 0 20 1– 50 0 501 –10 00 > 100 0 Number of descendants
Boars Agreggated progeny size
Table 1. Generation intervals and average age of parents at the birth of their offspring, computed for each par-ent–offspring pathway for the whole Bísaro population
Generation intervals Average age
n years n years Sire–son 1 544 1.72 92 229 2.17 Sire–daughter 9 058 1.90 123 157 2.24 Dam–son 1 553 1.80 92 247 2.20 Dam–daughter 9 161 1.97 123 320 2.24 Average 1.91 2.22
Table 2. Main genealogical parameters for the whole Bísaro and reference populations
Parameter Whole pedigree AlivePop AliveBpop
Population size 219 701 81 951 4 346
Number of founders 4 323 2 331 1 274
Number of ancestors 2 526 2 316 1 253
Equivalent complete generations 4.54 5.00 4.38
Average inbreeding coefficient (Fi) 10.48% 9.04% 8.58%
Average relatedness (AR) 1.60% 1.44% 1.45%
Average individual rate of inbreeding (ΔFi) 2.99% 2.31% 2.01%
Proportion of inbred animals 54.26% 54.01% 47.49%
Average inbreeding coefficient per inbred animals (Fi) 19.32% 16.74% 18.06%
Effective number of founders (fe) 118 148 151
Effective number of ancestors (fa) 113 132 135
Founder genome equivalent (fg) 62 55 62
Effective number of non-founders (nfe) 127 87 105
Effective founders per founder (fe/f) 0.02 0.06 0.12
Effective founder per effective ancestor (fe/fa) 1.04 1.12 1.12 Founder genome per effective founder (fg/fe) 0.53 0.37 0.41 Gene diversity accounting for loss of diversity (GD) 99.20% 99.08% 99.19% Gene diversity accounting for loss of diversity
for unequal contributions of founders only (GD*) 99.58% 99.66% 99.67%
Effective population size (NeCjk)1 62.39 54.66 62.08
Realized effective population size (NeFi)2 16.74 21.64 24.84
Mean genetic conservation index (GCI) 6.53 7.48 6.63
1calculated based on paired increase in coancestry (ΔC
ij)
2calculated based on individual increase in inbreeding (ΔF
456
27 litters. Differently, gilts are 1.41 ± 0.71 years old at first farrowing, and are held for 2.34 ± 1.33 years, having 2.56 ± 2.03 litters in their lifetime. The generation intervals for the whole pedigree, de-fined as the average age of parents at the birth of their progeny kept for reproduction or not, were 1.91 ± 1.06 and 2.22 ± 1.21 years, respectively. These values were higher for the set of reference populations (2.21 ± 1.19 and 2.43 ± 1.22, respec-tively generation intervals and average age). The four pathway results for the generation intervals and average ages were equitable; generation in-tervals varied from 1.72 to 1.97 and average ages from 2.17 to 2.24 (Table 1).
Genetic diversity analysis. The main parameters
that characterise the Bísaro genetic variability are given in Table 2. Considering the whole population, the percentages of known ancestors per genealogi-cal position in the first three parental generations (fathers, grandfathers, and grand grandfathers) were 98.1, 77.9, and 61.8%, respectively. Analysis of the pedigree completeness over time showed no major differences other than a mild increase in known parents from the first period consid-ered (1995–1999). In fact, the knowledge of the progenitors up to the third line, in the reference populations, is very similar to the whole popula-tion (data not shown). Contrarily, evaluapopula-tion of the pedigree depth over time revealed a marked increase in equivalent complete generations since
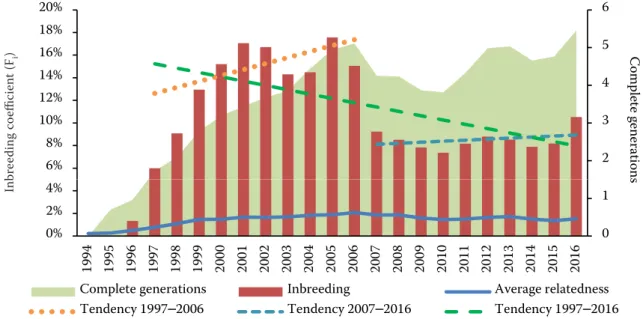
the establishing of the herdbook, back in 1994, till 2006. After that period, values stabilise close to the average number of discrete generation equiva-lents for the whole population (4.54) (Figure 3). Although the number of generations in reference populations was within the same range, AlivePop registered a considerable higher (5.00) number than AliveBpop (4.38).
Figure 4 shows the evolution of inbred animals and their average inbreeding coefficient in the whole population, since the breed’s foundation. No inbred births were recorded during the first two years after the establishment of the herdbook. However, since 1996, an accentuated increase of inbred animals was registered. The percentage of inbred animals reached its maximum value in 2006 (69%). Considering inbred animals only, the average Fi followed a similar rising pattern from 1996 to 2005, with levels up to 28%, stabilizing at levels close to 17% after that period. Moreover, matings between siblings, half-siblings, parents, and offspring represented 5.01, 13.21, and 4.26%, respectively. In sum, pairing between close rela-tives represented 22.48% of all matings.
A similar model was found considering the in-dividual computed Fi values over the years. Levels rose and stayed high till 2005–2006, when a sud-den drop was registered; then maintained close to the current Fi levels (8–10%) (Figure 3). Ten-year tendency lines showed a positive rate of
inbreed-Figure 3. Evolution of average inbreeding values (Fi), average relatedness (AR), and equivalent complete generations (per year). Inbreeding rates (tendency lines) in different considered periods
Sheet1 2 3 4 5 6 6% 8% 10% 12% 14% 16% 18% 20% Co m ple te g en era tio ns br eedi ng c oeficient ( Fi ) 0 1 0% 2% 4% 19 94 19 95 19 96 19 97 19 98 19 99 20 00 20 01 20 02 20 03 20 04 20 05 20 06 20 07 20 08 20 09 20 10 20 11 20 12 20 13 20 14 20 15 20 16 s In b
Complete generations Inbreeding Average relatedness
Tendency 1997–2006 Tendency 2007–2016 Tendency 1997–2016
Inbr ee ding co effic ien t (F i )
457 ing between 1997–2006 (y = 0.0055x – 10.953;
P < 0.001) and between 2007–2016 (y = 0.0004x –
0.738; P < 0.001). However, when taking into con-sideration a 20-year period, a negative rate was observed (y = –0.0041 + 8.386; P < 0.001). AR slowly increased over the years, and the maximum value of 2.11% was found in animals born in 2006. Beyond this point, values tended to stabilise near the average value of 1.6%.
Genetic contributions from ancestors and founders were similar. Notwithstanding, 50% of the genetic variability was determined by only 41 ancestors, and 75% could be explained by 151 ancestors. The genetic contributions from founders and ancestors ranged from 0.002 to 3.15%. The fe increased from the whole population to AliveBpop (from 118 to 151), whereas nfe presented its minimum value in AlivePop (87).
GD ranged from 99.08 to 99.20% while GD* reached 99.58–99.67%. Thus, the estimated loss of genetic diversity for the whole population due to unequal founder contribution and random genetic drift was 0.42 and 0.38%, respectively. Differently, for the reference populations AlivePop and AliveBpop, drift due to unequal founder contribution ranged from 0.34 to 0.33%, respectively; whereas due to random genetic drift it accounted for 0.58 and 0.47%.
The mean calculated GCI for the whole pedigree was 6.63 ± 5.05. For the reference populations AlivePop and AliveBpop the equivalent values were 7.48 ± 5.93 and 6.63 ± 5.96, respectively. The maximum value referred to a litter born in 2015 (31.88). The annual mean GCI registered an overall increase from 1994 (1.00) up to 2016 (8.40).
DISCUSSION
Preserving local endangered breeds might con-tribute significantly to the species’ biodiversity (Laval et al. 2000). Conservation of these rare animal genetic resources implies counteracting the decline of the population size. Certified products can be a good strategy to achieve better market prices, encouraging producers to increase animal and production numbers. BP is no exception, and now holds multiple products with standardised quality such as Protected Designation of Origin (PDO) and Protected Geographical Indication (PGI). This fact can explain the steady growing tendency of producers and breeding animals over the last few years.
The unbalanced use of animals for reproduc-tion is considered one of the main causes for loss of genetic diversity (Pinheiro et al. 2013). This phenomenon has happened in the BP since the herdbook establishment. Considering all the reg-istered animals, only 6% (13 093) had produced offspring, and 1854 (2%) of all registered boars had progeny. Discrepancies continue when we consider the number of descents per breeding animal; of all breeding boars, only 276 with larger progeny could have explained more than 57% of all genetic variety passed through breeding. Although sire selection is important in genetic improvement programs, moderation is needed to maintain a reasonably large genetic pool. This is especially important in small populations where selection and breeding goals are inconsistent. In Figure 4. Evolution of percentage of inbred animals and average inbreeding values (Fi) for inbred animals only (per year)
10% 15% 20% 25% 30% 40% 60% 80% 100% In bred in g c oeff ici en t In br ed ani m al s 0% 5% 0% 20% 19 94 19 95 19 96 19 97 19 98 19 99 20 00 20 01 20 02 20 03 20 04 20 05 20 06 20 07 20 08 20 09 20 10 20 11 20 12 20 13 20 14 20 15 20 16 (F i)
Inbred animals Non-inbred animals Inbreeding
Inbr ee ding co effic ien t (F i)
these populations, like the BP, male renewal and re-circulation must be prioritised. Contrastingly, productive longevities of animals used for breed-ing seem to be well balanced but generally short among males and females. Even though, boars are being used earlier and kept for shorter periods.
The generation interval for the whole population of 1.91 years was in line with the Alentejano pig breed (2.17) (Mendes 2013), the Gochu Asturcelta pig (1.80) (Menendez et al. 2016), and previous studies in commercial breeds in the USA (Welsh et al. 2010) with 1.65, 2.06, 1.83, 2.21, and 1.92 for Berkshire, Hampshire, Landrace, Yorkshire, and Duroc; however, it was considerably lower compared with the Iberian pig (2.45) (Toro et al. 2000), the Malhado de Alcobaça (2.6) (Carolino et al. 2008), and the Bunte Bentheimer (3.07) (Bier-mann et al. 2014). The evolution of this parameter to 2.17 years for the set of reference populations indicates that generation intervals are becoming longer, which is preferable for conservational pur-poses. Furthermore, our results showed negligible differences between sexes, supporting the idea of equivalent productive longevities.
Genetic assessment studies based on genealo-gies are key tools for conservational purposes, yet they heavily rely on good pedigree complete-ness and integrity. Therefore, the analysis tends to be more precise when the average number of maximum, complete, and equivalent generations is high. The same applies to the degree of com-pleteness of pedigrees, which has a significant influence on the quality of the genetic diversity analysis (Cervantes et al. 2011). In this study, the average calculated equivalent generations for the whole pedigree were 4.54, and 98.1% of all animals had known parents; these values indicate good pedigree completeness and depth, strengthening the subsequent demographic and genetic analysis. As should be expected, the number of equivalent complete generations was higher for the AlivePop (5.00). Surprisingly, for the equivalent breeding population (AliveBpop) the value was considerably lower (4.38). The introduction of new breeding animals might have influenced the average known generations, confirming the breeders association policy.
Considering the whole BP population, the aver-age Fi (10.48%) was found higher than in the other two Portuguese pig breeds: Alentejano (2.27%) in a 7-year study period (Mendes 2013), and
Mal-hado de Alcobaça (9.03%) (Carolino et al. 2008), and also higher than in commercial breeds used in the USA (3.2–7.8%) (Welsh et al. 2010), in the Czech Republic (1.3–3.6%) (Krupa et al. 2015) or in China (< 1.3%) (Tang et al. 2013). This value was only exceeded in the small population of Go-chu Asturcelta pig (23%) (Menendez et al. 2016). Notwithstanding, for the reference populations considered in this study, the average Fi was con-siderably lower (9.02 and 8.58%, respectively for AlivePop and AliveBpop). This value represents the current inbreeding and suggests the issue may have been managed over the last few years. However, a closer analysis of the Fi evolution over time (Figure 3) shows a peculiar trend: the nega-tive overall rate of inbreeding registered since the breed’s foundation is in fact precipitated by a significant drop in 2006, preceded and succeeded by two periods of increasing Fi. Curiously, the same pattern is registered in other parameters: in 2006, the number of equivalent known generations inverts an increasing trajectory (Figure 3), decreas-ing its average number until 2010. This situation might have been originated by two events. Firstly, the proportion of individuals registered without known parents increased from 2004 to 2006. It re-versed a decreasing tendency observed since 2000, after the first years of establishing the herdbook. Secondly, the number of all animal registrations in 2007 and 2008 almost doubled comparing to the two previous years. Most of these animals, with unknown progenitors, were intended to be bred. Therefore, their progeny could have been in the origin of the marked inbreeding decrease in the subsequent years. Although no change in mating policy was made by ANCSUB, these events have deeply marked the population structure, and have been affecting the following generations.
Despite the favourable evolution of the inbreed-ing coefficient, slightly over half of the whole and reference populations are inbred (54.26 and 53.68%). These acquired proportions are not sur-prisingly high, given the still elevated mean in-breeding values. Thus, it also confirms that inbred animals have particularly high values of inbreed-ing, which is supported by the high frequency of matings between close relatives.
The concept of Ne is a useful estimator of the inbreeding state in a determined population, usu-ally defined under a regular system (Cervantes et al. 2016). As described previously, the Bísaro
459 population suffered a cleavage between 2006 and
2007. In these cases, where the population might have been structured, the calculation of Ne should be based on the paired increase of coancestry (NeCjk) (Cervantes et al. 2011; Leroy et al. 2013). The effec-tive population size based on individual increase in inbreeding (NeFi) considers all historical pedigree information, and thus is affected by possible popula-tion structures. Nonetheless, computapopula-tion through both methods is useful because they can provide different information, and the comparison between both values can inform on the degree of population structuring (Cervantes et al. 2011). In this study, the NeCij for the reference populations were 54.66 and 62.08 in AlivePop and AliveBpop, respectively. Dif-ferently, the NeFi ranged from 21.64 and 24.84 for AlivePop and AliveBpop, respectively. While the first estimates stood above the international rec-ommendations by FAO, which is 50 to maintaining genetic variability in conservation and breeding programmes, the individual inbreeding-based values were considerably below. The difference between both calculated population sizes is considerable, and the NeCjk/NeFi ratio significantly differs from one which would be expected in an ideal popula-tion. This fact suggests diffuse structuring within the population that might have been originated by preferred matings.
Despite the difference between both estimates, ef-fective population sizes were low in the BP. Although a low Ne does not yet seem to affect the selection potential of widely used breeds, other effects related to the spread of inherited disorders or a reduction in fitness are associated with inbreeding depression. Nonetheless, it is important to remember that Ne depends on the genetic structure of a determined breed, on the pedigree information available and the period considered. It may also vary according to the method used in its calculation and thus should not be overestimated (Leroy et al. 2013).
The ultimate objective of genetic management is the preservation of genetic variety of the population from which founders were drawn. Therefore, the effective number of founders (fe) should be equal to the effective number of ancestors (fa), meaning that all founder animals continue to pass their genes onto future generations ensuring the continuity of genetic origin and diversity. In the present study, low fe/fa ratios were obtained (1.04 and 1.12), imply-ing a well-balanced founder/ancestor contribution, and subsequent genetic transfer from generation to
generation. This surprising value suggests that no abusive use of certain individuals was carried out, contradicting the previous demographic analysis. In spite of this positive figure, the effective number of founders and ancestors and, more importantly, the fe/f ratio, were particularly low when compared to the other native Iberian breeds – Alentejana (Mendes 2013), Malhado de Alcobaça (Carolino et al. 2008), and Gochu Asturcelta (Menendez et al. 2016), and to commercial breeds used in China (Tang et al. 2013), the Czech Republic (Krupa et al. 2015) or Canada (Melka and Schenkel 2010). The large difference between the effective number of founders and the actual founders (fe/f) suggests that much of initial genetic variability was lost, picturing a dramatic bot-tleneck of the breed after the foundation. After that period, and due to the breeders association policy, the effective number of founders (fe) increased in the contemporaneous reference populations while the founder genome equivalent (fg) declines. This strategy of maintaining the herdbook open since the breed’s foundation explains the counterbalanced parameters. Furthermore, the number of founders accounting for 50% of the population genes was 43, meaning that fairly 0.02% of all registered animals accounted for half of the population genetic diversity. This might have also accounted for the high inbreeding caused by the abusive use of certain founders through their descendants.
The importance of the genetic drift can be esti-mated by the fg/fe ratio. For the whole population, this value (0.53) was higher than that for Bunte Bentheimer (0.35) (Biermann et al. 2014) but lower than that for Gochu Asturcelta (0.67) (Menen-dez et al. 2016). Nonetheless, this ratio decreases in both reference populations to 0.37 and 0.41 (AlivePop and AliveBpop respectively), mainly due to the higher number of effective founders. Moreover, the estimated loss of genetic diversity for the whole population due to unequal founder contribution accounted relatively more than the random genetic drift. Contrarily, for the newer generations (AlivePop and AliveBpop), random genetic drift weighted significantly more than the drift due to unequal founder contribution.
The GCI is widely used in genetic conservation programmes and integrates a group of parameters used to evaluate intra-breed genetic diversity. The index reflects how well an individual received equal contributions from all the founder ancestors in the population (Alderson 1992). The mean calculated
GCI, for the BP breed, was higher compared to the Alentejano pig breed (3.56) (Mendes 2013), and indicates the average animal has a mean con-tribution of 6.53 founders. However, individual GCI values showed a large variability (standard deviation (SD) = 5.05; range = 30.88), meaning that founder representation is not balanced. More importantly, the index steadily grew over the years and registered the highest rate in 2015, showing a crescent contribution from founders in contem-poraneous individuals. In fact, the mean GCI for the reference population was higher than for the whole pedigree, especially for AlivePop (7.48).
The analysis of inbreeding is often used to moni-tor the evolution of genetic diversity over time. Parameters based on probability of gene origin can retrieve more information about changes that might have occurred in the population. Notwithstanding, a joint analysis combining demographic informa-tion with the previous parameters is preferred. Comparison between reference populations is also worthwhile to better understand the population dynamics and to perspective the breed’s future.
Taken together, the parameters have identified several factors that may have contributed to the actual panorama. Inbreeding is still high, yet con-trolled, with an overall rate close to zero. Population size is low and close to the minimum recommended for conservation purposes. Despite the inexistence of a formal breeding policy, genetic transfer seems well balanced. Nevertheless, genetic variety losses through preferred matings were evidenced in several parameters. The overall evolution of estimated pa-rameters reinforces the idea of a diffuse population structuring. These features should be considered in future breeding strategies.
CONCLUSION
The estimated parameters indicate that BP population had suffered genetic variety losses since the breed foundation, yet supported by an open-herdbook policy. Nevertheless, recent demographic and genetic parameters indicate a positive evolution. Breeding and mating policies must be implemented in a common programme. This programme should contemplate the genetic progress of the most important traits and the maintenance of the genetic variability. All key parameters achieved in this study must be taken into account given the still elevated inbreeding coefficient and the low effective population size.
Thus, encouraging producers to reduce matings between close relatives and to limit the use of certain sires should be highlighted to keep a reli-able, healthy genetic pool.
Acknowledgement. The authors sincerely thank
the National Bísaro Pig Producer Association (ANCSUB) and Ruralbit for providing the pedi-gree database.
REFERENCES
Alderson G.L.H. (1992): A system to maximize the main-tenance of genetic variability in small populations. In: Alderson L.J. and Bodo I. (eds): Genetic Conservation of Domestic Livestock. Volume 2. CAB International, Wallingford, UK, 18–29.
Barros E.A., Brasil L.H.A., Tejero J.P., Delgado-Bermejo J.V., Ribeiro M.N. (2017): Population structure and genetic variability of the Segureña sheep breed through pedigree analysis and inbreeding effects on growth traits. Small Ruminant Research, 149, 128–133.
Biermann A.D.M., Pimentel E.C.G., Tietze M., Pinent T., Konig S. (2014): Implementation of genetic evaluation and mating designs for the endangered local pig breed “Bunte Bentheimer”. Journal of Animal Breeding and Genetics, 131, 36–45.
Boichard D., Maignel L., Verrier E. (1997): The value of using probabilities of gene origin to measure genetic variability in a population. Genetics Selection Evolution, 29: 5. Caballero A., Toro M.A. (2000): Interrelations between
effective population size and other pedigree tools for the management of conserved populations. Genetical Research, 75, 331–343.
Carolino I., Vicente A., Sousa C.O., Gama L.T. (2007): SNaPshot based genotyping of the RYR1 mutation in Por-tuguese breeds of pigs. Livestock Science, 111, 264–269. Carolino N., Gama L., Vicente A. (2008): Retrospective on
demographic studies in Portuguese autochthonous races. In: Proc. Ibero-American Symposium on Conservation and Utilization of the Zoogenetic Resources, Mar del Plata, Argentina, 523–526. (in Portuguese)
Cervantes I., Goyache F., Molina A., Valera M., Gutierrez J. (2011): Estimation of effective population size from the rate of coancestry in pedigreed populations. Journal of Animal Breeding and Genetics, 128, 56–63.
Cervantes I., Gutierrez J.P., Meuwissen T.H.E. (2016): Re-sponse to selection while maximizing genetic variance in small populations. Genetics Selection Evolution, 48: 69. Gama L.T., Martinez A.M., Carolino I., Landi V., Delgado
J.V., Vicente A.A., Vega-Pla J.L., Cortes O., Sousa C.O. (2013): Genetic structure, relationships and admixture
461 with wild relatives in native pig breeds from Iberia and
its islands. Genetics Selection Evolution, 45: 18.
Gutierrez J.P., Goyache F. (2005): A note on ENDOG: A computer program for analysing pedigree information. Journal of Animal Breeding and Genetics, 122, 172–176. Gutierrez J.P., Cervantes I., Goyache F. (2009): Improving
the estimation of realized effective population sizes in farm animals. Journal of Animal Breeding and Genetics, 126, 327–332.
James J.W., Macbride G. (1958): The spread of genes by natural and artificial selection in a closed poultry flock. Journal of Genetics, 56, 55–62.
Krupa E., Zakova E., Krupova Z. (2015): Evaluation of in-breeding and genetic variability of five pig breeds in Czech Republic. Asian-Australasian Journal of Animal Sciences, 28, 25–36.
Lacy R.C. (1995): Clarification of genetic terms and their use in the management of captive populations. Zoo Biol-ogy, 14, 565–577.
Laval G., Iannuccelli N., Legault C., Milan D., Groenen M.A., Giuffra E., Andersson L., Nissen P.H., Jorgensen C.B., Beeckmann P., Geldermann H., Foulley J.-L., Cheva-let C., Ollivier L. (2000): Genetic diversity of eleven Eu-ropean pig breeds. Genetics Selection Evolution, 32: 187. Leroy G., Mary-Huard T., Verrier E., Danvy S., Charvolin E.,
Danchin-Burge C. (2013): Methods to estimate effective population size using pedigree data: Examples in dog, sheep, cattle and horse. Genetics Selection Evolution, 45: 1. Melka M.G., Schenkel F. (2010): Analysis of genetic diver-sity in four Canadian swine breeds using pedigree data. Canadian Journal of Animal Science, 90, 331–340. Mendes M.B. (2013): Demographic characterization of
Alentejano pigs. Master Thesis, University of Lisbon, Portugal. (in Portuguese)
Menendez J., Alvarez I., Fernandez I., Goyache F. (2016): Genealogical analysis of the Gochu Asturcelta pig breed: Insights for conservation. Czech Journal of Animal Sci-ence, 61, 140–149.
Oliveira R.R., Brasil L.H.A., Delgado J.V., Peguezuelos J., Leon J.M., Guedes D.G.P., Arandas J.K.G., Ribeiro M.N. (2016): Genetic diversity and population structure of the Spanish Murciano-Granadina goat breed according to pedigree data. Small Ruminant Research, 144, 170–175. Paixao G., Esteves A., Payan-Carreira R. (2018): Charac-terization of a non-industrial pig production system: the case of Bísaro breed. Revista Brasileira de Zootecnia, 47. doi: 10.1590/rbz4720170331.
Pinheiro M., Kjollerstrom H.J., Oom M.M. (2013): Genetic diversity and demographic structure of the endangered Sorraia horse breed assessed through pedigree analysis. Livestock Science, 152, 1–10.
Ramos A.M., Mestre R., Gouveia S., Evans G., Zhang Y., Cardoso A., Rothschild M.F., Plastow G., Rangel-Figue-iredo T. (2003): Use of type I DNA markers for initial genetic characterization of two Portuguese swine breeds. Archivos de Zootecnia, 52, 255–264.
Santos Silva J., Tirapicos Nunes J.L. (2013): Inventory and characterization of traditional Mediterranean pig produc-tion systems. Advantages and constraints towards its de-velopment. Acta agriculturae Slovenica, Suppl. 4, 61–67. Sherf B.D. (ed.) (2000): World Watch List for Domestic
Animal Diversity. Food and Agriculture Organization of the United Nations, Rome, Italy.
Silio L., Rodriguez M.C., Fernandez A., Barragan C., Be-nitez R., Ovilo C., Fernandez A.I. (2013): Measuring inbreeding and inbreeding depression on pig growth from pedigree or SNP-derived metrics. Journal of Animal Breeding and Genetics, 130, 349–360.
Tang G.Q., Xue J., Lian M.J., Yang R.F., Liu T.F., Zeng Z.Y., Jiang A.A., Jiang Y.Z., Zhu L., Bai L., Wang Z., Li X.W. (2013): Inbreeding and genetic diversity in three imported swine breeds in China using pedigree data. Asian-Aus-tralasian Journal of Animal Sciences, 26, 755–765. Toro M.A., Rodriganez J., Silio L., Rodriguez C. (2000):
Genealogical analysis of a closed herd of black hairless Iberian pigs. Conservation Biology, 14, 1843–1851. Uimari P., Tapio M. (2011): Extent of linkage disequilibrium
and effective population size in Finnish Landrace and Finnish Yorkshire pig breeds. Journal of Animal Science, 89, 609–614.
Vicente A.A., Carolino M.I., Sousa M.C.O., Ginja C., Silva F.S., Martinez A.M., Vega-Pla J.L., Carolino N., Gama L.T. (2008): Genetic diversity in native and commercial breeds of pigs in Portugal assessed by microsatellites. Journal of Animal Science, 86, 2496–2507.
Welsh C.S., Stewart T.S., Schwab C., Blackburn H.D. (2010): Pedigree analysis of 5 swine breeds in the United States and the implications for genetic conservation. Journal of Animal Science, 88, 1610–1618.
Wright S. (1931): Evolution in Mendelian populations. Genetics, 16, 97–159.
Wright S. (1951): The genetical structure of populations. Annals of Eugenics, 15, 323–354.
Received: 2018–06–04 Accepted after corrections: 2018–08–31