SEM, EDX and Raman and infrared spectroscopic study of brianyoungite
Zn
3
(CO
3
,SO
4
)(OH)
4
from Esperanza Mine, Laurion District, Greece
Ray L. Frost
a,⇑, Andrés López
a, Lina Wang
a, Ricardo Scholz
b, Ney Pinheiro Sampaio
ca
School of Chemistry, Physics and Mechanical Engineering, Science and Engineering Faculty, Queensland University of Technology, GPO Box 2434, Brisbane, Queensland 4001, Australia
b
Geology Department, School of Mines, Federal University of Ouro Preto, Campus Morro do Cruzeiro, Ouro Preto, MG 35,400-00, Brazil
c
NanoLab, REDEMAT, School of Mines, Federal University of Ouro Preto, Campus Morro do Cruzeiro, Ouro Preto, MG 35,400-00, Brazil
h i g h l i g h t s
The mineral brianyoungite is a carbonate–sulphate of zinc. Studied by scanning electron
microscopy with chemical analysis using EDX and vibrational spectroscopy.
Multiple carbonate stretching modes support the concept of non-equivalent carbonate units.
Multiple Raman and infrared bands in the OH stretching region are observed.
Vibrational spectroscopy enhances our knowledge of the molecular structure of brianyoungite.
g r a p h i c a l
a b s t r a c t
a r t i c l e
i n f o
Article history: Received 3 August 2014
Received in revised form 26 March 2015 Accepted 9 April 2015
Available online 23 April 2015
Keywords: Brianyoungite Sulphate Carbonate Hydroxyl
Infrared and Raman spectroscopy
a b s t r a c t
The mineral brianyoungite, a carbonate–sulphate of zinc, has been studied by scanning electron micro-scopy (SEM) with chemical analysis using energy dispersive spectromicro-scopy (EDX) and Raman and infrared spectroscopy. Multiple carbonate stretching modes are observed and support the concept of non-equiv-alent carbonate units in the brianyoungite structure. Intense Raman band at 1056 cm 1with shoulder
band at 1038 cm 1is assigned to the CO 3 2 m
1symmetric stretching mode. Two intense Raman bands
at 973 and 984 cm 1are assigned to the symmetric stretching modes of the SO 4
2 anion. The observation
of two bands supports the concept of the non-equivalence of sulphate units in the brianyoungite struc-ture. Raman bands at 704 and 736 cm 1are assigned to the CO
3 2 m
4bending modes and Raman bands at
507, 528, 609 and 638 cm 1are assigned to the CO 3 2
m2bending modes. Multiple Raman and infrared
bands in the OH stretching region are observed, proving the existence of water and hydroxyl units in dif-ferent molecular environments in the structure of brianyoungite. Vibrational spectroscopy enhances our knowledge of the molecular structure of brianyoungite.
Ó2015 Elsevier B.V. All rights reserved.
Introduction
Brianyoungite is a secondary zinc mineral of idealised formula Zn3(CO3,SO4)(OH)4. The international mineralogical association
classifies the mineral as a carbonate with formula Zn3(CO3)(OH)4.
However, some sulphate units occupy the carbonate positions in the ratio of about 1:3. So the formula may be written as Zn3(CO3,SO4)(OH)4. Brianyoungite is similar in appearance to
hydrozincite[1–3]. Gaines et al. classifies the mineral as a com-pound carbonate.
http://dx.doi.org/10.1016/j.saa.2015.04.013 1386-1425/Ó2015 Elsevier B.V. All rights reserved.
⇑ Corresponding author. Tel.: +61 7 3138 2407; fax: +61 7 3138 1804. E-mail address:[email protected](R.L. Frost).
Contents lists available atScienceDirect
Spectrochimica Acta Part A: Molecular and
Biomolecular Spectroscopy
Brianyoungite occurs as tiny whitish rosettes less than 100
l
m and is composed of thin blades just one or two micrometres across, elongated parallel to thebcrystal axis. The mineral belongs to the monoclinic crystal system withb90°. It is presumed thestruc-ture is similar to that of hydrozincite and the space group is thought to beP21/m,P21orP2221. There are four formula units
per unit cell and the lengths of the unit cell are a= 15.724 Å,
b= 6.256 Å andc= 5.427 Å.
As part of our comprehensive research into minerals containing oxyanions, we report the SEM with EDX and vibrational spec-troscopy of brianyoungite and relate the spectra to the structure of the mineral.
Experimental
Samples description and preparation
The brianyoungite sample studied in this work is from Esperanza Mine, Laurion District, Attikí Prefecture, Greece. The sample is part of the collection of the Geology Department of the Federal University of Ouro Preto, Minas Gerais, Brazil, with sample code SAD-054. Brianyoungite sample was gently crushed and the associated minerals were removed under a stereomicroscope Zeiss Stemi DV4 from the Museu de Ciência e Técnica of the Federal University of Ouro Preto. Qualitative and semiquantitative chemical analysis via SEM/EDS were applied to the mineral characterization.
Scanning electron microscopy (SEM)
Experiments and analyses involving electron microscopy were performed in the NanoLab, REDEMAT, School of Mines, Universidade Federal de Ouro Preto, Ouro Preto, Minas Gerais, Brazil. Brianyoungite crystals were coated with a 5 nm layer of evaporated gold. Secondary Electron and Backscattering Electron images were obtained using a TESCAN VEGA 3 equipment. Qualitative and semi-quantitative chemical analyses in the EDS mode were performed with an Oxford spectrometer and were applied to support the mineral characterization.
Raman microprobe spectroscopy
Crystals of brianyoungite were placed on a polished metal sur-face on the stage of an Olympus BHSM microscope, which is equipped with 10, 20, and 50objectives. The microscope is
part of a Renishaw 1000 Raman microscope system, which also includes a monochromator, a filter system and a CCD detector (1024 pixels). The Raman spectra were excited by a Spectra-Physics model 127 He-Ne laser producing highly polarised light at 633 nm and collected at a nominal resolution of 2 cm 1and a
precision of ±1 cm 1 in the range between 200 and 4000 cm 1.
Repeated acquisitions on the crystals using the highest magnifica-tion (50x) were accumulated to improve the signal to noise ratio of the spectra. Raman Spectra were calibrated using the 520.5 cm 1
line of a silicon wafer. The Raman spectrum of at least 10 crystals was collected to ensure the consistency of the spectra.
An image of the brianyoungite crystals measured is shown in
theSupplementary information as Fig. S1. Clearly the crystals of
brianyoungite are readily observed, making the Raman spectro-scopic measurements readily obtainable.
Infrared spectroscopy
Infrared spectra of brianyoungite were obtained using a Nicolet Nexus 870 FTIR spectrometer with a smart endurance single
bounce diamond ATR cell. Spectra over the 4000–525 cm 1range
were obtained by the co-addition of 128 scans with a resolution
of 4 cm 1and a mirror velocity of 0.6329 cm/s. Spectra were
co-added to improve the signal to noise ratio.
Spectral manipulation such as baseline correction/adjustment and smoothing were performed using the Spectracalc software package GRAMS (Galactic Industries Corporation, NH, USA). Band component analysis was undertaken using the Jandel ‘Peakfit’ soft-ware package that enabled the type of fitting function to be selected and allows specific parameters to be fixed or varied accordingly. Band fitting was done using a Lorentzian–Gaussian cross-product function with the minimum number of component bands used for the fitting process. The Lorentzian–Gaussian ratio was maintained at values greater than 0.7 and fitting was undertaken until reproducible results were obtained with squared correlations ofr2greater than 0.995.
Results and discussion
Chemical characterization
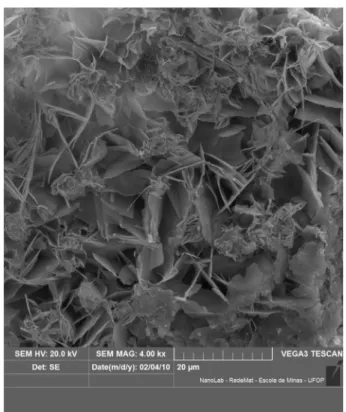
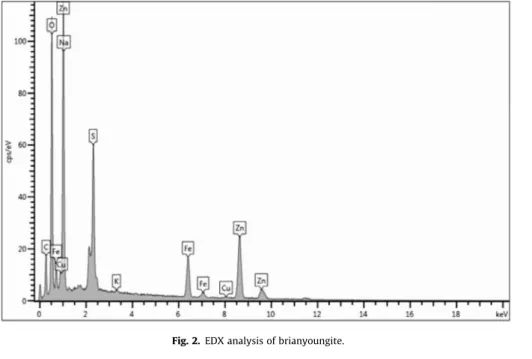
The SEM image of brianyoungite sample studied in this work is shown inFig. 1. The image shows a crystal aggregate up to 0.1 mm, with individual crystals up to 0.01 mm and platy habitus. The chemical analysis is provided inFig. 2. The chemical composition of the measured mineral sample shows the presence of C, Zn and S. Minor amounts of Fe, Cu, K and Na were also observed. A possi-ble composition is (Zn,Fe)3(CO3,SO4)(OH)4.
Vibrational spectroscopy
Spectroscopy of carbonate anion
It is important to understand the vibrational spectroscopy of the carbonate anion in different molecular environments. The authors have published a significant number of papers on the spectroscopy of minerals containing the carbonate anion[4–10]. Nakamoto et al. first published and tabulated the selection rules for unidenate and
Fig. 1.Backscattered electron image (BSI) of a brianyoungite crystal aggregate up to 0.1 mm in length.
bidentate anions including the carbonate anion[11,12]. The free ion, CO32 with D3h symmetry exhibits four normal vibrational
modes; a symmetric stretching vibration (
m
1), an out-of-planebend (
m
2), a doubly degenerate asymmetric stretch (m
3) andanother doubly degenerate bending mode (
m
4). The symmetriesof these modes are A10(R) + A200(IR) + E0(R, IR) + E00(R, IR) and occur
at 1063, 879, 1415 and 680 cm 1respectively. As the carbonate
groups become distorted from regular planar symmetry, this mode splits into two components[12]. Infrared and Raman spectroscopy provide sensitive test for structural distortion of CO32. Generally,
strong Raman modes appear around 1100 cm 1due to the
sym-metric stretching vibration (
m
1), of the carbonate groups, whileintense IR and weak Raman peaks near 1400 cm 1are due to the
antisymmetric stretching mode (
m
3). Infrared modes near800 cm 1 are derived from the out-of-plane bend (
m
2). Infrared
and Raman modes around 700 cm 1region are due to the in-plane
bending mode (
m
4). This mode is doubly degenerate for undistortedCO32 groups[12].
Vibrational spectroscopy of brianyoungite
The Raman spectrum of brianyoungite in the 100–4000 cm 1
spectral range is displayed in Fig. 3a. This spectrum shows the position and relative intensities of the Raman bands. It is noted that there are large parts of the spectrum where no intensity or minimal intensity is observed. Thus, the spectrum is subdivided into subsections depending upon the type of vibration being stud-ied. The infrared spectrum of brianyoungite in the 500–4000 cm 1
spectral region is shown inFig. 3b. This figure shows the position of the infrared bands and their relative intensities. As for the Raman spectrum, there are parts of the spectrum where little or no inten-sity is observed.
The Raman spectrum of brianyoungite over the 900–1250 cm 1
spectral range is reported in Fig. 4a. An intense Raman band at 1056 cm 1with shoulder bands at 1038 and 1086 cm 1is assigned
to the CO32
m
1 symmetric stretching mode [3,4]. Thus, thereappears to be bands attributable to more than one symmetric stretching modes of the carbonate anion[7–9]. One interpretation of this fact is that there are distinct non-equivalent carbonate units in the structure of brianyoungite. This means that not all the car-bonate units are the same. The two carcar-bonate units behave
differently in the structure. Two broad very low intensity Raman bands at 1086, 1127 and 1163 cm 1are attributed to the CO
3 2
m
3
antisymmetric stretching mode. Another possibility is that these
bands are due to SO42
m
3 antisymmetric stretching modes.Raman bands are found at 973 and 984 cm 1and are assigned to
the SO42
m
1 symmetric stretching modes. Thus, there appears toFig. 2.EDX analysis of brianyoungite.
Fig. 3.(a) Raman spectrum of brianyoungite over the 100–4000 cm 1spectral
be bands attributable to more than one symmetric stretching mode of the sulphate anion, thus indicating that there are two non-equivalent sulphate units in the structure of brianyoungite. This means that all the sulphate anions are not equivalent and occupy different positions in the brianyoungite structure. Such a hypothesis is important as no X-ray data can be obtained.
The infrared spectrum of brianyoungite over the 650–1150 cm 1
spectral range is shown inFig. 4b. The broadish infrared band at 987 cm 1is attributed to the SO
4 2
m
1symmetric stretching mode.
The infrared bands at 1027, 1053, 1082 and 1112 cm 1are
associ-ated with CO32 stretching vibrations. A strong infrared band is
observed at 1160 cm 1. A series of infrared bands are observed at
1238, 1260, 1284, 1305 and 1315 cm 1. The infrared bands at 894
and 933 cm 1 are ascribed to the hydroxyl deformation modes.
The infrared bands at 707 and 721 cm 1 are assigned to the
CO32
m
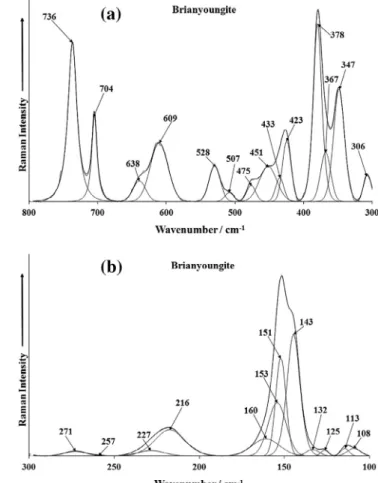
2bending modes.The Raman spectrum of brianyoungite over the 300–800 cm 1
spectral range is reported in Fig. 5a. The two Raman bands at
704 and 736 cm 1 are assigned to the CO
3 2
m
2 bending modes.
These bands are the Raman equivalent of the infrared bands at
707 and 721 cm 1.The series of Raman bands at 507, 528, 609
and 638 cm 1are assigned to the CO
3 2
m
2bending modes. These
bands may also be assigned to the
m
4 (SO4)2 bending modes.The series of Raman bands at 423, 433, 451 and 475 cm 1 are
assigned to the
m
2 (SO4)2 bending modes [6–8]. Strong Ramanbands at 347, 367 and 378 cm 1are due to ZnO stretching bands.
In the Raman spectrum (Fig. 5b), the low intensity bands are attributed to lattice vibrational modes.
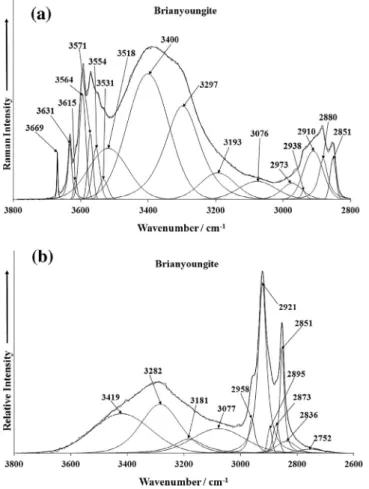
The Raman spectrum of brianyoungite over the 2800–3800 cm 1
spectral range is shown in Fig. 6a. The Raman spectrum shows
complexity. The broad Raman bands at 3297, 3400 and 3518 cm 1
are assigned to water stretching vibrations. The sharp Raman bands at 3531, 3554, 3564, 3571, 3615, 3631 and 3669 cm 1are assigned
to the stretching vibrations of OH units. The observation of bands in the OH stretching region brings into question the actual formula of brianyoungite. The Raman spectrum in this spectral region shows the presence of water and OH units in the structure of brianyoun-gite. These observations are confirmed by the bands in the OH stretching region in the infrared spectrum. It becomes a question of whether water should be included in the formula of brianyoun-gite. The series of Raman bands at 2851, 2880, 2910 and 2938 cm 1 are ascribed to organic impurities. The authors have
not attempted to determine the nature of these organic impurities. Suffice to say, that in the past mineral samples in museums were often coated with a lacquer or type of varnish in order to preserve the mineral. It is likely that the organic impurities are surface coat-ings on the mineral.
The infrared spectrum of brianyoungite over the 2600–3800 cm 1
spectral range is shown inFig. 6b. Infrared bands are resolved at 3077, 3181, 3282 and 3419 cm 1. These bands are attributed to
water stretching vibrations. It is noted that no bands which might be attributed to OH stretching vibrations are found in the infrared spectrum as is observed in the Raman spectrum. The infrared bands at 2851, 2895, 2921 and 2958 cm 1are assigned to the stretching
vibrations of organic impurities.
The Raman spectrum of brianyoungite over the 1250–1600 cm 1
spectral range is shown inFig. 7a. Raman bands are observed at 1298, 1367, 1388, 1440 and 1457 cm 1. These bands are assigned
to the CO32
m
3 antisymmetric stretching modes. Intense RamanFig. 4.(a) Raman spectrum of brianyoungite (upper spectrum) in the 950– 1150 cm 1 spectral range and (b) infrared spectrum of brianyoungite (lower
spectrum) in the 650–1150 cm 1spectral range.
Fig. 5.(a) Raman spectrum of brianyoungite (upper spectrum) in the 350– 600 cm1 spectral range and (b) Raman spectrum of brianyoungite (lower
spectrum) in the 100–350 cm 1spectral range.
band is also noted at 1550 cm 1. The infrared spectrum of
briany-oungite over the 1350–1800 cm 1 spectral range is shown in
Fig. 7b. Infrared bands are found at 1627, 1650, 1676, 1710 and
1739 cm 1. These bands may be assigned to the bending modes of
water. The observation of multiple bands in this spectral region is in harmony with the multiple Raman bands found in the OH stretching region. The series of Raman bands between 1350 and 1575 cm 1are attributed to the CO
3 2
m
3antisymmetric stretching
modes. The observation of multiple bands offers credence to the concept that the carbonate units are not equivalent in the structure of brianyoungite.
Conclusions
We have undertaken a study of the mineral brianyoungite using a combination of SEM, EDX and Raman and infrared spectroscopy. Brianyoungite may be considered to be a derivative of hydroz-incite in which some carbonate units are replaced by sulphate units. In this work, the mineral brianyoungite was analysed using a combination of SEM with EDX and vibrational spectroscopy. EDX analysis shows the presence of Zn, C and S. A probable formula from the EDX analysis is Zn3(CO3,SO4)(OH)4. EDX detects the
pres-ence of Fe, Na and K. It might be expected that some substitution of Zn by Fe2+may occur.
Raman and infrared bands are attributed to the symmetric and antisymmetric stretching modes and bending modes of the CO32
and SO42 units. The ratio of carbonate to sulphate is around 3:1,
thus the carbonate bands dominate the spectrum of brianyoungite. The mineral brianyoungite is characterised by multiple CO32 and
SO42 stretching and bending modes, giving credence to the
exis-tence of more than one non-equivalent carbonate and sulphate units in the brianyoungite structure. The Raman and infrared spec-trum of brianyoungite in the water and OH stretching and water bending region show multiple bands, thus, providing evidence for the existence of water in the structure of brianyoungite in different molecular environments with different hydrogen bond strengths.
Acknowledgements
The financial and infra-structure support of the Discipline of Nanotechnology and Molecular Science, Science and Engineering Faculty of the Queensland University of Technology, is gratefully acknowledged. The Australian Research Council (ARC) is thanked for funding the instrumentation.
Appendix A. Supplementary data
Supplementary data associated with this article can be found, in the online version, athttp://dx.doi.org/10.1016/j.saa.2015.04.013.
References
[1]V. Vagvolgyi, M. Hales, W. Martens, J. Kristof, E. Horvath, R.L. Frost, J. Therm. Anal. Calorim. 92 (2008) 911–916.
[2]M.C. Hales, R.L. Frost, J. Therm. Anal. Calorim. 91 (2008) 855–860. [3]M.C. Hales, R.L. Frost, Polyhedron 26 (2007) 4955–4962.
[4]R.L. Frost, Y. Xi, R. Scholz, F.M. Belotti, M. Candido Filho, J. Mol. Struct. 1039 (2013) 101–106.
[5]J. Cejka, J. Sejkora, I. Jebava, Y. Xi, S.J. Couperthwaite, R.L. Frost, Spectrochim. Acta A108 (2013) 171–176.
Fig. 7.(a) Raman spectrum of brianyoungite (upper spectrum) in the 1400– 1800 cm 1 spectral range and (b) infrared spectrum of brianyoungite (lower
spectrum) in the 1700–1850 cm 1spectral range.
Fig. 6.(a) Raman spectrum of brianyoungite (upper spectrum) in the 3500– 3700 cm1 spectral range and (b) infrared spectrum of brianyoungite (lower
[6]R.L. Frost, M.C. Hales, W.N. Martens, J. Therm. Anal. Calorim. 95 (2009) 999– 1005.
[7]R.L. Frost, M.J. Dickfos, J. Cejka, J. Raman Spectrosc. 39 (2008) 582–586. [8]R.L. Frost, S. Bahfenne, J. Graham, B.J. Reddy, Polyhedron 27 (2008) 2069–2076. [9]R.L. Frost, M.J. Dickfos, J. Raman Spectrosc. 38 (2007) 1516–1522.
[10]R.L. Frost, M. Dickfos, Polyhedron 26 (2007) 4503–4508. [11]K. Nakamoto, Bunko Kenkyu 5 (1957) 3–13.
[12]K. Nakamoto, J. Fujita, S. Tanaka, M. Kobayashi, J. Am. Chem. Soc. 79 (1957) 4904–4908.