AbstrAct: This article introduces a numeric model, developed in a MaTlab environment, in order to monitor NaVSTaR GPS performances concerning accuracy effects and interference phenomenon. The model will be presented as a starting point for a future production of an open-source software, shareable and enlargeable, which will be able to provide real-time information about navigation satellite system performance. a sequence of analysis and comparisons with existing owners of the software will be possible using real data acquired with a high-performance monitoring station, in order to validate numeric models compiled.
Keywords: NaVSTaR satellites, air navigation, Multipath.
a Tool for Real-Time GNSS Performance
analysis in air Trafic Management
Marco brogi1, Pierdomenico Tromboni2
INTRODUCTION
he certiication of Global Navigation Satellite Systems as tools able to provide to pilots and air traic controllers a full support in all navigation phases could represent a real breakthrough for air traic management (ATM), allowing the replacement of current navigation aids (such as NDB, VOR, DME, and ILS) with a single system able to provide the same navigation informations (on a global scale), according to the safety standards established by International Civil Aviation Organization (ICAO) for the diferent phases of light (ICAO 2006). he adoption of a satellite system in the navigation phases will lead to the permanent revolution of airspace concept, with the free route becoming a reality: an airspace in which it is possible to choose diferent paths, thanks to the punctual knowledge of one’s and others’ position at all time, making it possible to plan a light, optimizing time and fuel consumption and, therefore, bringing down mission costs.
context And objectives
he most critical phase of light is, as well known, landing. Safety standards set by ICAO for landing are very restrictive. Helicopters cruising and hovering also have critical phases due to the presence of much possible interferences at low light altitude.
he target of this research is to provide a tool that is able to process data acquirable directly from satellites of global positioning system (GPS) constellation, in order to carry out a real-time monitoring of on-board navigation satellite system performances.
It is also known the importance of recognizing the quality and reliability of performances allowed by the navigation system in use, particularly during the most critical phases in light, as slow-lying
doi: 10.5028/jatm.v7i4.513
1.Sapienza University of Rome – Rome – Italy. 2.ENaV S.p.a – Rome – Italy.
Author for correspondence: Marco brogi | Sapienza University of Rome | Via Emanuele Filiberto, 61 | 00185 – Rome – Italy | Email: [email protected]
(take of and landing for an airplane as well as cruise and hovering for helicoper applications), for which diferent sources of errors – as interferences –, less considered during plain cruise, play a substantial role in terms of performance degradation.
Interferences could be caused by the presence of different sources of broadcast (for example, other navigation aids and also the presence of civil devices) or by undesired relection of signal caused by orographic obstacles. his last type of interference is known as multipath and it can cause an error of about 2 – 3 m, which is negligible at high-lying but could be not admissible during a critical phase of light such as landing or hovering for an helicopter.
Unlike civil aircrats (both used as passenger transportation and freighter) that present a cruise altitude, in most cases, included in an interval of 9.000 – 11.000 m, helicopters, as well as modern UAV systems, can ly at lower altitudes (150 m in empty regions and 300 m in urban areas) so, as a consequence, in these contexts, there is a greater probability that satellite signals are relected by obstacles around.
Reduction of undesired error caused by multipath phenome- non (Ray 1999), together with application of satellite-based augmentation systems (SBAS) corrections in this branch (Oliveira and Tiberius 2008), could make possible a lot of operations that are not feasible at this time. In particular, it could be achievable to lead the low lying in safety in any orographic condition, e.g. low lying through mountains or wooded areas, both to make a local recon naissance and to provide rescue in areas not accessible otherwise.
A continous monitoring and the instant interferences mitigation would ensure the operative state of being contemporary
of general aviation aircrats, rotorcrats, and unmanned aerial vehicles (UAVs), for fire fighting and first-aid flights, first of all.
he increase in navigation satellite system accuracy and reliability could allow, in this context, to take advantage from terminal areas now unaccessible and, consequently, permit an intensive use of any type of strip.
In this paper, it is presented a MATLAB tool able to carry out a statistic postprocessing. Real data have been collected over a time interval of two months and then processed as better described in Table 1.
Acquisition campaign was conducted in an urban environment where a particular attention was directed to multipath efects which, as already mentioned, represent an important source of errors causing a degradation of position solution accuracy at low-lying. his tool represents a irst step for the future development of a sotware able to process real data in real time, within totally open sources, and editable according with other user’s demands. his lexibility and the possibility to share single modules with other users make this model really interesting.
METHODOLOGY
he study starts with a data collection campaign carried out with a ixed monitoring station located in an urban environment. Collected data were elaborated with an appropriate MATLAB
stage duration objectives coniguration Form id reference
1 1 month
Accuracy evaluation and integrity monitoring/ comparison between two
diferent conigurations
2 Rx and 2 antennas 1 Rx able to receive only GPS signals 1 Rx able to receive both GPS signals
and SBAS signals
Position form/
integrity form ST.1
2 48 hours
Evaluation of multipath mitigation tool/comparison
between presence or not of smoothing
2 Rx and 2 antennas 1 Rx able to receive only GPS signal and multipath mitigation option ON 1 Rx able to receive only GPS signal and multipath mitigation option OFF
Position form ST.2
3 3 days
Evaluation of the advantages obtainable from a multiantenna
system in terms of multipath mitigation
1 Rx and 2 antennas Rx is able to receive only GPS signals
(masking angle is set at 10°)
Multipath
form ST.3
4 15 days Comparison with results
obtained in ST.3
1 Rx and 2 antennas Rx is able to receive only GPS signals
(masking angle is set null)
Multipath
form ST.4
506 Brogi M, TromboniP
numeric code compiled speciically to compute GPS navigation data in RINEX format. A comparison with the correct results achieved by the receiver sotware will be conduct in order to validate the model.
he results obtained with both computing methods will be compared with ICAO standards for non-precision approach and CAT-1 precision approach in terms of horizontal and vertical position accuracy required.
At the end, some considerations about the goodness of the sotware and an idea to enhance and extend its reliability and potentiality will be given.
In Table 1, the four diferent case studies conducted are listed, summarizing, for each receivers and antennas, settings and conigurations, the duration of each acquisition stage and the aim of each dataset. In the last column, the relative MATLAB form used to process data is listed for each dataset.
MAtlAb Model
Ater a long data collection campaign (described in detail in the next paragraph and summarized in Table 1), it was developed a numeric code able to elaborate unreined data and to produce numeric and visual results.
We chose to compile this model inside a MATLAB environment taking our way on “he GPS EASY Suite”, published in 2003 by the Danish researcher Kay Borre (Borre 2009). his MATLAB suite is of high quality but it shows a lot of limits expecially for its generalization capacity. Starting from Borre’s suite, we produced a more soisticated and generic MATLAB sotware to process GPS RINEX format daily data and achieve navigation solution for all diferent input iles with the frequency of one solution per second for 24 h per day.
Model Architecture
Numeric code is divided into three indipendent modules:
• A model to compute receiver position.
• A model to compute integrity events and, consequently, protection levels values.
• A model to quantify effects caused by multipath interferences in terms of pseudoranges.
Position Form
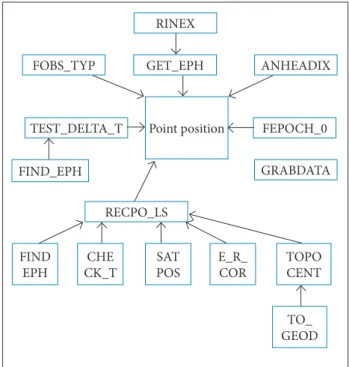
As described in Fig. 1, there are some secondary scripts, each one carrying out an essential information, that work in the background, and they are activated from a unique main script that we call “point_position”.
Substantially, this module acquires input data from RINEX navigation and observation files; it process them, then it computes, for any single observation, satellite positions (from ephemeris) and, consequently, the best geometry available from receiver’s point of view. hrough a least square method, it computes receiver position applying the classic navigation solution algorithm based on the diference between measured and calculated pseudoranges (Hegarty and Kaplan 2000).
he output of this form is the receiver’s position determined by satellites in every daily instant.
Integrity Estimation Form
he architecture of this module is similar to the previous one, with a unique script inside where many secondary functions work in the background.
It is independent from the position module. In addition to point position, we add here two particular functions: one of these is able to solve parity method algorithm in order to carry out a receiver autonomous integrity monitoring (RAIM) process (D’Avanzo et al. 2006). he second particular script, denoted “Pfa”, is also essential to carry out RAIM because it is able to give as output the false alarm probability trend and a matrix including threshold values necessary to the comparison with statistical test in order to produce fault detection process (Liu et al. 2005).
Figure 1. Position architecture.
RINEX
GET_EPH
Point position
ANHEADIX
FEPOCH_0 TEST_DELTA_T
RECPO_LS
FIND EPH
CHE CK_T
SAT POS
E_R_ COR
TOPO CENT
TO_ GEOD
FIND_EPH GRABDATA
h is form solves RAIM parity method algorithm determining, i rst of all, the presence or not of a possible failure (basing on maximum satellite slope principle) and l agging this event with a message; then, the application of parity algorithm permits to estimate protection levels (Salos Andrés 2012).
Multipath Estimation Form
From the architecture complexity point of view, it is the most elementary script. h e objective of this script is to obtain a tool that is able to compute the analytical model to estimate the error caused by the presence of multipath in terms of pseudoranges measures.
Two different scripts were developed: one to estimate multipath trend over an observation period of 24 h, taking advantage of dif erent pseudorandom noises (PRNs) over the day, in order to cover it entirely, and the other to observe the variation of multipath ef ect on a single satellite in the course of dif erent daily intervals during which the same vector is visible by antennas.
h e outputs of these scripts are represented by two charts that show quantii cation (in meters) of the error caused by this interference phenomenon.
test bed
A series of data collections were carried out in order to analyze the performance of the GPS in terms of horizontal and vertical accuracy, system integrity, and multipath ef ects. Data were collected with a global navigation satellite system
(GNSS) monitoring station, property of ENAV S.p.A., over a period of two months.
Monitoring Station Layout
Fixed monitoring station (Ingegneria dei Sistemi S.p.A. 2012) was installed in the ENAV S.p.A. headquarters in the centre of Rome. h is location implies that GPS signal is probably af ected by a substantial error caused by a multipath phenomenon due to the presence of many buildings.
Monitoring station was composed by (a pattern of this layout is shown in Fig. 2):
• Two receiving antennas NOVATEL brand GNSS750.
• Two GNSS receivers Septentrio brand (PolaRx_pro and AsteRx2eH_pro).
• A network switch (HP 3COM).
• A personal computer HP brand 8560W equipped with an external hard disk driver (HDD).
• A network switch Enterasys.
Antennas were installed on the top of the building’s roof, approximately at a height slightly above half a meter from the roof planking level.
Receivers are both multi-frequency and, even though they are two dif erent models, they are similar in respect to performance accuracy. h e only dif erence between PolaRx_pro and AsteRx2eH_pro is represented by a characteristic of the second one, which is able to work also with two input antennas: this property allows the receiver to be able to compute real-time kinematic (RTK) positioning (this function is not used in this context).
Figure 2. Monitoring station layout.
PPP: purchasing power parity.
Antenna GNSS 750 «Ant. B»
ETH cable «LAN B» ETH cable «LAN A» «ENET 1»
SENECA
ETH socket «Ent. 1»
ETH cable «LAN PPP» ETH painel
socket ETH socket
«Ent. 2»
ETH socket «Receivers» «ENET 2»
SENECA
External HDD HP
HP EliteBook 8560w
«RX. B» «RX. A»
220 VAC 220 VAC
Antenna GNSS 750 «Ant. A»
Switchboard
“Receiver A”
“Receiver B” PolaRx4 PRO
Network switch ENET Network
ENTERASYS Network switch
AsteRx2eH 220 VAC
508 Brogi M, TromboniP
Antennas were characterized by a solid design and a low proile that make them ideal for a reference station that needs the presence of a sturdy antenna which ensures high performances. The antennas are both choke ring; in other words, they are omnidirectional high-frequency antennas, composed by a speciic number of conductive concentric cylinder-shaped segments ixed near a central antenna. his type of antenna is particularly appropriate to receive satellite constellation signals and, above all, to mitigate multipath signals.
Data Collection
Acquisition campaign was conducted during the period between 21 May 2014 and 25 July 2014 and was divided into four diferent phases.
First Acquisition Stage (ST.1)
The first one was the longest phase. It started 6 June 2014 and ended ater a month. In this phase, both receivers were used. he objective in this stage is to collect data to compare obtainable performances (in terms of position accuracy and integrity monitoring) between two diferent conigurations: one based on GPS stand-alone coniguration and the other that includes also the presence of satellite-based augmentation system (SBAS), in this case, represented by European geostationary navigation overlay system (EGNOS).
Second Acquisition Stage (ST.2)
Second, third and fourth phases were dedicated to the ability to analyze multipath phenomenon in an urban environment where our monitoring station is located.
In this stage the masking angle was set at 10° (the same used in a previous campaign). Both receivers were used, but in this case they were set to receive only GPS stand-alone signals. In order to analyze multipath errors that afect position solution accuracy, a diferent set of receivers was used. One receiver was set in order to be able to mitigate multipath, unlike the second one. In fact, both receivers can attenuate multipath errors through a post-processing estimate technique that allows to decrease the efects caused by relected signals that are characterized by a small delay. his second acquisition phase was conducted over a time of 48 h.
hird Acquisition Stage (ST.3)
In this phase only one receiver was used: in particular, AsteRx2eH_pro was used because it is able to work with two input antennas. he objective in this phase is to evaluate the attempt to take advantage of a multiantenna system (Cannon et
al. 2000), then the multipath signal is revealed and closed of in terms of pseudorange and its measures are excluded before these fall within position solution computation (Grejner-Brzeziska and Vázquez 2012). he masking angle in this case is 5°, and the duration of stage was three days.
Fourth Acquisition Stage (ST.4)
he fourth and last phase is similar to the previous one. he diference between the third and this phase is represented by the masking angle setting, that is, in this case, null. In order to take advantage of daily periodic multipath event, the duration of the phase was set at 15 days.
PerForMAnce evAluAtion
ICAO Annex 10 (2006) summarizes the performance values that a satellite system has to satisfy to be eligible as navigation aid for every phase of light. In this context, we chose APV II category as reference performance values relative to non-precision approach and CAT I category relative to precision approach. Position errors are referred to antennas’ geo-located positions.
Performances Relative to the First Acquisition Dataset
First acquisition dataset was processed with two diferent tools:
• MATLAB code already described.
• SBF Analyzer sotware (Septentrio receiver plug-in). A comparison between the performed results was conducted.
Accuracy Performances (ST.1)
Septentrio Analyzer tool (Septentrio 2011) allows obtaining a qualitative analysis because it is possible to have results only in a graphic format and this allows getting only qualitative statistics. Accuracy statistics are expressed in terms of horizontal and vertical position error (HPE and VPE, respectively). Statistics daily values were obtained qualitatively from planimetric plots and approximated in order to reach a conservative situation.
In Fig. 3 daily statistics are plotted for horizontal and vertical accuracy for both conigurations considered: stand-alone GPS and GPS with augmentation system.
Figure 3. Horizontal and vertical accuracy statistics (ST.1).
07 09 11 13 15 17
Monitorig day [June – July]
VPE – GPS + SBAS
V er ti ca l ac cur ac y o f 95% 19 21 0 2 4 6 8 10
23 25 27 29 01 03 05 07 09 11 13 15 17
HPE – GPS + SBAS
H o riz o n ta l ac cur ac y o f 95% 19 21 0 5 10 15 20 25
23 25 27 29 01 03 05 07 09 11 13 15 17
VPE – stand-alone GPS
V er ti ca l ac cur ac y o f 95% 19 21 1 3 5 7 9
23 25 27 29 01 03 05 07 09 11 13 15 17
HPE – stand-alone GPS
H o riz o n ta l ac cur ac y o f 95% 19 21 1 3 5 7 9
23 25 27 29 01 03 05
No PVT
Stand-alone Differential Fixed location FIXED RTK FLOAT RTK SBAS-aided PVT Fixed RTK (MB) Float RTK (MB) PPP Fixed PPP 0 3.996 0 0 0 0 82.405 0 0 0 0 0% 4% 0% 0% 0% 0% 95% 0% 0% 0% 0%
Total epochs: 86.401
Epochs [1-s interval]
Positions over time
–20 –10 0 10 20 30 X Y Z
0 1 2 3 4 5 6 7 8 9 × 10⁴
V
ari
at
io
n in c
o o rdina tes , r el at iv e t o th e r ef er enc e p os it io n
Figure 4. Position mode statistics.
Figure 5. Matlab results of ECEF trend (ST.1).
PVT: position velocity and time; Mb: message board. Concerning vertical accuracy, stand-alone GPS is able
to perform a vertical error around 6.5 – 7 m, which is adequate for APV II approaches but does not fulfil requisites for CAT I precision approaches for which a maximum vertical error is established between 4 and 6 m. To satisfy this restriction it is necessary to consider the presence of an augmentation system. Adding EGNOS corrections, it is possible to reach a precision of 2 – 3 m that is able to satisfy CAT I requisites.
It is interesting to note that Fig. 3 shows four values that move away from average error. In order to verify what could have caused these anomalies, a statistical survey was conducted.
In Fig. 4 position mode statistics are shown relative to one of these particular days (the other three are not presented but are very similar).
As we can note, position was not computed for all times considering EGNOS corrections: in some intervals, the receiver uses only GPS signals to compute position. Consequently, there were some disruptions of geostationary satellites, maybe caused by maintenance operations that caused loss of signal and succession of corrupted information broadcast.
To compare performances obtained from MATLAB model, we chose an opportune environment in terms of position accuracy.
510 Brogi M, TromboniP
Epochs [1-s interval] 0.2
–0.2
–0.6
–1 0.6 1
0 200 400 600 800 1,000
V
ari
at
io
n in c
o
o
rdina
tes, r
el
at
iv
e t
o the firs
t e
p
o
ch
Positions over time
–1
–2 0 1 2
3 X
Y Z
0 500 1,000 1,500 2,000 2,500
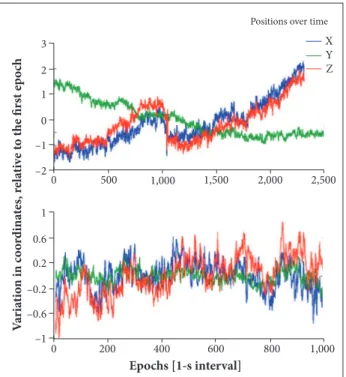
Figure 6. ECEF trend in two different time intervals (ST.1).
short time intervals (that could represent the ef ective duration of a l ight operation about 15 m). As a proof of that, in Fig. 6, two dif erent examples of time intervals are plotted equal to 42 and 17 min, respectively. In these cases, position error shows a more regular trend in line with attended values. h us the greatest problem is represented by the presence of error peaks that, systematically, caused up and down translations that make the solution unreliable and the model not appropriate yet to analyze data relative to long periods.
parameters (relative to visible satellites) are upgraded. Taking for granted that correction parameters are correct, the origin of the error should be researched on the reliability of the orbital propagation algorithm used.
A comparison between the calculated satellites coordinates and the same coordinates provided directly by receiver shows that there is a dif erence of about 103 – 104 m. A dif erence of this size moves to compute position referring to a satellite geometry substantially dif erent from real coni guration.
Integrity Performance (ST.1)
RAIM statistics derivable from receiver log i les are provided in terms of these two parameters (Hewitson and Wang 2005):
• Horizontal external reliability level (HERL).
• Vertical external reliability level (VERL). h ese parameters are described, respectively, as:
observAtions: Possible error reAsons Scripts were debugged and it was checked that algorithms were implemented accurately. A i rst observation concerns an implemented position solution algorithm: it is based only on pseudoranges measures. It considers tropospheric errors, clocks syncronization errors and satellite propagation error but it totally ignores phase observation values which, as it is known, if added in the solution computation, allow to reduce error to centimeter size.
A second and more interesting observation concerns code basis. Looking at the plot in Fig. 5, it is possible to note how errors peaks appear, in some way, with a time uniformity, separating position value from reference geo-located position. Time intervals within maximum errors values seem to be equal to about 2 m. h en it is right to suppose that it could be a systematic error that shows itself every time the correction
where:
subscripts E, N, and V represent local Eastern, Northern, and vertical coordinates; m is the number of possible alternative events.
External reliability represents the estimated parameter error that could be caused by a bias equal to minimum detectable bias (MDB). h e system can be marginally protected using appropriate values of false alarm probability and missed detection probability. h us external reliability level (ERL) can be confused with protection level even if it normally assumes a greater value than the corresponding protection level (PL); as a consequence, results will be more conservative in terms of safety.
If ERL > AL (alarm limit), there is the prospect that the quality of information could be compromised and, consequently, we could have a high integrity risk.
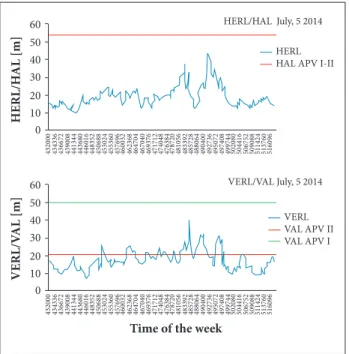
In Fig. 7 HERL/VERL data relative to both considered coni gurations are plotted and compared with specii c AL values imposed by regulations for considered approach categories.
Figure 8. Multipath daily trend. Masking angle of the antenna is set at 10° (ST.3).
• A second stage analyzes the trend of error caused by multipath efects for a speciied satellite in diferent moments of the day.
• The third and last analyses allow to perform a comparison in terms of masking angle efects.
Multipath Daily Effects on Pseudoranges Measure (ST.3)
The objective of this analysis is to quantify the error introduced by multipath that afects pseudoranges measure precision.
Because it is impossible to have a single satellite that is visible for consecutive 24 h, diferent satellites were considered as a function of their visibility time and their position over the horizon, in order to cover a daily interval. Error trend was analyzed for a week in order to have an adequate sample number.
Figure 8 shows that six diferent satellites were required to cover the entire daily visibility. he trend plotted in Fig. 8 is almost constant, and errors are included inside an interval of about 2 m. his result is in line with the goodness of the monitoring station coniguration because, even though antennas are installed in an urban environment, they are placed on the roof of the buildings, so they are not afected by extreme relections; for example, it is possible to ind at the ground level the presence of the so-called urban canyon. Obstacles that the signals meet in their path are fixed. In addition we used choke ring antennas which are able to reject out-of-band signal until 50 dBc.
0 –1 –0.5 0 0.5 1 1.5
1 2 3 4
Epochs [1-s interval]
M
u
ltip
at
h
M
[m]
5 6 7 8 9
× 104
PRN 27 PRN 11 PRN 25
PRN 14 PRN 26
PRN 13 432000 434336 436672 439008 441344 443680 446016 448352 450688 453024 455360 457696 460032 462368 464704 467040 469376 471712 474048 476384 478720 481056 483392 485728 488064 490400 492736 495072 497408 499744 502080 504416 506752 509088 511424 513760 516096
T i me o f t h e w e e k
VERL/VAL July, 5 2014
V
E
R
L
/V
A
L
[m]
0 10 20 30 40 50 60
VERL VAL APV II VAL APV I 432000 434336 436672 439008 441344 443680 446016 448352 450688 453024 455360 457696 460032 462368 464704 467040 469376 471712 474048 476384 478720 481056 483392 485728 488064 490400 492736 495072 497408 499744 502080 504416 506752 509088 511424 513760 516096
HERL/HAL July, 5 2014
H
E
R
L
/H
A
L
[m]
0 10 20 30 40 50 60
HERL HAL APV I-II
Figure 7. Horizontal and vertical reliability levels (Hal and Val, respectively) in comparison with standard values (ST.1).
A comparison between performances obtained with MATLAB model was conducted similarly to accuracy case. Integrity estimation module already described allows to carry out RAIM function and to get protection levels values as a function of ixed false alarm probability. As seen in detail before, performances will be afected by a polarized error due to poor quality of the satellite propagation algorithm. Despite this, an analysis was conducted in particular to test the operation of computation code which results valid from an implementation point of view. In spite of systematic errors, horizontal protection level (HPL) values result lower than APV II alarm limit.
Multipath Effects (ST.2)
Multipath is one of the greatest error sources in both static and kinematic positioning. In particular, in such static applications, this phenomenon is particularly relevant because its effects are caused only by satellite dynamics and can produce therefore slow variation of systematic errors. For this study, the third MATLAB form previously described was used.
hree diferent phases of analysis were pushed through:
• Considering different satellites in visibility over 24 h – a daily analysis of multipath error trend was carried out.
Multipath Effect on a Single Satellite
512 Brogi M, TromboniP
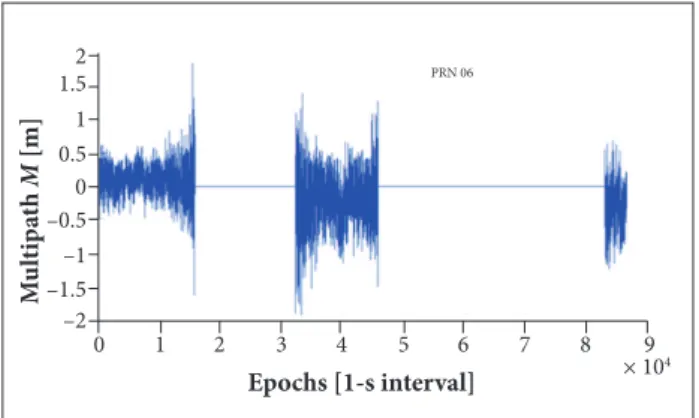
Figure 9. Multipath relative to a single satellite (ST.3).
Figure 10. Multipath daily trend. Masking angle of the antenna is set as null (ST.4).
0 –2 –0.5 –1 –1.5 0 0.5 1 1.5 2
1 2 3 4
Epochs [1-s interval]
M
u
ltip
at
h
M
[m]
5 6 7 8 9
× 104
PRN 06
0 –1 –0.5 0
1.5 0.5 1 1.5 2
1 2 3 4
Epochs [1-s interval]
M
u
ltip
at
h
M
[m]
5 6 7 8 9
× 104 PRN 11 PRN 21
PRN 24 PRN 10
PRN 20 is plotted as an example. In this case, G06 was visible by the
station for three times in a day. First and second intervals are more signiicant to characterize the error behaviour; in fact, in these two cases, the satellite vector (SV) is locked for about 4 h without interruption.
In both cases, we can note how error shows a characteristic trend that follows proportionally the satellite trajectory from the observation point.
It is proven that multipath phenomenon appears, sig-niicantly, when a satellite is near the horizon and the signal path is more affected by the presence of obstacles in the surrounding environment.
The trend plotted in Fig. 9 confirms that. Indeed, it is possible to note that multipath error is about 2 m when it starts the lock between satellite and receiver (SV is near the local horizon); the satellite rises over the horizon and the error acquires a descendent trend oscillating around a value of 0.5 m. During dropping phase, error starts again to increase its value around 2 m or less.
A second observation is that there is a diference in terms of error size. With 10°, the error is approximately 0.5 m smaller than the other case and reaches maximum values of about 1.5 m. his result is absolutely in line with attended values and conirms that, in an environment like this, where the monitoring station is located, with restricting antennas receiving radiation of a quantity equal to 10°, it is possible to have data less afected by errors caused by undesired relections.
CONCLUSIONS
The MATLAB model presented in this article might be a first approach to the fulfilment of an open-source software produced to solve the problem of real-time monitoring of navigation satellite system performance. This software was expressly designed with a modular architecture in order to allow modifying and extending it in function of required applications. This modular architecture should lead to the extension of the software through the sharing of single modules developed on purpose by different users, creating a real community of users able to share their applications and results.
he next steps to carry out the development of a model that will be as more accurate and reliable as possible could be identiied in a drop of processing data time, for example, using a simpler and optimized compilation of single scripts as well as, and in particular, the extension to other existing satellite constellations (Glonass, Galileo, and Beidou) in order to permit their interoperability that will run to an obvious improvement in terms of accuracy and availability of the full system.
Effect of Antenna Masking Angle
he trend described in Fig. 10 was obtained considering data relative to an acquisition conducted setting the masking angle equal to 0°. In this last phase, a comparison with the trend carried out using data relative to a 10-degree masking angle setup is conducted. Comparing this plot with the trend showed in Fig. 8, it is possible to point out diferences relative to the efect of the considered interference.
In this context, a particular attention was directed to the analysis of GPS accuracy and the interferences caused by the presence of multipath phenomenon, particularly relevant concerning location of the monitoring station, so we developed modules for this type of applications.
It would be desirable in the future to develop additional independent forms which will be able to perform a real-time analysis of, for example, additional interferences like the phenomena that could cause a performance degradation produced by navigation system leading to the employment of GNSS in ATM operations.
REFERENCES
borre K (2009) GPS Easy suite II. a Matlab companion. Inside GNSS; [accessed 2015 Nov 12]. http://www.insidegnss.com/auto/marapr09-borre.pdf
Cannon ME, Nayak Ra, Wilson C, Zhang G (2000) analysis of multiple GPS antennas for multipath mitigation in vehicular navigation. Proceedings of the ION NTM 2000; anaheim, USa.
D’avanzo M, Gaglione S, Robustelli U (2006) Simulazioni di un test di integrità mediante tecnologia RaIM. Proceedings of the 10a Conferenza Nazionale aSITa; Napoli, Italy.
Grejner-brzeziska Da, Vázquez GE (2012) a case study for Pseudorange multipath estimation and analysis: TaMDEF GPS network. Geofís Intl 51(1):63-72.
Hegarty CJ, Kaplan ED (2000) Understanding GPS. Principles and applications. 2nd ed. Norwood: artech House Inc.
Hewitson S, Wang J (2005) GNSS receiver autonomous integrity monitoring (RaIM) performance analysis. GPS Solutions 10(3):155-170. doi: 10.1007/s10291-005-0016-2
Ingegneria dei Sistemi S.p.a. (2012) SENECa-PPP-DOC-5 - Progetto “aS bUIlT” dell’installazione issa della stazione di monitoraggio GNSS presso ENaV. N° doc: RT/212/055. Pisa: IDS.
International Civil aviation Organization (2006) Radio navigation aids. annex 10. vol. I. 6th ed. Montréal: ICaO.
liu J, lu M, Feng Z, Wang J (2005) GPS RaIM: Statistics based improvements on the calculation of threshold and horizontal protection radius; [accessed 2015 Nov 16]. http://www.researchgate.net/ publication/251408118_GPS_RaIM_Statistics_based_Improvement_on_ the_Calculation_of_Threshold_and_Horizontal_Protection_Radius
Oliveira J, Tiberius C (2008) laNDING: added assistance to pilots on small aircraft provided by EGNOS. Proceedings of the 2008 IEEE/ION Position, location and Navigation Symposium; Monterey, USa.
Ray JK (1999) Use of multiple antennas to mitigate carrier phase multipath in reference stations. ION GPS-99. Proceedings of the 12th International Technical Meeting of the Satellite Division of the Institute of Navigation; Nashville, USa.
Salos andrés CD (2012) Integrity monitoring applied to the reception of GNSS signals in urban environments (PhD thesis). Toulouse: Université de Toulouse.
Septentrio (2011) Rx Control Manual. Version 4.6.4. leuven: Septentrio.