ABSTRACT: Terminal area is an important part of airspace system. Its operation eficiency is related to the safety, order and eficiency of the entire air trafic. So the assessment of the terminal route network operation eficiency is needed. Considering the aspects of route segment capacity, light low, workload and operation stability, the paper analyzes the inluent factors on the operation eficiency of terminal area route network, constructs the calculation parameters of operating eficiency, and establishes the calculation model of operating eficiency of the route segment. An assessment model for the operation eficiency of terminal area route network based on light demand is built using comprehensive weighted method. Finally, the feasibility of the assessment model is veriied by analyzing a case. The model can be used to assess not only the operation eficiency of a single route segment based on different light demands in the terminal area, but also the real-time eficiency of the terminal area route network.
KEYWORDS: Terminal area, Route network, Operation eficiency, Eficiency assessment, Operation stability, Flight low.
Operation Eficiency Assessment Model of
Route Network in Terminal Area
Zhang Zhao-ning1, Zhao Zhao-na1, Liu Zhen1
INTRODUCTION
With the rapid development of civil aviation and the increase of air traic low, airspace users’ demand for airspace resources is increasing. To ensure safety, eiciency, and orderly operation of air traic, a sustainable planning of route network and a reasonable dynamic air traic low management strategy are needed. Terminal area airspace, as a bottleneck of the whole route network system, is extremely easy to cause the air traic congestion which seriously afects the safety and efectiveness of air traic. In order to use terminal area resource lexibly and improve the operation eiciency of route network in terminal area, the research on the operation eiciency assessment of the terminal area route network system is very necessary.
At present, little research is done on route network operation eiciency. For the operation eiciency of airspace system, Federal Aviation Administration assesses the eiciency of airspace system from the aspects of lexibility, predictability, access, delay and so on to ensure the safe, efficient, and orderly movement of air transportation (Federal Aviation Administration 1997). EUROCONTROL built the Performance Review Committee, which proposes nominees to form a Key Performance Indicator Drating Group (KPIDG) that put forward the indicators of safety, delay, cost efectiveness, light eiciency predictability, environment equity, access, lexibility and reliability Performance Review Unit (2001). For the terminal area, Rakas and Hansen (2002) developed a methodology for modeling the terminal airspace service availability and system efectiveness; the methodology distinguished the equipment availability, weather availability and service availability, deined each measure, and considered weather and equipment availability jointly. Bloem and Kopardekar (2008) evaluated
1.Civil Aviation University of China – Air Trafic Management School – Tianjin – China.
the utilization of a large area with multiple sectors based on Monitor Alert Parameter (MAP) by using the sector-hourly utilization metrics. Zhang et al. (2013) established a general index system which includes density of air traic low, safety performance, eiciency performance and workload of air traic controller, and presented a classiication evaluation method by means of artiicial intelligence on the basis of back propagation network model. Xu and Yu (2003) proposed conlict detection method based on the light route segment analysis according to the relationship between radar track and route. In addition, Li et al. (2009a) applied low theory to the research of route network structure stability. Li et al. (2009b) used the following theory to study the stability of terminal area and proposed the terminal area capacity assessment method based on the low stability.
For road traic, the scholars have made achievements on the research of reliability and operation eiciency of road network. Asakura (1996) proposed the travel time reliability and considered the recession of network capacity due to deterioration of road conditions, as well as regarded that travel time reliability is a function of the ratio between the operating time in the blocked state and the unblocked operating time. Latora and Marchiori (2002, 2004) proposed to use the shortest path in the network to measure eiciency and applied it to the analysis and evaluation of various networks, but this method analyses eiciency of network only from the travel distance and it ignored some important factors such as low and others which afected the eiciency of the network. Zhu et al. (2000) studied the reliability, sensitivity and eiciency of road sections using the generation method that is suitable for large-scale network. Jenelius et al. (2006) proposed a method to measure the important degree of road sections. Qin and Shi (2008) put forward a method to measure the traic network eiciency according to the important degree of the node and link, and it could relect the inluence of the traic demand, traic network low, travel costs and other factors on eiciency of the network comprehensively. Hou and Jiang (2000) studied the survival and efective aspects in the city road network and proposed the function relation based on the path and intersection reliability. Zhan et al. (2010) formulated the aircrat arrival sequencing and scheduling (ASS) problem in the form of a permutation problem and proposed a new solution framework that makes the irst attempt at using an ant colony system (ACS) algorithm based on the receding horizon control (RHC) to solve it. D’Ariano et al. (2012)
presented the Terminal Manoeuvring Area-Flow Management (TMA-FM) models and algorithms for a busy terminal area and evaluated the retiming and rerouting algorithms on practical size instances from the Fiumicino (FCO) airport. Samà et al. (2014) established the model of air traic lows in the Terminal Control Area (TCA) based on alternative graphs to solve the real-time problem of aircrat scheduling and routing in TCA. All these ideas and methods provide reference for the index of route segment operation impedance and operation stability to build the assessment model of the operational eiciency in terminal system area. Samà et al. (2013) introduced a rolling horizon framework to manage busy traic situations with a large number of delayed aircrat. As scheduling algorithms, the paper compared a Branch and Bound (BB) algorithm with a First Come First Served (FCFS) rule that they used as a surrogate for the dispatchers behavior. D’Ariano et al. (2015) enriched the existing models by including new formulations of relevant practical constraints compared with the current literature based on job shop scheduling applied to solve the Aircrat Scheduling Problem (ASP). he paper introduced and analyzed three alternative ASP formulations, in which the objective function is the minimization of delay propagation with respect to the of-line timetable.
ESTABLISHMENT OF TERMINAL
AREA ROUTE NETWORK SYSTEM
he network is expressed by graph in mathematics and the complex network can be accurately described with the language and symbol of graph theory. The graph in graph theory is composed of the number of given points and the lines connecting the two points. he graphic is usually used to describe a speciic relationship between certain things, which uses dots to represent things and uses the line connecting the two points to express this relationship between two things. A speciic network graph can be abstracted as a graph consisted with a node set V and an edge set E. Each side in E corresponds to a pair of nodes in V (Watts and Strogatz 1998; Wilson 1986).
Terminal area airspace system as an important subsystem of the whole airspace system, to some extent, the situation of terminal area is the most complex subsystem. he terminal route network is a structural system that is connected by the route in terminal area airspace according to a certain way. he route network in terminal area is composed of the airport, route, air corridor, aircrat and other elements. Airports, routes and air corridors constitute the space distribution of terminal area network. And the planes complete the arrival or departure through the route and air corridor in the terminal area. he speciic operation is that all arrival lights are separated from the light route and join the airport route for light, inally through a diferent approach to the runway line for landing. And all departure lights takeof from the airport and, along the departure route in terminal area, are inally away from terminal area through corridor and join the route. In this process, it is necessary to make full use of the terminal area resources to meet the demand of arrival and departure lights, to assure the light safety, eiciency and orderly operation under the command of controller.
he terminal area route network is connected by the routes in a certain way. It is a 3-D network structure that is made up of beacons, airports, location reports and the route segments which connect these waypoints. By projecting the 3-D network onto a 2-D plane, the terminal area route network is deined as a directed graph G(V, R),according to the graph theory. And beacons, airports and location reports can be route network nodes. he node set is V = {v1, v2, v3,…, vn}. he route segments which connect these waypoints are the edge of the network. he route segment set is R = {r1, r2, r3,…,rm}. Each route segment r corresponds to the node (vi,vj), where i = 1, 2,…, m and
j = 1, 2,…, n, r∈ R.
To express the relationship between route segment and node, G = {gij} is m × n order incidence matrix between route segment and node in the terminal area route network G(V, R). he element gij in the matrix is the 0 – 1 variable, which is gij { ; gij = 1 indicates that the waypoint vj is one of the endpoints of route segment ri; gij = 0 indicates that the waypoint vj is not one of the endpoints of route segment ri.
TERMINAL AREA ROUTE NETWORK
EFFICIENCY AND INFLUENCE
FACTORS
System eiciency can be deined as the degree of realizing the function of the system with the efective utilization of the system resources during the system operation process Jenelius et al. (2006). In the process of the terminal system operation, we need to make full use of resources to complete the terminal area light approach and departure and to guarantee safety and order of the traic low, under the command of the controller. herefore, the operation eiciency of terminal area route network can be deined as the degree of meeting a certain light demand with eicient utilization of terminal area existing resources under the command of the controller, while ensuring the light safety and orderly operation.
he terminal area is a limited airspace, whose operation is closely related to the route structure, control workload, light low as well as the external variable factors (e.g. weather condi-tions, air traic control system and technical conditions). he terminal area route network operation eiciency is afected by many factors that are subdivided into the following categories: • Route segment capacity. Route segment is the minimum constituent unit of the terminal area and its capacity is the ultimate relection of existing resources in the terminal area. he utilization of route segment capacity impacts on the operation eiciency.
• Flight low. he determination of the terminal area operation is to make the light low in an orderly and stable state. With the light low increase, air traic complexity and control workload will increase at the same time. If light low is close to the airspace capacity, it may cause traic congestion and lead to unstable operation of the route network system. As a result, this will afect the entire terminal operation eiciency and safety. herefore, light low is a key factor of operation eiciency.
• Controller and workload. At present, almost countries mainly use the Air Traffic Control (ATC) route operation mode. Controllers have decision-making power on the whole airspace system traic control. Pilots comply with controllers’ instruction. he goal of controllers’ work is to ensure air traic safety and maximize the use of limited airspace resources. So the controllers will afect the operation eiciency of the route network system in terminal area. Aircrat light will form the objective task needs for controllers and they must bear the physical and mental pressure to meet these needs. he pressure can be transformed into time consumption. Therefore, the length of time consumption can be expressed by controllers’ workload. Controllers’ workload will afect the airspace capacity and effective operation. The size of the workload is afected by the complexity of airspace structure, air traic density and system availability. So the controllers’ workload is an important factor of operation eiciency.
• Segment time of light. he segment time of light relects the stability and service capabilities of the terminal, which can also afect the cost of air transport and the eiciency of the entire airspace system. If the light time in the segment is shorter, it means that this segment operation is stably. If the light time is longer, it indicates that the operation impedance is relatively big and the segment operation is not stably, which will bring low cost eiciency. hus, segment time has signiicant efect on the route network of the terminal area.
• he ATC guarantees facilities. It mainly refers to the distribution, degree of automation and operation reliability of communication, navigation and surveillance equipment. If the precision of ATC facilities changes, ATC service ability to ensure light will change. In addition, the change of all random factors can also lead to the change of workload, and then it afects the eiciency of route network in terminal area.
• Meteorological conditions. Different weather conditions have diferent requirements and restrictions on the operation of aircraft, which will affect the controller’s workload, as well as the running stability in terminal area, and will ultimately afect the eiciency of terminal area route network. In addition, the weather
change can also lead to the change in workload, and then it afects the eiciency of route network in terminal area.
• Some other physical or technical factors. It is mainly relected on the navigation precision of the equipment and aircrat performance such as rate of climb, the inal approach speed etc. To sum up, the determinants mainly include light low, controller’s workload and segment running time. Furthermore terminal area route network operation eiciency is afected by some external factors such as weather, ATC equipment and precision.
THE
ASSESSMENT
MODEL OF
TERMINAL AREA ROUTE NETWORK
OPERATION EFFICIENCY
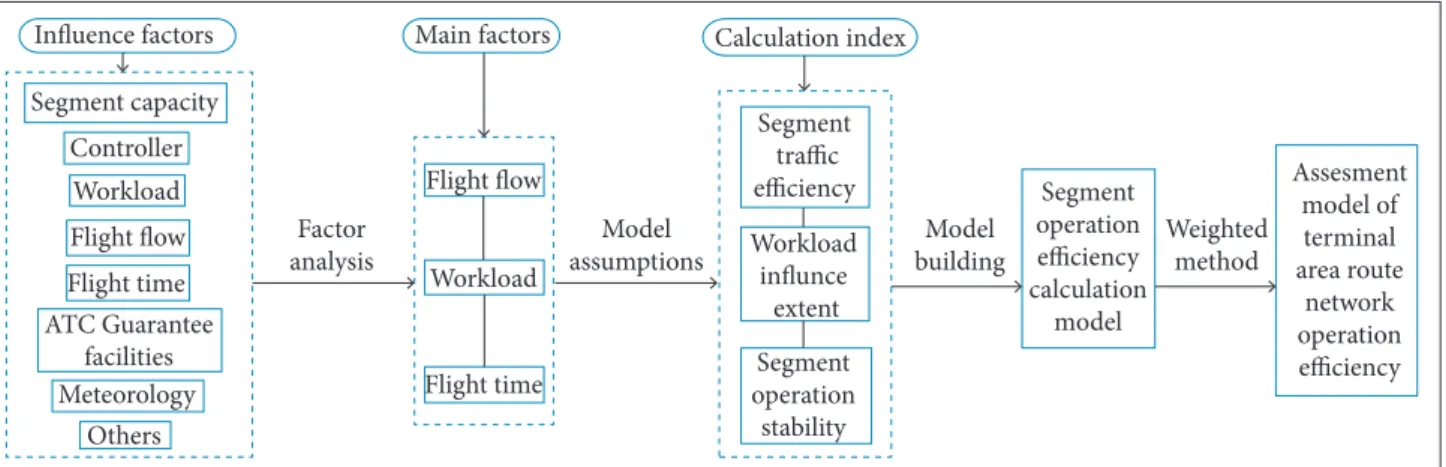
Considering the impact of traffic flow characteristics on the air traic operation eiciency, an assessment model for the operation eiciency of terminal area route network based on light demand is built. he process of the whole model is shown in Fig. 1.
From Fig. 1, the internal and external factors of the operation eiciency of route network in terminal area are irstly analyzed. hen the main factors are selected taking the light low as the starting point. Making certain assumptions, the segment operation eiciency evaluation model is constructed through the establishment of three calculation indexes. Finally, by using weighted method, an assessment model for the operation efficiency of terminal area route network based on flight demand is built.
In the full consideration of air traic low inluence on the route network operation eiciency, this study builds an assessment model for the operation eiciency of terminal area route network based on light demand. he basic assumptions of the model are:
• The route is the one-way route, so the route flow mentioned is the one-way low.
• he controllers’ workload regarding the command of an aircrat is certainly in a particular route segment.
departure under the preconditions of guaranteeing security, order, and eicient operation of light. According to the inluencing factors and the operation in the terminal area, we can know that resource utilization in the terminal area is relected on its airspace capacity utilization rate. Safe operation needs a controller, and it is closely related with the workload. he order and eiciency of the operation can be relected on the operation stability. So this paper proposes three calculation parameters which are “segment traic eiciency”, “control workload inluence extent” and “segment operation stability”, based on the light flow, segment capacity, segment operating stability and controller’s workload. So the segment operating efficiency model is established as follows:
in the segment is S, and the separation margin ΔS is proposed concerning the precision of navigation, communication delay, climate change and other inluence on the route capacity. he maximum capacity of route network segment can be expressed as:
Influence factors Main factors Calculation index
Factor analysis
Model assumptions
Model building
Weighted method Segment
operation efficiency calculation
model
Assesment model of terminal area route
network operation efficiency Segment
traffic efficiency
Segment operation stability Workload
influnce extent Segment capacity
Others Meteorology ATC Guarantee
facilities Flight time
Flight time Flight flow
Flight flow Workload
Workload Controller
Figure 1. The process of building the assessment model.
where:
q is the light low; c is the route segment capacity; w is the workload of a route segment; and r is the route segment operation stability.
Route Segment Trafic Eficiency
Route segment traic eiciency is deined as the ratio of the actual light low and the capacity, which can relect the utilization of the route segment capacity under the normal condition of a certain weather, airspace structure and technique. To calculate the route segment traic eiciency, we can count each route segment in the assessed period according to the lying radar data and light plan. he light low is denoted as q. hen, when determining the route segment capacity c, the average speed through the segment i in the evaluation time period t is vi, the length of route segment is li, the minimum safety separation (1)
(3)
(4)
(5) (2)
he route segment traic eiciency is denoted as:
Workload Inluence Extent
Route segment workload refers to the consumption of working time based on the control instruction during the flight operation in the assessed period. Effect degree of route segment workload is the influence degree of a certain route segment workload on the route segment operation efficiency.
Control workload is closely linked to sorties of regional lights. With the increase of air traic low, control workload also increases and the impact on route segment operation eiciency is negative; fiis the workload when the controller commands a plane in the assessed route segment, so the total workload of the segment is:
where:
Route Segment Operation Stability
he reliability of road network goes gradually from abstract road network to the network with traic low, because of the study on the road network travel time reliability. It is no longer considered physical structure network simply, taking into account the mutual inluence of travel demand and the capacity of road network, as well as travel behavior of road user. Travel time reliability is a very important measure of network reliability index, which describes the probability that the transportation can be inished in a time range. Air transport is in pursuit of high speed and high eiciency. Users and management of terminal route network attach great importance to the economic operation. So the light time of aircrat in the terminal area is more concerned. And the operation stability has obvious efects on the segment eiciency of route network. herefore, the research methods of the road network travel time reliability are worth learning to discuss the operation stability of route segment.
Reliability of travel time in the road network mainly considers the impact of traic demand and the capacity change of road network on its reliability. But light low at diferent moments in the route network is changing, and capacity is afected by the aircrat type, the precision of navigation, communication delay and weather conditions as well as other variable factors, so the actual capacity of route is within certain changes randomly. Aircrat lying in the terminal area is ordered optimized. he aircrats are afected by each other and the behind aircrat is interfered by the front aircrat. he route operation in the terminal is similar to the road operation through analysis. he research methods of road travel time reliability are learned to establish a terminal area route network operation stability model. his can no longer simply consider the physical structure of route network, but takes the mutual influence of flight demand and route network capacity, as well as the impact of workload, into account.
Route segment operation stability is deined as the probability of meeting the light demand within certain operation impedance Ming (2006).
Route segment operation impedance is the obstruction impact on light low in the route segment. Route segment operation impedance is a function of flight flow. With the increase of air traic low, segment presents congestion or luctuating phenomenon, and this will result in the increasing of operating impedance in section. But the actual increasing change of operating impedance has no mature model to calculate it in the civil aviation ield. USA Federal Highway
Administration summarized the relationship between travel time and traic low of road and proposed the road impedance formula, which is the Bureau of Public Roads (BPR) function (Shei 1985). he operation of route network in the terminal area is similar to that of road network. Draw on the experience of BPR function, route segment operation impedance can be computed as follows:
where:
t0 is the route segment zero low impedance and represents the time that a plane in free light requires the time when the light low is zero. It can be calculated based on the average light speed, expressed as t0 = li/vi; ca is the actual capacity of the segment and it presents randomness with the change of route network operating environment; α and β are the model parameters, q/ca ≤ 1 , because the light low is not allowed to exceed the capacity in route . According to the improved BPR function Wang et al. (2006), we can get α = 0.5668 and β = 1.4431.
Because the aircraft type, the precision of navigation, communication delay and weather conditions as well as human factor are changing, so the actual travel ability of segment is random. Based on the actual operating situation, it can be assumed that route segment capacity follows the uniform distribution. he probability density function is as follows:
(6)
(7)
(8) where:
x and x are the upper and lower density function, respectively; θ (0 ≤ θ ≤ 1) is the use rate of route segment ability, when the weather, equipment and other condition are changing.
According to the research of literature (Wilson 1986), the route segment operation impedance follows the normal distribution. Route segment stability refers to the probability of completing the light demand under a certain route segment operation impedance.
he route segment operation impedance is expressed as:
network operation eiciency is diferent, so the route segment turnover can be a calculation weight.
he terminal area route network operation eiciency is calculated as follows:
where:
Ψ = E(t0) / t0 + ε;Ψ is the congestion coeicient of route segment, and ε is the parameter that describes the operation impedance deviation from the minimum average running time. In order to ensure the normal operation of light, we take ε = 0.015.
Route Segment Operation Eficiency
Terminal area route network operation eiciency is heavily inluenced by air traic low. During the calculation of route network operation eiciency, we take controller’s workload, air traic low and the route segment operation stability into account. he signiicance of route segment operation eiciency is that air traic not only meets a certain transport demand but also ensures the orderly, safe and smooth operation.
he route segment operation eiciency is expressed as follows:
where:
eriis the operation eiciency of route segment i; g(ql)is the traic turnover of terminal, and its value is equal to the sum of each route segment turnover in the assessed terminal area. It is calculated as:
(9)
(10)
(13) (12)
(11)
Terminal Area Route Network Operation Eficiency Each route segment operation is relatively independent at the same period in the entire route network. hey jointly inluence the route network system terminal operation. We can adopt comprehensive weighted method to calculate the terminal network operation eiciency. Considering the characteristics of traic low (Wilson 1986), each route segment of the transport turnover is diferent and the impact on the terminal route
m0
i = l
Figure 2. System diagram of route network.
where:
m0is the total quantity of route segments and i in the terminal area.
NUMERICAL
EXAMPLE
We select an approach route network in the south of a terminal area to calculate and analyze the eiciency of an hour. According to the graph theory, the system diagram of route network is built. he route network node set is V = {AND, IDINK, DADAT, JTN} and the route network section set is R = {AND – DADAT, AND – IDINK, DADAT – JTN, IDINK – JTN}. Figure 2 shows the system diagram of route network.
I D I N K
DADAT JTN
AND g(ql) =
Σ
qiliselected data of radar and voice. Table 1 shows the capacity and the length of route segment.
THE NUMERICAL EXAMPLE BASED ON FLIGHT DEMAND
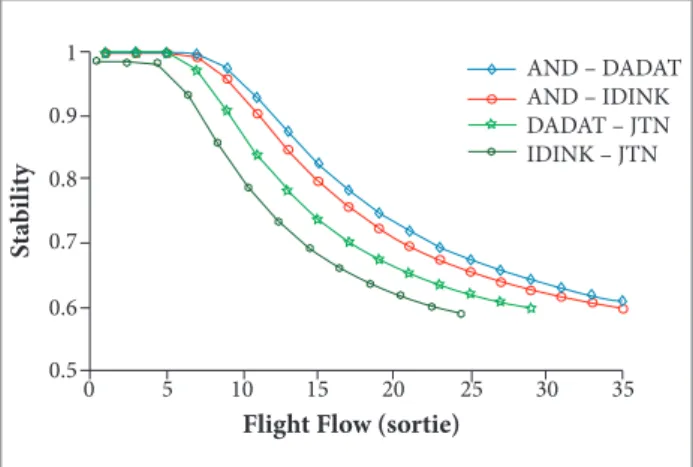
Concerning the calculation of route segment stability, Fig. 3 shows the operation stability of the route network in the terminal area based on light demand. Regarding the assessment model, Fig. 4 shows the operation eiciency of the route network of the terminal area based on light demand.
According to the results based on the assessment model, we can get that the operation of segment is steady and ordered when the low is small. And the reliability of each route segment decreases with the increase of the air traic low.When the traic low is close to the maximum segment capacity, the operation stability degree is close to 0.6. In addition,according to the four segment operation stabilities of AND – DADAT, AND – IDINK, DADAT – JTN and IDINK – JTN, we can know that when the light low is given, the bigger the capacity of the route segment, the more stable the air traic low system.
he value of operational eiciency of route network in the terminal can be assessed by the model. From Fig. 4, we know that, with the increase of air traic low in terminal area, the operation eiciency will increase irstly. he reason is that the air traic low increases, the workload increases, and the route
network system becomes unstable, resulting in less eiciency of route network. Operating eiciency decreased signiicantly when the average workload intensity got close to 60% of the statistics time, which is consistent with the Doratask method that is adopted by UK logistics and the Flight Council. It also veriies the feasibility of the model.
In addition, due to the decrease of operation eiciency of route network, the route has not been fully utilized and the resource of route has been wasted. So the operation eiciency reduces when the capacity of segment is larger when the air low is given. herefore, we can improve the operation eiciency of the whole route network by distributing light low and using route segment lexibility.
THE NUMERICAL EXAMPLE BASED ON REAL-TIME DATA
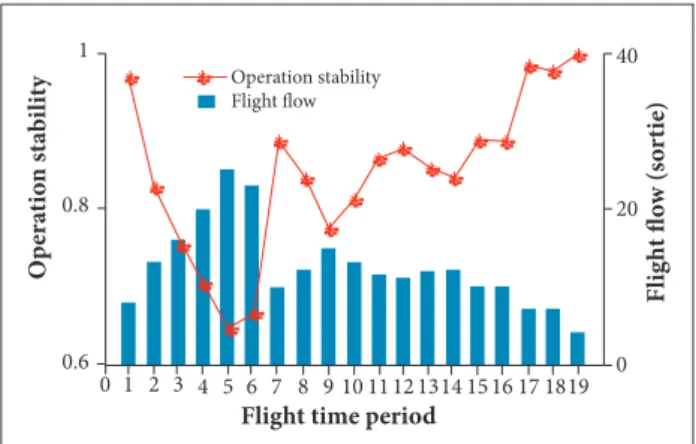
We select the light data in 19 time periods from 6:00 AM to 1:00 AM (each period is one hour). he numerical example based on real-time data is analyzed through the assessment model. Number 1 represents the period of 6:00 AM ~ 7:00 AM; number 2 represents 7:00 AM ~ 8:00 AM; number 19 represents the second day, 0:00 AM ~ 1:00 AM; the rest can be calculated in the same manner. Figures 5 and 6, respectively, show the operation stability and the operation eiciency of the route network in the terminal area based on real-time data.
3 5 3 0 2 5 2 0 1 5 1 0 5 0 0 .5 0 .6 0 .7 0 .8 0 .9 1
Flight Flow (sortie)
AND – DADAT AND – IDINK DADAT – JTN IDINK – JTN
St
abi
li
ty
3 5 3 0 2 5 2 0
15 10 5 0 0 0.05 0.1 0.15 0.2 0.25
Flight Flow (sortie)
AND – DADAT AND – IDINK DADAT – JTN IDINK – JTN Route network
St
abi
li
ty
Table 1. Original data of route segment.
Route segment AND – DADAT AND – IDINK DADAT – JTN IDINK – JTN
Length [km] 22 33 75 76
Velocity [km/h] 540 360 450 400
Capacity/sortie 38.00 26.00 35.00 29.00
Figure 4. Operation eficiency of the route network based on
light demand.
Figure 3. Route segment operation stability based on light
Operation efficiency Flight flow
Flight time period
0 1 2 3 4 5 6 7 8 9 10 11 12 1314 15 16 17 1819 0 10 30 20 0.25 0.2 0.15 0.1 F lig h t fl o w (s o rt ie) O p er ati o n s ta b il it y
Operation stability Flight flow
Flight time period
0 1 2 3 4 5 6 7 8 9 10 11 12 1314 15 16 17 1819 0 20 40 1 0.8 0.6 F lig h t fl o w (s o rt ie) O p er ati o n s ta b il it y
From Fig. 6, we can know that, during the time when airports and the routes begin to open at 9:00 AM, the eiciency of the route network in the terminal area increases along with the increase of light low. It can be known that resource in the terminal area is fully used and controller’s workload keeps in a controllable scope. Additionally, the whole route network runs smoothly. he operation eiciency of terminal area route network gradually achieves the irst trough at 10:00 AM. During the period, the controller’s workload is larger and the route is in a congested state. As a result, service ability of route network in the terminal area is weak and the operation eiciency is also low. he operating eiciency begin to rebound with the increasing traic low ater 11:00 AM.
he eiciency of route network in the terminal area is the highest around 02:00 PM. his suggests that route source is fully utilized, workload is quite suitable for controller and service ability in the terminal area is strong during this time. In other words, human ability and material resources are better used and it achieves a relatively input optimization. From 05:00 PM to 09:00 PM, the air traic low is appropriately intensive. So the operation eiciency level of this period is high and service ability of route network operation is fully brought into play. he eiciency is low ater 11:00 PM, and the reason is that there is waste in human and material resources with the signiicant reduction in light traic.
Through the analysis, it can be drawn that the results of the terminal area route network eiciency obtained by using the assessment model are consistent with reality. So the model can be used as the assessment method for service ability and the operation state of route network. And it provides reference for resource allocation and organization optimization in the terminal area.
CONCLUSION
To describe the efect of the resource usage, controller’s workload and air traic low stability on the running status of terminal area under diferent light lows, the paper proposed the concept of terminal area route network operation eiciency. Firstly, according to the graph theory, a terminal area route network system chart can be constructed. Taking the light low as the starting point, the calculation parameters of “route segment traic eiciency”, “workload inluence extent” and “route segment operation stability” are proposed by analyzing
Figure 6. Operation eficiency of the route network based on
real-time light low.
Figure 5. Operation stability of the route network based on
real-time light low.
From Fig. 5, we know that the lying is unobstructed and operation stability is higher around 6:00 AM in the morning, because the airports and routes are just open. With the time continuing, the route network operation stability decreased gradually. In the irst peak period of light low, the operation stability reached the irst valley value around 10:00 AM and slowly recovered ater 10:00 AM. Starting from 13:00 PM, the route network traic becomes busy or congested and route network running stability is reduced to a lower level along with the increase of light low. From 05:00 PM to 10:00 PM, the air traic low is intensive in the route network and route network operation is relatively stable in this period. Ater 11:00 PM, air traic in terminal area is becoming unimpeded and the route network operation stability is higher.
the inluence factors of the terminal area route network operation eiciency. With comprehensive weighted method, an assessment model for the operation eiciency of terminal area route network is built based on light demand and the three aspects already mentioned. Finally, it is applied to a given terminal area to verify the feasibility and practicability of the model.
This paper analyzes the influence factors of terminal area route network operation efficiency and establishes the calculation index of “route segment traic eiciency”, “workload inluence degree” and “route segment operation stability”. An assessment model on the operation eiciency of terminal area route network based on light demand is built. hrough the case analysis, the feasibility of the assessment model is veriied. We can get that the route network operation stability luctuates with the change of air traic low, and operating eiciency increases irst and then decreases with the increase of air traic low. he model can be used to assess not only the operation eiciency of a single route segment in the terminal area, but also the real-time eiciency of the terminal area route network. And the model will beneit the airspace management and serve as a theoretical basis for
scientiic exploration of airspace system. Additionally, the model can provide reference for the dynamic distribution of traic, according to the diferent operation eiciencies.
his article proposed an operation eiciency assessment model of route network in terminal area based on light traic and did not considered in detail the changes in controller’s workload, different airspace structures and operating environment. Future studies will be to control the workload and the external environment changes in the speciic analysis and calculations, to establish a more precise terminal area route network eiciency evaluation model. Additionally, the next study will provide the regression analysis of ight low and eiciency to distribute the air traic low dynamically by the model.
ACKNOWLEDGEMENTS
his study was supported by the National Natural Science Foundation Project of China (71171190) and the 2010 Fundamental Research Funds for the Central Universities (2XH2011B004).
REFERENCES
Asakura Y (1996) Reliability measures of an origin and destination pair in a deteriorated road network with variable lows. In: Bell MGH. Transportation networks: recent methodological advances. Oxford: Pergamon Press. p. 273-287.
Bloem M, Kopardekar P (2008) Combining airspace sectors for the eficient use of air trafic control resources. Proceedings of the AIAA Guidance, Navigation, and Control Conference and Exhibit; Honolulu, Hawaii.
D’Ariano A, Pacciarelli D, Pistelli M, Pranzo M (2015) Real-time scheduling of aircraft arrivals and departures in a terminal maneuvering area. Networks 65(3):212-227. doi: 10.1002/net.21599
D’Ariano A, Pistelli M, Pacciarelli D (2012) Aircraft retiming and rerouting in vicinity of airports. IET Intelligent Transport Systems 6(4):433-443. doi: 10.1049/iet-its.2011.0182
Federal Aviation Administration (1997) National airspace system performance measurement overview. Virginia: Center for Advanced Aviation System Development.
Hou L, Jiang F (2000) Study on the reliability of urban road network. Systems Engineering 18(5):44-48.
Jenelius E, Petersen T, Mattsson LG (2006) Importance and exposure in road network vulnerability analysis. Transport Res A-Pol 40(7):537-560. doi: 10.1016/j.tra.2005.11.003
Latora V, Marchiori M (2002) Is the Boston subway a small-world network? Physica A 314(1):109-113.
Latora V, Marchiori M (2004) How the science of complex networks can help developing strategies against terrorism. Chaos Soliton Fract 20(1):69-75. doi: 10.1016/s0960-0779(03)00429-6
Li X, Zhang Z, Hou R (2009a) Research of the structural stability of the route network system. Journal of Transportation Engineering and Information 7(1):80-84.
Li X, Zhang Z, Wang L (2009b) Terminal area capacity evaluation method based on following stability. Systems Engineering: Theory & Practice 29(2):173-179.
Ming G (2006) The application research on reliability of route travel time and its distribution in the aspect of trafic. Harbin: Harbin Institute of Technology.
Performance Review Unit (2001) Cost effectiveness and productivity KPIs. Working Paper prepared by the KPI Drafting Group, Version 1.0, EUROCONTROL.
Qin J, Shi F (2008) A new measure for transportation network eficiency and its application. Systems Engineering 26(4):94-98.
Rakas J, Hansen M (2002) Methodology for estimating terminal airspace service availability and system effectiveness. AIAA’s Aircraft Technology, Integration and Operations.
Samà M, D’Ariano A, Pacciarelli D (2013) Rolling horizon approach for aircraft scheduling in the terminal control area of busy airports. Procedia - Social and Behavioral Sciences 80:531-552. doi: 10.1016/j.sbspro.2013.05.029
Shefi Y (1985) Urban transportation networks: equilibrium analysis with mathematical programming methods. Cambridge, MA: Massachusetts Institute of Technology.
Wang S, Huang W, Lu Z (2006) Deduction of link performance function and its regression analysis. Journal of Highway and Transportation Research and Development 23(4):107-110.
Watts DJ, Strogatz SH (1998) Collective dynamics of ‘small-world’ networks. Nature 393(6684):440-442. doi: 10.1038/30918
Wilson RJ (1986) An Eulerian trail through Königsberg. J Graph Theor
10(3):265-275. doi: 10.1002/jgt.3190100305
Xu G, Yu J (2003) An approach of route segment based collision alert technology. Computer Engineering and Applications 39(4):213-214.
Zhan ZH, Zhang J, Li Y, Liu O, Kwok SK, Ip WH, Kaynak O (2010) An efficient ant colony system based on receding horizon control for the aircraft arrival sequencing and scheduling problem. IEEE Trans Intell Transp Syst 11(2):399-412.
Zhang J, Hu M, Wu Z (2013) An improved integrated evaluation method on performance of air trafic control based on BP Network. Journal of Southwest Jiaotong University 48(3):553-558.