ISSN 0104-6632 Printed in Brazil
www.abeq.org.br/bjche
Vol. 32, No. 01, pp. 237 - 245, January - March, 2015 dx.doi.org/10.1590/0104-6632.20150321s00001865
Brazilian Journal
of Chemical
Engineering
EFFECT OF NON-DARCY FLOW COEFFICIENT
VARIATION DUE TO WATER VAPORIZATION ON
WELL PRODUCTIVITY OF GAS CONDENSATE
RESERVOIRS
E. Sheikhi
*, A. Hashemi and A. Kaffash
Department of Petroleum Engineering, Ahwaz Faculty of Petroleum Engineering, Petroleum University of Technology, No. 30, Aghigh St, Kooye Soltanmanesh, Ahwaz, Iran.
Phone: + 98 611 2260890 E-mail: sheikhi_put@yahoo.com
(Submitted: April 15, 2012 ; Revised: April 7, 2012 ; Accepted: April 12, 2014)
Abstract - Well productivity of gas condensate reservoirs is highly affected by near-wellbore phenomena. Inertial force resulting from convective acceleration of fluid particles in the medium, as well as viscous force, determines the flow of gas through porous media at high velocity. Pressure drop builds up the molar content of water in gas by water vaporization in the near-wellbore region, which means a drop in connate water saturation. Given that the inertial force is a function of the non-Darcy coefficient, β, which itself depends upon connate water saturation, this can ultimately lessen the non-Darcy component of the pressure drop and therefore inertial forces, leading to improvement of well deliverability. Currently, no physically relevant model takes into account the non-Darcian flow coefficient variation due to this phenomenon. This paper utilizes a single-well compositional simulation to exhibit how water vaporization could compensate for the effect of inertia on well productivity of gas condensate reservoirs.
Keywords: Gas condensate reservoirs; Well productivity; Non-Darcy flow; Water vaporization; Simulation.
INTRODUCTION
Gas condensate reservoirs are becoming more common as deeper depths are being targeted in the exploration for oil and gas. The behaviors of such systems are complex and are still not fully under-stood, especially in the near-wellbore region. (Grin-garten et al., 2006).
When the flowing bottomhole pressure in gas condensate wells drops below the dew point, a con-densate bank is created within the near wellbore region. This reduces the gas relative permeability around the well and leads to a loss of well produc-tivity. Furthermore, accumulation of the condensate
liquid within the near wellbore region leads to re-duction of the effective flow area and consequently will increase the gas velocity at the wellbore. There-fore the non-Darcy flow coefficient and its related skin factor will increase. In the reservoir, far from the wellbore, flow rates are low and Darcy’s law re-mains valid, but near the wellbore, high-pressure gradients induce both large condensate saturation and high gas velocities, which may lead to significant deviations from Darcy’s law for the gas permeability (Lombard. et al., 2000).
the Non-Darcy flow coefficient β.
Investigations have shown that the dependency of the inertial coefficient β on the rock properties, espe-cially the water saturation (Coles and Hartman, 1998; Kalaydijan et al., 1996; Geerstma, 1974). A reduction in water saturation can reduce the inertial coefficient.
In gas condensate reservoirs, gas is initially in equilibrium with water at reservoir conditions. How-ever, once a well is placed in production, the pres-sure drop that occurs around the well bore causes an increase in the molar content of water in the gas phase (Grattoni et al., 2009; Zuluaga and Lake, 2008, 2005; Morin and Montel, 1995; Kamath and Laroche, 2000).
Water vaporization that happens in high-tem-perature gas-condensate reservoirs shrinks the water saturation, which in turn elevates the gas saturation. Therefore, it is very important to consider the effect of water vaporization in gas condensate reservoirs.
In order to consider this effect, fine-grid compo-sitional simulations or simulations using local grid refinement (LGR) near the wells can be used for accurate estimates of the well deliverability.
Water vaporization has been observed and re-ported in many HP/HT gas reservoirs. The first pub-lished report in this regard came from the Arun field in Indonesia (Bette and Heinemann, 1989). In this field, water was produced at the surface, while no water influx occurred. There have been some at-tempts to model water vaporization for flow through permeable media (Bette and Heinemann, 1989; Ku-rihara et al., 2000). Dodson and Standing (1994) reported experimental studies in PVT cells to deter-mine the solubility of natural gas in brine and to determine the solubility of water in natural gas. It was found that the mole fraction of water in the gas phase increased with temperature and decreased with pressure.
Zuluaga and Monsalve (2003) experimentally ex-amined the rate of water vaporization in core sam-ples at initial water saturation. Other authors, namely Lee (1999) and Bette and Heinemann (1989), modi-fied compositional simulators to account for mass transfer between water and hydrocarbon components to enable them to predict the amount of water va-porization.
Zuluaga and Lake (2005) devised a mathematical model for estimation of the water saturation profile owing to vaporization in dry gas reservoirs. Despite these efforts, there has not yet been any mathemati-cal model for water vaporization in gas condensate reservoirs. In order to clarify the vaporization in a gas condensate reservoir, the authors developed a
new semi-analytical model for these reservoirs and compared the results to those of the commercial compositional simulator GEM (see the appendix of this paper). It is important to know that our scope of work in this paper is the variation of the non-Darcy coefficient due to water vaporization.
In this paper, the commercial compositional simulator GEM was used to investigate the effect of water vaporization and its change on the non-Darcy flow coefficient and productivity index of the well.
THEORETICAL BACKGROUND
In the case of fluid flow through a porous me-dium far from the wellbore region, the pressure drop in the flow direction is proportional to the fluid ve-locity. The mathematical statement of this relation-ship is Darcy’s law, which for radial flow is:
dp u dx k
μ
= (1)
where μ is the fluid viscosity, k is the permeability and u is the fluid velocity, as defined by the follow-ing equation.
Q u=
2 r hπ (2)
The region near the wellbore plays a key role in the productivity of gas condensate wells. In this re-gion, due to higher gas flow rates in addition to vis-cous forces, the inertial force acts mainly as a result of convective acceleration of the fluid and also be-comes significant. In the literature, many studies have been done to understand the invalidation of Darcy’s law when the gas flow rate is high (Fancher and Lewis, 1933; Cornell and Katz, 1953; Tek et al., 1962). Forchheimer suggests the application of the equation below for calculating pressure drop at high flow rates:
2 dp u
u dx k
μ
= + βρ (3)
how-ever, since the viscosity is small, the non-Darcy component is always included, and Forchheimer’s equation is applied instead of Darcy’s. It is also noteworthy that the non-Darcy flow is convention-ally used in flow equations as an additional skin factor.
Flow of a gas in porous media under non-Darcy conditions is described by Equation (4) (Dake, 1982).
e wf
w 1422TQ r 3
m(p) m(p ) (ln S DQ) kh r 4
− = − + + (4)
where D is a function of β
The single-phase inertial resistance factor, β, is a fundamental rock property. It is sometimes referred to as the turbulence factor and can be calculated from the Geerstma correlation, as follows.
0.5 5.5 48511
k β =
φ (5)
Noman and Archer (1987) summarized the origi-nal inertial effects, as well as the influence that fluid properties and pore structure would exert on β. They found that inertial effects for gases are stronger in the presence of mobile liquid compared to the immobile case. Lombard et al. (1999) developed Equation (6), based on experimental data, to calculate the inertia coefficient.
0.5 5.5 5.5
g wi
0.005
k (1 S )
β =
φ − (6)
with kg in m2, βg in m-1.
As the pressure drop is increased and developed, the molar content of water in the gas phase increases exponentially and results in connate water vaporiza-tion, especially near the wellbore. This variation in connate water saturation (Swi) could alter
water-sen-sitive reservoir parameters such as the inertial resis-tance factor (β). Reduction of the connate water satu-ration causes a decrease in β, which can improve well productivity.
The compositional simulator GEM can predict the water saturation profile during production under such circumstances. This research presents a single-well compositional simulation study to investigate the effects of water vaporization on the inertia resis-tance factor and well productivity of a high-pressure, high-temperature Iranian gas condensate reservoir.
SIMULATION MODEL SETUP
A compositional simulation was conducted to predict individual well performance. An example of a vertical well is presented in this paper. The effect of condensate banking, non-Darcy flow and water vaporization was captured through use of very fine grids near the well.
Synthetic Reservoir Model
The synthetic high-temperature gas condensate reservoir, at equilibrium with connate water, was described by 60×1×1 radial grids. Finer grids were chosen around the closely-spaced production wells to obtain better resolution. The smallest and innermost grid was 0.25 ft and the largest grid, the outermost one, 600 ft in radius. Relative permeability was con-structed by the Corey equation (Corey, 1954). The three-parameter Peng- Robinson equation of state (Peng and Robinson, 1976), as utilized in the compo-sitional simulator, was used to model the PVT be-havior of reservoir fluids. The simulation modeling involved a number of considerations. First, the sig-nificance of water vaporization requires that water be a component in the fluid model. Second, the pa-rameters of the equation of state must be tuned with experimental data. The simulation was run for 1800 days of production. Water vaporization is not incor-porated in some compositional simulators, but GEM (compositional simulator of CMG) can simulate this effect. The radial well model properties are summa-rized in Table 1.
Table 1: Parameters for gas condensate reservoir simulation.
Parameter Value External radius 5000 ft
Wellbore radius 0.5 ft
Thickness 45ft
Permeability 30 md
Porosity 10% Connate water saturation 20%
Temperature 217ºF volumetric flow rate 20 MMSCFD
Simulation grid cell 60×1×1 Relative permeability Corey Initial pressure 6000 psi Dew point pressure 4815 psi
Reservoir Fluid Description
dew point pressure, and liquid dropouts in constant composition expansion (CCE) and constant volume depletion (CVD) at the reservoir temperature (217 °F). Winprop was used to make the fluid model and re-gression was based on observed data. PVT properties were predicted by the three-parameter Peng-Robin-son equation of state and fluid viscosity by the Jossi-Stiel-Thados correlation. Components were decreased to 7 pseudo-components by grouping (lumping). Some changes were made in critical properties and acentric factors and volume shifts were done to make the fluid model approximate observed data more closely. Components and pseudo component composi-tions are shown in Table 2 and Table 3. The calcu-lated dew-point at the reservoir temperature, 217 ºF, was close to 4815 psi. By grouping components into these 7 pseudo-components and changing critical properties, acentric factors and volume shifts, the fluid model was tuned very satisfactorily.
Table 2: Fluid composition before lumping.
Component Mole %
N2 3.9
CO2 1.98
H2S 0.42
C1 82.49
C2 5.13
C3 1.86
i-C4 0.4
n-C4 0.67
i-C5 0.3
n-C5 0.28
C6 0.35
C7 0.45
C8 0.44
C9 0.29
C10 0.24
C11 0.17
C12 0.13
C13 0.12
C14 0.09
C15 0.07
C16 0.05
C17 0.04
C18 0.04
C19 0.03
C20 0.06
Table 3: Composition of pseudo components.
Pseudo components Mole % GP1=N2+C1+C2 91.52
GP2=CO2+H2S 2.4
GP3=C3+i-C4+n-C4 2.93
GP4=i-C5+n-C5-C6 0.93
GP5=C7-C10 1.42
GP6=C11-C18 0.71
GP7=C19-C20 0.09
Figure 1 and Figure 2 show calculated and labo-ratory observed data for different parameters in the CVD and CCE experiments. Figure 3 also shows the P-T diagram of the fluid sample.
Figure 1: Observed and calculated liquid saturation for the CVD experiment.
Figure 2: Observed and calculated relative volume for the CCE experiment.
Figure 3: P-T diagram of the fluid.
Inclusion of Non-Darcy Flow and Water Vapori-zation into Data Files
of *H2O_INCLUDED or *OGW_FLASH *ON key-words to permit connate water vaporization during production.
RESULTS AND DISCUSSION
The compositional simulation was run. Figure 4 shows the connate water saturation versus distance at different times after production. It could be observed that the formation dried up to a distance of 7.5 ft after 800 days of production. If the pressure declines, the molar content of water in the gas phase will in-crease. As the vaporization front moves within the reservoir far from the well, the formation dries fur-ther to nearly 12 feet after 1000 days. Figure 5 also shows how connate water saturation gradually drops at different locations near the wellbore.
Figure 4: Connate water saturation distribution within the reservoir due to water vaporization at different times.
Figure 5: Variation of water saturation at different locations with respect to time.
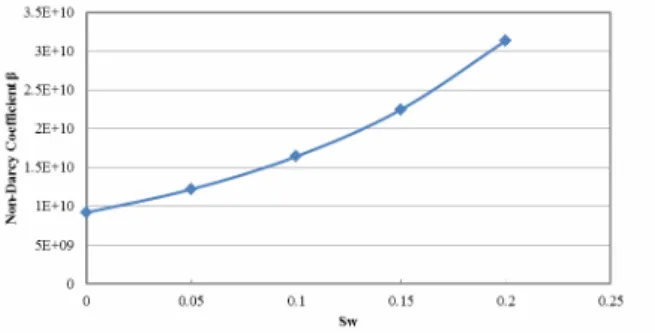
As mentioned earlier, the inertial resistance factor (β) is inversely proportional to (1-Swi). The
relation-ship between β and Swi is shown in Figure 6.
Non-Darcy flow, which is a function of the inertial resis-tance factor (β), becomes more significant near the wellbore. On the other hand, water vaporization re-duces the inertial resistance factor (Figure 7), which leads to hindrance of the effects of non-Darcy flow. According to Equation (4), non-Darcy flow creates
an additional wellbore pressure drop, decreasing bottom-hole pressure with respect to the base case. On the contrary, water vaporization exerts an oppo-site effect compared to the non-Darcy case. Figure 8 illustrates the bottom-hole pressure in different sce-narios. It is shown that water vaporization could compensate for the negative effect of inertia and elevate the bottom-hole pressure up to the base case value.
Figure 6: The relationship between inertial coeffi-cient and water saturation.
Figure 7: Inertial coefficient at different locations during gas production.
Figure 8: Well bottom-hole pressure given for three different cases: neglecting non-Darcy flow, consid-ering the inertial effect and finally considconsid-ering water vaporization, respectively.
productivity index varies with the fluid mobility at the well and this is a well-accepted PI expression for gas wells, according to the following equation:
2 2
w f Q P I
P p =
−
(7)
The productivity index is directly proportional to the bottom-hole pressure. Hence, any factor that could improve bottom-hole pressure will have a positive impact on the productivity index. As Figure 8 illustrates, water vaporization could increase the bottom-hole pressure with respect to the non-Darcy case. Therefore, it could change the productivity index of gas condensate wells. Figure 9 demonstrates the variation of the PI in three different scenarios. It is noticeable that water vaporization could compen-sate for the negative effect of non-Darcy flow.
Figure 9: Productivity index (PI) for three different cases: neglecting non-Darcy flow, considering the inertial effect and finally considering water vapori-zation, respectively.
CONCLUSIONS
Water vaporization that happens in high-tem-perature gas reservoirs causes connate water to va-porize near the wellbore.
At high flow rates in a gas condensate reser-voir, non-Darcy flow can impair the productivity index.
The new water saturation profile imposes an appreciable influence on well behavior. It can change the inertial coefficient β and give rise to an increase in bottom-hole pressure.
Water vaporization and its follow-up bottom-hole pressure improvement can enhance the well productivity index. This must be taken into serious consideration in reservoir studies, especially in high-temperature tight gas condensate reservoirs.
NOMENCLATURE
DQ Rate dependent skin factor
h Thickness of formation ft Kj Effective permeability of
phase j
m (p) Pseudo pressure psi2/cp p Average reservoir pressure psi Q Gas flow rate MMSCFD r Radius ft re External radius ft.
S Skin factor
Swi Connate water saturation
u Fluid velocity bbl/ft2day Z Compressibility factor
Greek Letters
β Inertial coefficient
ф Porosity
ρ Density
μ Viscosity
ACKNOWLEDGEMENTS
The authors would like to extend their sincere gratitude to the Reservoirs Systems Engineering De-partment at National Iranian South Oil Company for their permission to use their CMG software.
REFERENCES
Bette, S., Heinemann, R., Compositional modeling of high temperature gas-condensate reservoirs with water vaporization. SPE 18422, Presented at SPE Symposium on Reservoir Simulation, Houston, TX, February 6-8 (1989).
Coles, M. E. and Hartman, K. J., Non-Darcy meas-urements in dry core and effect of immobile liquid. Paper SPE 39977 presented at the 1998 SPE Gas Technology Symposium, Calgary, 15-18 March (1998).
Corey, A. T., The interrelation between gas and oil relative permeabilities. Producers Monthly, 19(1), 38-41 (1954).
Cornell, D. and Katz, D. L., Flow of gases through consolidated porous media. Industrial & Engi-neering Chemistry, 45(10), 2145-2152 (1953). Dake, L. P., Fundamental of Reservoir Engineering.
Dodson, C., Standing, M., Pressure-volume-tempera-ture and solubility relationships for natural gas-water mixtures. Drilling and Production Practice, American Petroleum Institute (1944).
Fancher, G. H. and Lewis, J. A., Flow of simple fluids through porous materials. Industrial & En-gineering Chemistry, 25(10), 1139-1147 (1933). Geertsma, J., Estimating the coefficient of inertial
re-sistance in fluid flow through porous media. Society of Petroleum Engineers Journal, 14(05), 445-450 (1974).
Grattoni, C., Guise, P., Phillips, G., Fisher, Q., Knipe, R., Evaluation of water evaporation and salt precipitation due to flow in gas reservoirs. International Symposium of the Society of Core Analysts, Noordwijk, The Netherlands 27-30 September (2009).
Gringarten, A. C., Bozorgzadeh, M., Daungkaew, S. and Hashemi, A., Well Test analysis in lean gas condensate reservoirs: Theory and practice. SPE 100993, paper presented at the 2006 SPE Russian Oil and Gas Technical Conference and Exhibition, Moscow, Russia, 3-6 October (2006).
Kalaydjian, F. J-M., Bourbiaux, B. J. and Lombard, J-M., Predicting gas/condensate reservoir per-formance: How flow parameters are altered when approaching production wells. Paper SPE 36715 presented at the 1996 SPE Annual Technical Conference and Exhibition, Denver, Colorado, 6-9 October (16-96-96).
Kamath, J., Laroche, C., Laboratory based evaluation of gas well deliverability loss due to water block-ing. SPE 63161, Presented at the SPE Annual Technical Conference and Exhibition, Dallas, Texas, October 1-4, (2000).
Kurihara, M., Liang, J., Fujimoto, F., Nghiem, L. and Sammon, P., Development and application of underground gas storage simulator. SPE 59438, Presented at the Asia Pacific Conference on
Modeling for Asset Management, Yokohama, Ja-pan, 25-26 April (2000).
Lombard, J. M., Longeron, D. G., Influence of con-nate water and condensate saturation on inertial effect. Paper SCA 9929 presented at 2000 Intl. Symposium of Core Analysts, 1-4 August (2000). Mott, R., Engineering calculations of gas-conden-sate-well productivity. SPE Reservoir Evaluation & Engineering, 6(05), 298-306 (2003).
Noman, R. and Archer, J. S., The effect of pore structure on non-darcy gas flow in some low-permeability reservoir rocks. Paper SPE 16400 presented at the 1987 SPE/DOE Low-Permeabil-ity Reservoirs Symposium, Denver, Colorado, 18-19 May (18-1987).
Peng, D. Y., Robinson, D. B., A new two-constant equation of state. Ind. Eng. Chem. Fundam. 15(1), 59-64 (1976).
Rajeev, R. L., Well testing in gas condensate reser-voirs. M.Sc. Thesis, Stanford University, Depart-ment of Petroleum Engineering (2003).
Tek, M. R., Coats, K. H., Katz, D. L., The effect of turbulence on flow of natural gas through porous reservoirs. Journal of Petroleum Technology, 14 (07), 799-806 (1962).
Zuluaga, E. and Lake, L. W., Modeling of experi-ments on water vaporization for gas injection using traveling waves. SPE Journal, 13(02), 248-256 (2008).
Zuluaga, E., Lake, L.W., Semi-analytical model for water vaporization in gas producers. SPE 91393, Presented at the SPE Eastern Regional Meeting, Society of Petroleum Engineers, Charleston, West Virginia, 15-17 September (2005).
Zuluaga, E., Monsalve, J. C., Water vaporization in gas reservoirs. SPE 84829, Presented at the SPE Eastern Regional Meeting, Society of Petroleum Engineers, Pittsburgh, Pennsylvania, 6-10 Sep-tember (2003).
APPENDIX 1
Mathematical Model for Water Vaporization in Gas Condensate Reservoirs
There are a few assumptions that were made to develop the model:
1. Water vaporizes in a one-dimensional, radial, homogenous porous medium and three phases (water, gas and condensate) are present.
2. Water can not flow because the reservoir is at initial water saturation.
3. Pressure declines in a pseudo-steady state fashion.
4. Gas production rate and temperature are constant.
5. All phases are in equilibrium.
6. Tuning the parameters of the EOS is made in an attempt to improve prediction accuracy.
( )
1( )
ρs rρu 0
t r r
∂ ∂
φ − =
∂ ∂ . (A1)
For water ρ is constant (incompressible fluid), therefore:
(
w ww o wo g wg)
g
w o
w ww g wg o wo
s C s C s C t
p
1 p p
r C C C 0
r r r r r
∂
φ + +
∂ ∂ ⎡ ⎛ ⎞⎤ ∂ ∂ ∂ − ⎢ ⎜ + + ⎟⎥= ∂ ⎣ ⎝ ∂ ∂ ∂ ⎠⎦ (A2)
where Cwg, Cww and Cwo are mole fractions of water
in gas phase, aqueous phase and oil phase, respec-tively. Since the mobility of the aqueous phase is assumed to be small compared to the mobility of the gas and oil phases, Eq. (2) becomes:
(
w ww o wo g wg)
g o
g wg o wo
s C s C s C t
p
1 p
r C C 0
r r r r
∂
φ + +
∂ ∂ ⎡ ⎛ ⎞⎤ ∂ ∂ − ⎢ ⎜ + ⎟⎥= ∂ ⎣ ⎝ ∂ ∂ ⎠⎦ (A3)
By replacing Sg=1-So-Sw, the first term on the left
hand side of Eq. (3) changes to:
(
)
(
) (
)
w ww o wo o w wg
w ww wg o wo wg wg
s C s C (1 s s )C t
s C C s C C C t
∂
φ + + − − =
∂
∂ ⎡ ⎤
φ ⎣ − + − + ⎦
∂
(A4)
Using the pseudo-pressure solution for flow of gas through porous media (Dake, 1982):
QT re 3
m(p) m p ln S DQ hkg r
( ) (
4 ) ⎛ ⎞
= − ⎜ ⎟− + +
⎝ ⎠ (A5)
where Q is the gas flow rate, T is temperature, S is skin and DQ is rate dependent skin.
Taking the derivative of Eq. (A5) with respect to the radius in field units:
g m(p) 1422 QT 1
r K h r
∂ =
∂ (A6)
Also from the chain rule:
p g
g g
(m ) p QT 1
k h r p r
∂ ∂
=
∂ ∂ (A7)
Equating Eq. (A6) and (A7):
1422 QT 1 m(p) p Kg h r p r
∂ ∂
=
∂ ∂ (A8)
Knowing that:
( )
pm p 2 dp z
=
∫
(A9)Therefore:
m(p) 2p p z
∂ =
∂ (A10)
Replacing Eq. (9) in (10):
g
p 1 z 1422 QT
r r 2p Kg h ∂
=
∂ (A11)
For the condensate phase, we assume the conden-sate behaves similar to oil, hence:
o o
3 p q B
r 7.08 10 khr− ∂ =
∂ × (A12)
By replacing Eqs. (A12) and (A11) in Eq. (A3), Eq. (A13) becomes:
(
) (
)
o o o g g gw ww wg o wo wg wg wo 3 wg
o g g
o
1422Q T z k
1 q B k 1
s C C s C C C rC rC
t r 7.08 10 k hr− k h r 2p
⎡ ⎤
∂ ⎡ ⎤
φ∂ ⎣ − + − + ⎦− ⎢ + ⎥
×
⎢ ⎥
By simplification of Eq. (13):
(
) (
)
[ ]
w ww wg o wo wg wg
wg o
wo
p 3
z
s C C s C C C t
C
711QT 1 q 1
C 0 h r r 7.08 10− hr r
∂ ⎡ ⎤
φ ⎣ − + − + ⎦
∂
⎡ ⎤
∂ ∂
− ⎢ ⎥− =
φ ∂ ⎢⎣ ⎥⎦ × φ ∂
(A14)
The above equation is non-linear and must be solved numerically. Using the finite difference ap-proximation for water saturation with a time step of n+1:
n n ww wg i wi n 1
wi n 1
ww wg i
wg n 1 wg n 1 i 1 i 1
p p
z z
n 1 ww wg i
n 1 n 1 o
woi 1 woi 1 n 1 ww wg i
n n n 1 n 1
oi wo wg i oi wo wg i n 1
ww wg i
(C C ) S
S
(C C )
C C
711 Q T t
[( ) ( ) ]
2 rh r
(C C )
q t
[C C ]
7.08 2 rh r
(C C )
S (C C ) S (C C )
(C C )
+
+
+ +
+ −
+
+ +
+ −
+
+ +
+ −
=
−
Δ −
φ Δ
+
−
Δ −
× φ Δ +
−
− − −
+
−
(A15)
NOMENCLATURE
Cwg Molar fraction of water in
the gas phase
dimensionless
Cwo Molar fraction of water in
the condensate phase Cww Mole fractions of water in
the aqueous phase
h Thickness ft. k Permeability md Kg Effective gas permeability md m(p) Pseudo pressure psi2/cp pw Well bore pressure psi
Q Gas flow rate MMSCFD qo Condensate production rate STBD
re External radius ft.
S Skin factor dimensionless Sg Gas saturation dimensionless
Swi Initial water saturation dimensionless
So Oil (condensate) saturation dimensionless
T Temperature ºR
t Time day
u Fluid velocity bbl/ft.2 day z Gas deviation factor dimensionless
Greek Letters
g Gas mobility md/cp o Mobility of oil phase md/cp w Water mobility md/cp
Viscosity of fluid cp
ρ Density lb/ft.3
ф Porosity dimensionless