272
Abstract
Profiled Steel Sheet Dry Board (PSSDB) system is a lightweight composite structure comprises Profiled Steel Sheeting and Dry Board connected by self-drilling and self-tapping screws. This study introduced geopolymer concrete, an eco-friendly material without cement content as an infill material in the PSSDB floor system to highlight its effect onto the PSSDB (with full and half-size dry boards) floor system’s stiffness and strength. Experi-mental tests on various full scale PSSDB floor specimens were conducted under uniformly distributed transverse loads. Results illustrate that the rigidity of the panel with geopolymer concrete infill with half-size dry board (HBGPC) increases by 43% relative to that of the panel with normal concrete infill with full-size dry board (FBNC). The developed finite-element modeling (FEM) successfully predicts the behavior of FBGPC model with 94.8% accuracy. Geopolymer concrete infill and dry board size influence the strength panel, infill contact stiffness, and mid-span deflection of the profiled steel sheeting/dry board (PSSDB) flooring system.
Keywords
Lightweight composite, stiffness, strength, rigidity, geopolymer concrete
Experimental Tests on Bending Behavior of Profiled Steel Sheeting
Dry Board Composite Floor with Geopolymer Concrete Infill
LIST OF ABBREVIATIONS
AISI - American Iron and Steel Institute ASCE - American Society of Civil Engineers BS - British Standard
CS - Control Sample DB - Dry Board FB - Full-Board
FBGPC- Full-Board Geopolymer Concrete FBNC - Full-Board Normal Concrete FEM - Finite Element Modeling
HB - Half-Board
HBGPC- Half-Board Geopolymer Concrete HBNC - Half-Board Normal Concrete M - Molarity
OPC - Ordinary Portland Cement PFA - Pulverized Fuel Ash POFA - Palm Oil Fuel Ash PSS - Profiled Steel Sheeting
PSSDB - Profiled Steel Sheeting Dry Board
Mohd Isa Jaffar a*
Wan Hamidon Wan Badaruzzaman b Shahrizan Baharom c
a Ph.D candidate b Professor c Senior Lecturer
Department of Civil and Structural Engi-neering
Faculty of Engineering and Built Envi-ronment
The National University of Malaysia
*Author email:
http://dx.doi.org/10.1590/1679-78252028
1 INTRODUCTION
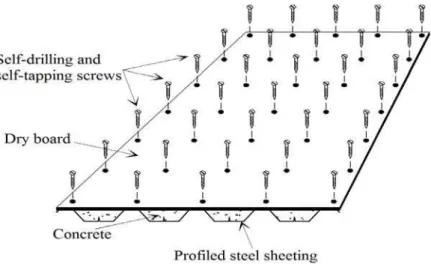
This paper deals with a lightweight, slim, easily constructed composite load-bearing structural system known as the Profiled Steel Sheet Dry Board (PSSDB) system. The system consists of profiled steel sheet (PSS) connected to dry board (DB) by means of drilling and self-tapping screws, see Figure 1. The PSSDB in its original form was envisaged by Wright et al. (1989) as an alternative to the traditional timber plank and joist floor system in the United Kingdom. Research works have since been conducted on the PSSDB system in its applications as flooring, roofing, and walling units (Ahmed et al. (2000 and 2002), Wan Badaruzzaman et al. (2003), Ahmed and Wan Badaruzzaman (2003, 2005 and 2013), Akhand et al. (2004), Gan-domkar et al. (2011, 2012, 2013a and 2013b), Seraji et al. (2012)).
This paper reports on the research work conducted on the PSSDB floor system introduc-ing geopolymer concrete (Abdullah et. al. 2011) infill in the trough of the PSS, as an alterna-tive to the previously adopted normal concrete. The geopolymer concrete, in addition to being eco-friendly is high strength and expected to improve the structural performance of the PSSDB floor system in terms of stiffness and strength. Previous research involving normal concrete infill in PSSDB floors have been reported in Shodiq (2004), Wan Badaruzzaman et al. (2003), Seraji et al. (2013), and Gandomkar et al. (2011 and 2012). Shodiq (2004) has demonstrated that the stiffness and strength of the PSSDB floor system with normal concrete infill is 20.2% and 61.0% higher than the one without infill. This was due to the increased stiffness contribut-ed by the concrete infill and its effect in delaying the onset of local buckling of the upper flange under compression of the PSS.
Figure 1: Typical PSSDB floor system.
274 M.I. Jaffar et al. / Experimental Test on Bending Behavior of Profiled Steel Sheeting Dry Board Composite Floor…
Latin American Journal of Solids and Structures 13 (2016) 272-295
The present study aims to understand the behavior in terms of stiffness and strength of various configurations of the PSSDB floor system (with full and half-size dry boards) under the effect of normal concrete and geopolymer concrete. A PSSDB panel with normal concrete infill will be used for comparison. Full scale experimental tests on simply supported PSSDB floor specimens were conducted under uniformly distributed transverse loads to achieve this aim. Results from one of the experimental specimen were used to validate the finite element model (FEM) which will be utilized for more parametric studies in future.
2 GEOPOLYMER CONCRETE
Ordinary Portland cement (OPC) is a concrete material that is extensively used in the con-struction industry worldwide. However, OPC has a negative effect on the environment. The global production of OPC contributes approximately 1.35 billion tons annually, or approxi-mately 7% of the total greenhouse gas emissions, to the atmosphere (Malhotra, 2002). To miti-gate the total amount of carbon dioxide released by the cement industry, pulverized fuel ash can be used as an alternative cement material to produce geopolymer concrete.
A geopolymer binder can be used as a substitute to cement binder. The use of fly ash min-imizes the dependency on cement materials to produce concrete. Geopolymer has emerged as a new eco-friendly engineering material and serves an important function in the construction industry and in the manufacture of environmentally sustainable construction products (Da-vidovits 2002).
A geopolymer is a binder that consists of a non-organic material formed from solid matter synthesized by the reaction of “aluminosilicate” minerals such as pulverized fuel ash; thus, the type of activator used is significant in the geopolymer production process (Palomo et al. 1999, Fernández-Jiménez dan Palomo 2005, Ruiz-Santaquiteria et al. 2012). To activate the PFA and POFA, an available commercial of sodium silicate (Na2SiO3) and sodium hydroxide
(NaOH) solution was chosen.
A high-rate reaction occurs with the use of dissolved silicate as opposed to the use of alka-line hydroxide. Xu (2000) pointed out that the reaction between materials, as well as amount of solution, both increased when sodium silicate was added to sodium hydroxide (NaOH). So-dium metasilicate (Na2SiO3), which is a mixture of NaOH and sodium silicate, is a widely used
alkaline activator (Pacheco-Torgal et. al. 2008; Rangan 2008). NaOH solution is considerably better than potassium hydroxide (KOH) solution because of the solvency degrees of these sub-stances. In addition, the purity of the solid form of NaOH is between 97% and 99% (Criado et. al. 2010, Rangan 2008, Zheng et. al. 2010).
Hardjito (2005) proposed that the suitable ratio of silicon dioxide (SiO3) to sodium oxide
(Na2O) is 2. The sodium silicate/NaOH solution was prepared 24 hours earlier to achieve
satis-factory geopolymer concrete characteristics. Hardjito and Rangan (2005) stated that the ratio of the silicate/hydroxide solution determines the strength of geopolymer compression. The molar ratio of 2.5 reportedly increases the strength of a geopolymer (Hardjito & Wallah 2004).
3 EXPERIMENTAL SPECIMENS AND MATERIAL PROPERTIES
3.1 Sample Preparation
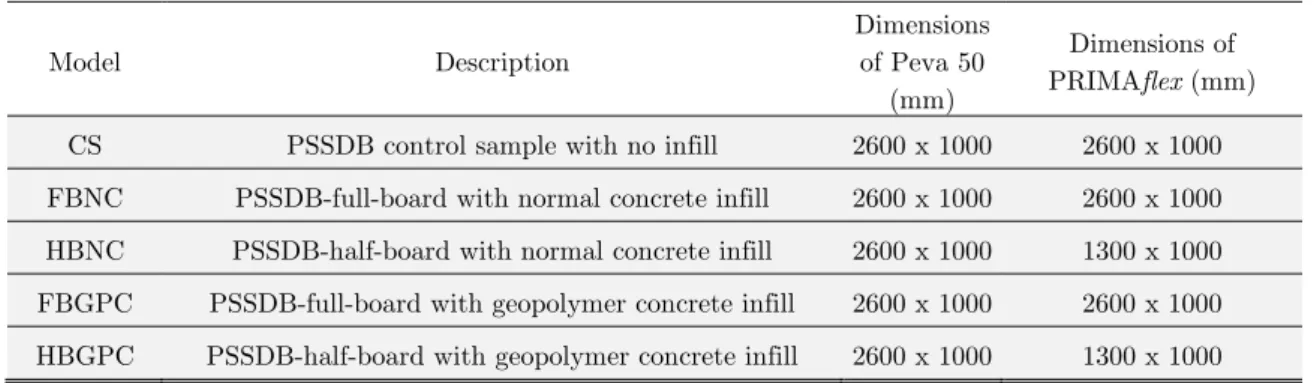
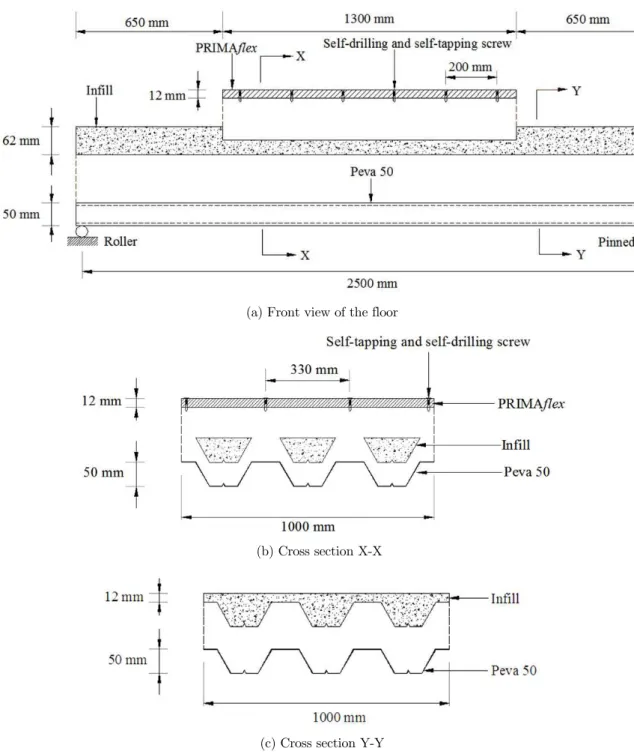
To investigate the behavior of various configurations of simply supported (pin-roller supports) PSSDB floor system of 2500 mm span under the influence of geopolymer concrete infill, five (5) different full scale floor specimens were tested in the laboratory, see Table 1. Flexural bending tests under uniformly distributed transverse loads were performed to obtain the load deflection graphs to facilitate the experimental stiffness values and ultimate load (strength) of these pan-els.
All samples consist of 1 mm thick Peva 50 profiled steel sheet (PSS) with dimensions 2600 mm x 1000 mm. The dry board (DB) used was 12 mm thick PRIMAflex; the size of the full-board was 2600 mm × 1000 mm, and that of the half-full-board 1300 mm × 1000 mm. The DB was attached to the top flanges of the PSS at a distance of 200 mm center-to-center through self-drilling and self-tapping screws (type DS-FH 432).
Model Description
Dimensions of Peva 50
(mm)
Dimensions of PRIMAflex (mm)
CS PSSDB control sample with no infill 2600 x 1000 2600 x 1000 FBNC PSSDB-full-board with normal concrete infill 2600 x 1000 2600 x 1000 HBNC PSSDB-half-board with normal concrete infill 2600 x 1000 1300 x 1000 FBGPC PSSDB-full-board with geopolymer concrete infill 2600 x 1000 2600 x 1000 HBGPC PSSDB-half-board with geopolymer concrete infill 2600 x 1000 1300 x 1000
Table 1: Experimental Specimens.
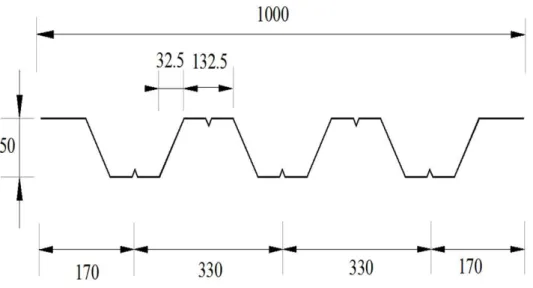
Geopolymer concrete (12M) and normal grade 30 concretes were used as the infill materi-als. The cross-sectional shape and dimensions of the Peva 50 PSS is shown in Figure 2.
276 M.I. Jaffar et al. / Experimental Test on Bending Behavior of Profiled Steel Sheeting Dry Board Composite Floor…
Latin American Journal of Solids and Structures 13 (2016) 272-295
Figure 2: Profiled steel sheeting Peva 50 (all dimensions in mm).
Materials
Thickness /diameter
(mm)
Width and Length
(mm)
Modulus of Elasticity E,
(N/mm2)
Poisson Ratio ν
Ultimate Strength (N/mm2)
Weight of covered area
(N/m2) Profiled Steel Sheeting
(Peva 50) 1.0 1000 × 2600 210 × 10
3 0.3 350 100
Self-drilling and self-tapping
screws (DS-FH 432) 4.2 30.0 _ _ _ _
Dry board
(PRIMAflex) 12.0 1000 ×2600 8030 0.25 22 172
Concrete grade 30 Infill Infill 26 x 103 0.2 30 606.4 Geopolymer concrete 12M Infill Infill 23 x 103 0.13 33 575
Table 2: Materials Specification.
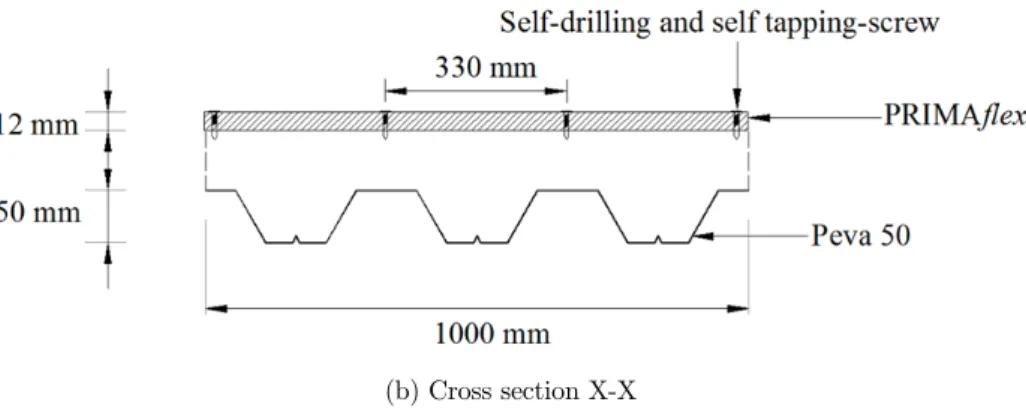
(b) Cross section X-X
Figure 3: PSSDB blown-out schematic diagram (Control sample without infill).
(a) Front view of the floor
(b) Cross section X-X
278 M.I. Jaffar et al. / Experimental Test on Bending Behavior of Profiled Steel Sheeting Dry Board Composite Floor…
Latin American Journal of Solids and Structures 13 (2016) 272-295 (a) Front view of the floor
(b) Cross section X-X
(c) Cross section Y-Y
Figure 5: PSSDB blown-out schematic diagram (Half-Board with infill).
3.2 Testing and Observations
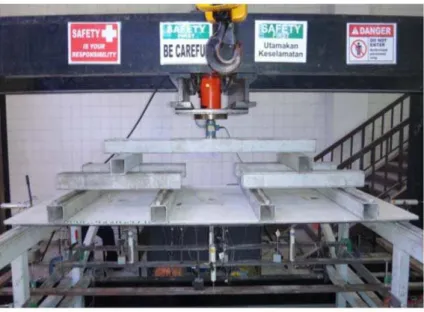
Figure 6: Schematic view of experimental test setup.
Figure 7. Photo of a test panel under testing.
280 M.I. Jaffar et al. / Experimental Test on Bending Behavior of Profiled Steel Sheeting Dry Board Composite Floor…
Latin American Journal of Solids and Structures 13 (2016) 272-295 Figure 8: Positions of transducers in the PSSDB panel.
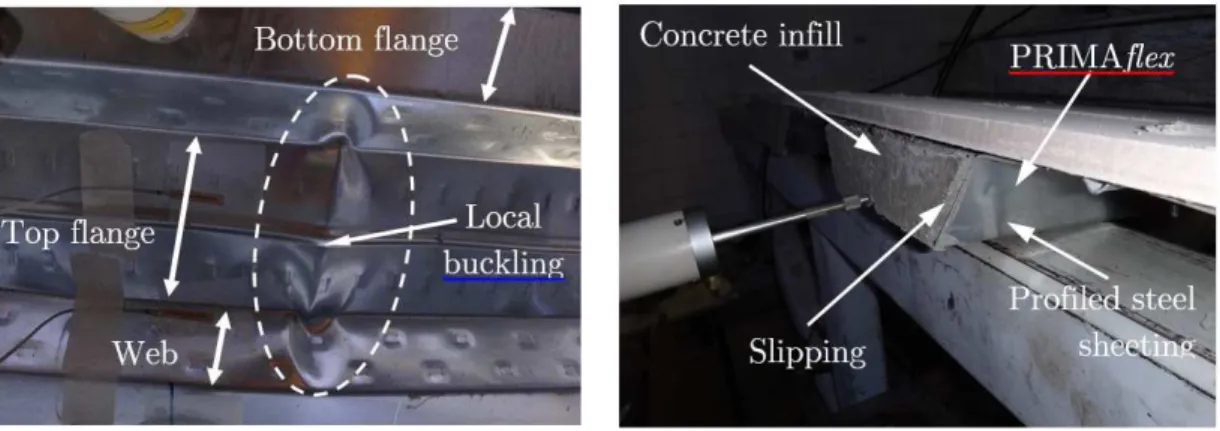
within the vicinity of the mid-span (where compressive stress is the highest) as the samples were loaded until failure. It was noticed that the concrete infill had moved out horizontally, slipping off the PSS at both ends of the samples (see Figure 10).
Figure 9: Buckled shape near the ultimate load. Figure 10: Concrete infill slipping.
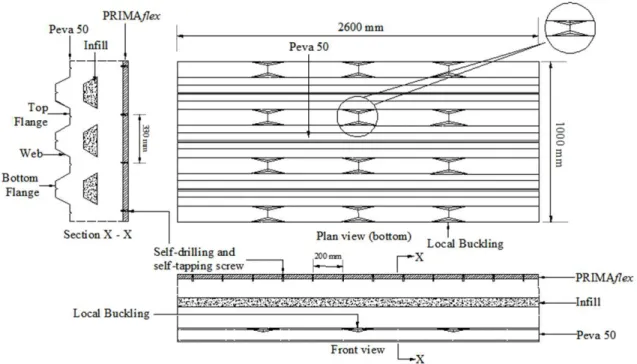
The positions of observed local buckling on the top flanges of the PSS for the Control, Full- and Half-Board with infill (normal concrete/geopolymer concrete) samples are shown in Figures 11, 12 and 13 respectively.
282 M.I. Jaffar et al. / Experimental Test on Bending Behavior of Profiled Steel Sheeting Dry Board Composite Floor…
Latin American Journal of Solids and Structures 13 (2016) 272-295
Figure 12: PSS local buckling positions for full-board with infill panel.
Figure 13: PSS local buckling positions for half-board with infill panel.
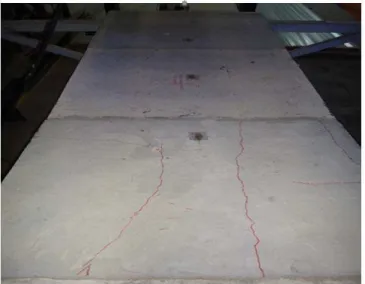
effect of the PSSDB floor under test that has created tensile stress on the top surface of the concrete in the width.
Figure 14: Top view of the half-board sample with crack lines on the concrete top surface at failure.
3.3 Experimental Results and Discussion
3.3.1 Symmetrically Deflection
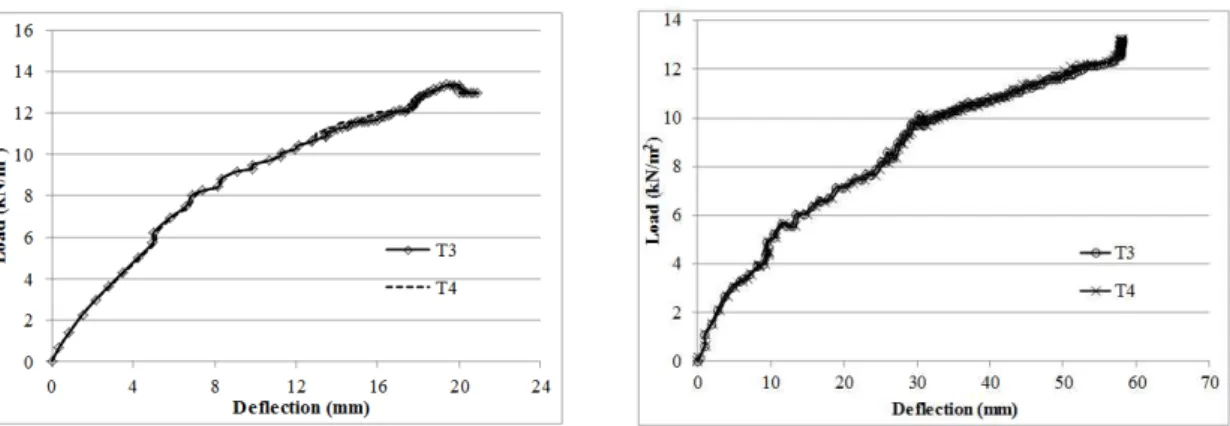
As mentioned before, the use of transducers T3 and T4 is to record the symmetrical deflection at quarter span locations. The load-deflection curves for the five cases are shown in Figures 15 till 19. From the graphs, the deflections are seen almost identical for symmetrically positioned T3 and T4 for all samples. This situation shows the deflections recorded by the transducers at quarter span locations are considered symmetrical, hence verifying the reliability of the exper-imental data.
Figure 15: Symmetrical deflections at quarters span positions for CS sample.
284 M.I. Jaffar et al. / Experimental Test on Bending Behavior of Profiled Steel Sheeting Dry Board Composite Floor…
Latin American Journal of Solids and Structures 13 (2016) 272-295 Figure 17: Symmetrical deflection at quarter span
positions for HBNC sample.
Figure 18: Symmetrical deflection at quarter span positions for FBGPC sample.
Figure 19: Symmetrical deflection at quarter span positions for HBGPC sample.
3.3.2 Load-Mid-Span Deflection Curves
The results of the experimental tests were obtained as shown in the plotted graphs below. Based on BS 8110 Part 1 (1997), the floor limiting deflection (for non-brittle partitions) is span (L)/250. Therefore, the serviceability deflection limit in this case is 10 mm for the span of 2500 mm. All samples underwent linear elastic, followed by non-linear ductile load-deflection charac-teristics before finally reaching ultimate failure. Upon failure, there was a big increase in deflec-tion accompanied by reducdeflec-tion in load. Table 3 gives the experimental rigidity and ultimate load values and load at local buckling load for all the tested samples.
Model Rigidity EI (kNmm2)
Ultimate Load (kN/m2)
Load of Local Buckling
(kN/m2) Mode of Failure
CS 125.17 9.80 7.15 Local buckling at top flange maximum moment mid of PSS (see Figure 11)
FBNC 190.22 12.80 8.00
Local buckling at moment distribution at the top flange mid of PSS
(see Figures 12 and 13)
HBNC 208.53 13.37 8.48
FBGPC 228.87 13.24 8.59
HBGPC 272.10 14.35 9.33
Four different types of load vs mid-span deflection (T1) graphs are drawn from the exper-iments, as illustrated in Figures 20 till 23 to highlight the effect of the various parameters on the behavior of the PSSDB samples.
Figure 20 shows the load-deflection plots for panels with full-board (FB). It can be seen that the rigidity and ultimate load of the FBGPC panel increased by 20% and 3.4% respective-ly relative to that of the FBNC panel, and by 83% and 35% respectiverespective-ly relative to that of the CS panel. This full-board geopolymer concrete, FBGPC panel can sustain up to 3.6 kN/m2 (which is much higher than the normal 1.5 kN/m2 loading for domestic housing) before reach-ing the limitreach-ing deflection.
Figure 21 shows the load-deflection plots for the panels with half-board (HB). The rigidity and ultimate load of HBGPC panel exhibited a remarkable increase of 117% and 46% respec-tively higher than the CS panel and 30% and 7.33% respecrespec-tively higher than the HBNC panel. This half-board geopolymer concrete, HBGPC panel can sustain up to 4.0 kN/m2 (higher that the full-board panel) loading before reaching the limiting deflection.
Figure 20: Graph of the load vs deflection for the CS and various full-board panels.
Figure 21: Graph of the load vs deflection for the CS and various half-board panels.
Figure 22 shows the comparison of the PSSDB panel with full and half-boards infilled with normal concrete. It can be seen that the rigidity and ultimate loads of the HBNC panel in-creased by 10% and 4% relative to that of the FBNC panel, and by 67% and 36% relative to that of the CS panel.
286 M.I. Jaffar et al. / Experimental Test on Bending Behavior of Profiled Steel Sheeting Dry Board Composite Floor…
Latin American Journal of Solids and Structures 13 (2016) 272-295 Figure 22: Graph of the load deflection for the CS
and various normal concrete panels.
Figure 23: Graph of the load deflection for the CS and various geopolymer concrete panels.
The better performing samples are the ones with geoploymer concrete as expected, and this is due to two main reasons, firstly, the E value of the geoploymer concrete and the natural adhesion/bonding in between the geopolymer concrete and the DB and PSS surfaces are better than that of the normal concrete. These factors helped increased the composite EI value of the PSSDB floor system. The better performing half-board compared to full-board is mainly due to the higher rigidity of the PSSDB floor that has more concrete since concrete has higher E val-ue than the DB.
In terms of the floor design, as has been mentioned earlier, the main criteria governing the design of the PSSDB floor would be serviceability limit state. From the above graphs, if the deflection of the floors is limited to L/250, the ratios of the load at that level compared to the ultimate load are given in Table 3, which indicates that the PSSDB floor systems are very safe in terms of structural safety.
3.3.3 Local Buckling Characteristic
The non-linear characteristics observed in all the load-deflection plots are due to the load buck-ling of the PSS under compression as described in section 3.2. It can be seen that the control sample developed local buckling only at the mid span position. On the other hand the infill model (full-board and half-board) demonstrated quarter span position load buckling as well as that took place sometime after the mid span local buckling.
The samples with infill of all types were observed to reduced local buckling almost at the same critical load. It is important to note that the local buckling in the case of these samples also took place at the quarter span positions the ultimate loads in these cases as much higher that the control sample.
3.3.4 Load-Concrete Infill End Horizontal Movement Curves
The measurement of the load-concrete infill end horizontal movements are only recorded for full-board involving normal and geopolymer concrete samples. These horizontal movements in a way reflect the strength of the natural bond in between the concrete infill, PSS and the DB, where the case of higher horizontal deflection value of the concrete infill at the end support indicate lesser bonding strength in between the concrete infill and the other components.
Figure 24 shows the plots of load vs concrete infill end horizontal movement for the FBNC and FBGPC panels. The curves show an increasing outward movement from the early stage of loading until the load was reduced with a drastic increase in the horizontal deflections, imply-ing that the panel had failed. The FBGPC panel recorded an ultimate concrete infill end hori-zontal movement of 0.68 mm, whereas the FBNC panel recorded a value of 3.82 mm. These results clearly show that the natural bonding in between the geopolymer concrete infill and the PSS and DB is stronger than that of the normal concrete. This justified the increase in rigidity of the PSSDB system with geopolymer concrete infill as compared to the normal concrete in-filled PSSDB system.
Figure 24: Relative horizontal deflection.
4. VALIDATION OF THE FEM VIS-À-VIS THE PSSDB LABORATORY EXPERIMENTS
4.1 FEM Development for FBGPC Model
288 M.I. Jaffar et al. / Experimental Test on Bending Behavior of Profiled Steel Sheeting Dry Board Composite Floor…
Latin American Journal of Solids and Structures 13 (2016) 272-295
(2008) software was used for the FEM. The verified FEM would be utilized for further para-metric studies in future.
4.2 Materials Modeling and Elements Selection
This section presents the selections of appropriate elements for the finite element modeling of the PSSDB flooring. Thin-shell S4R-type element in ABAQUS software was applied to both the PSS and DB (Seraji et. al., 2013). The S4R is a three-dimensional four-node (with six de-grees of freedom per node), doubly curved, general-purpose shell, reduced integration and finite membrane strain elements (Figure 25) with bilinear interpolation element.
Figure 25: S4R Thin shell.
The Young’s modulus and Poisson’s ratio of the Peva 50 and Primaflex are shown in Table 2. The PSS and DB are modeled as isotropic materials. Figures 26 (a) and (b) show the consti-tutive models of Peva 50 and PRIMAflex respectively.
Figure 26: Constitutive model of (a) Peva 50 and (b) PRIMAflex.
strength as an infill material in the PSSDB floor system, concrete serves a function in support-ing the applied load (Akhand 2004). In the ABAQUS model, the concretes were assumed to have two failure mechanisms: compressive crushing and tensile cracking. The constitutive curve of the concrete for uniaxial compression was assumed to be linear up to the point of the initial yield stress. The plastic region begins at the point characterized by strain hardening and ends at the ultimate strength and falling branch of the curve known as concrete softening (ABAQUS 2008). In the ABAQUS model, a C3D8R element (3D) and a continuum element with an eight-node linear FEM were selected for the infill concrete (Figure 27).
Figure 27: CD38R element.
The Young’s modulus and Poisson’s ratio of the geopolymer concretes are shown in Table 2. The concretes are modeled as isotropic materials. Figures 28 show the constitutive models of the geopolymer concretes respectively.
Figure 28: Geopolymer concrete constitutive model.
4.3 Modeling the Connections
con-290 M.I. Jaffar et al. / Experimental Test on Bending Behavior of Profiled Steel Sheeting Dry Board Composite Floor…
Latin American Journal of Solids and Structures 13 (2016) 272-295
nections contributed to the composite action of the PSSDB floor system through the transfer of shear between the connected layers of components. The stiffer the connection would result in higher interaction in between the components, thus resulting in more enhanced composite ac-tions. The system may reach a full interaction or partial behavior depending on the connectors’ stiffness, strength and numbers. The stiffer the connection is, the less slip and deflection the floor will experience (Ahmed et al. 2000).
The CARTESIAN connection type in ABAQUS showed in Figure 29 provides independent behavior between two nodes in three local CARTESIAN directions had been adopted by Seraji et al. (2012) to model the connectors. It has twelve nodal degrees of freedom to facilitate three displacements and three rotations in element local direction of both end of the element. The isotropic connector element represents the biaxial shear deformability of the connectors.
Figure 29: Connection type CARTESIAN.
The required input data for the connector were obtained from past studies (Shodiq 2004 and Akhand 2001). The values of spring stiffness respectively the screws are 710 N/mm in X and Z direction, whilst 2.9 N/mm is adopted in Y direction Akhand . The stiffness connection provided by the natural adhesion in between the infill concrete and the PSS and DB are
. x N/mm in X and Z direction, whilst . N/mm in Y direction Shodiq .
4.4 Boundary Conditions
The experimental models were all supported on pin-roller supports. These boundary conditions were modelled in the FEM. This setup indicated that the slab with simply supported condi-tions exhibited outward or inward movements at the support (Vecchio and Tang, 1990).
4.5 Loading
4.6 Convergence Study
Convergence study is a process of finite element analysis. Accurate results must be produced without wasting computer memory and analysis time. Increasing the number of elements caus-es the obtained rcaus-esults to approach the analytical rcaus-esults in mcaus-esh convergence. No significant change occurs in the resulting deflection and stresses at a certain refinement level. Thus, they are considered a converged solution to a particular loading, geometry, and constraint. Mesh convergence has been applied in both linear and non-linear finite element analyses. The accura-cy of its results is affected by the aspect ratio of each element. In general, the higher the divi-sion of the continuum, the smaller the size of each element; thus, accurate results are indirectly produced (Akhand et. al. 2004). Various mesh sizes were applied to obtain the best mesh with already converged result. The sizes of elements employed ranges from 15 mm to 35 mm. Figure 30 shows the converged result for deflection was reached when the mesh size adopted was 30 mm for all elements in the FEM.
Figure 30: Convergence test.
When the aspect ratio of each element increases, the accuracy of the results decreases. Therefore, the selection of the aspect ratio of the elements is important. A trial-and-error method was used in this study to determine the number of meshes, until the results for the mid-span deflection indicated convergence. Table 4 presents the element selections for the FEM of the FBGPC model.
FBGPC model (Full-board with Geopolymer concrete infill) Element Profiled steel sheeting (1 mm thick) S4R thin-shell
Dry board (12 mm thick) S4R thin-shell
Self-tapping and self-drilling screws (4.2 mm Ø) Cartesian
Concrete infill C3D8R (3D)
Boundary condition Pin-roller
Loading Four line loads
Mesh size 30 mm
292 M.I. Jaffar et al. / Experimental Test on Bending Behavior of Profiled Steel Sheeting Dry Board Composite Floor…
Latin American Journal of Solids and Structures 13 (2016) 272-295
4.7 FEM Results Validation and Discussion
Figure 31 shows the results of the laboratory experiments for the FBGPC model and the re-sults of the FEM under bending loads. Both the experimental and FEM rere-sults showed the linear turning into non-linear load-deflection relationship. The FEM modeling was verified by the experimental test results, as can be seen in Figure 17 with an accuracy within 94.8% for EI and 97.46% for the ultimate load. Based on the ASCE Standard (1984) and American Iron and Steel Institute (AISI) (1996), all the discrepancies were still within the limits of permissible variation, which was less than 15%. The results were verified through the FEM, and the model was found to be valid and applicable for parametric studies in future.
Figure 31: Load–mid panel deflection curve of the FBGPC model, experiment and FEM.
Figures 32 (a) and (b) show the local buckling at the top flanges and part of the webs within the vicinity of the mid-span of the PSS in the experiment are also picked up by the FEM. The sample exhibited a plastic behavior in this range, where the strain continuously increased without any increase in the load.
(a) Experimental Model (b) FEM
Figure 32: Local buckling of the PSS.
(a) Experimental Model (b) FEM Figure 33: Horizontal slip of PSSDB infill.
5. CONCLUSION
This study has highlighted a new finding that the use of geopolymer concrete and half size DB are able to enhance the performance of the PSSDB structural behavior compared to the previ-ously adopted normal concrete and full-board PSSDB floor system.
This finding has now introduced a modified PSSDB floor system utilizing geopolymer con-crete infill and half size DB (instead of the normally adopted full size) that has been proven possessing enhanced structural performance that would lead to a more cost effective system. Longer span PSSDB can now be introduced in the construction industry.
The HBGPC panel exhibits a higher by 43% in rigidity and 12% in ultimate load com-pared to the normal FBNC. This increase in performance is due to the better natural adhesion or bonding in between the geopolymer concrete with the DB and PSS compared to the normal concrete. This was what the authors anticipated prior to embarking on this research. The half-board concept would be still provide the advantages provided by the PSSDB system compared to traditional flooring systems without losing its structural performance; in fact increasing it. The PSSDB floor when compared to conventional composite slab system offers advantages such as lighter, slimmer, easier to construct (no temporary propping required) floor system, thus leading to more cost effective floor system.
Finally, the FEM model developed in this paper has been verified by the experimental re-sults and thus could be confidently used to conduct more parametric studies on the PSSDB floor system. The results of the FEM were in very good agreement with the experimental re-sults with an accuracy level of 94.8% for rigidity and 97.46% for ultimate load.
References
A. M. Akhand, W. H. Wan Badaruzzaman and H. D. Wright., 2004. Combined Flexure and Web Crippling of a Low-Ductility High Strength Steel Decking: Experiment and a Finite Element Model. Thin-Walled Struc-tures. Vol. 42, No. 7, pp. 1067-1082.
294 M.I. Jaffar et al. / Experimental Test on Bending Behavior of Profiled Steel Sheeting Dry Board Composite Floor…
Latin American Journal of Solids and Structures 13 (2016) 272-295
A. Palomo, M. T. Blanco-Varela, M. l. Granizo, F. Puertas, T. Vazquez and M. W. Grutzeck., 1999. Chemical stability of cementitious materials based on metakaolin. Cement and Concrete Research, 29, pp. 997–1004. ABAQUS., 2008. Documentation Version 6.8, 2008: Hibbit, Karlson and Sorensen, Inc.
American Iron and Steel Institute (AISI) 1996. Specification for the Design of Cold-Formed Steel Structural Members. Washington, DC.
ASCE Standard 1984. Specifications for the Design and Construction of Composite Slabs. New York: American Society of Civil Engineers.
B. V. Rangan., 2008. By Fly Ash-Based Geopolymer Concrete. Report GC4 of Curtin University pp.1–44. BS 8110 Part 1., 1997. Code for practice for design and construction. Structural use of concrete, British Stand-ards Institution.
C. Ruiz-Santaquiteria, J. Skibsted, A. Fernandez-Jiminez, and A. Palomo., 2012. Alkaline solution/binder ratio as a determining factor in the alkaline activation of aluminosilicates. Cement and Concrete Research, 42(9), pp.1242–1251.
D. B. Raijiwala & H. S. Patil., 2011. Geopolymer Concrete: A Concrete Of Next Decade. Journal of Engineer-ing Research and Studies, JERS Vol.II. Issue I, January-March 2011. pp 19-25.
D. Hardjito, and S. E. Wallah., 2004. On the Development of Fly Ash-Based Geopolymer Mortar. Modern Applied Science 2, pp 3-11.
D. Hardjito, and B. V. Rangan., 2005. Development and Properties of Low Calcium Fly Ash Based Geopoly-mer Concrete. Research Report GC1. Faculty of Engineering Curtin University of Technology, Perth. Austral-ia.
D. Hardjito., 2005. Studies on Fly Ash-Based Geopolymer Concrete, Doctor Philosophy Thesis, Curtin Univer-sity.
E. Ahmed and W.H. Wan Badaruzzaman., 2003. Equivalent Elastic Analysis of Profiled Metal Decking using Finite Element Method. International Journal of Steel Structures. Vol. 3, No. 1, pp. 9–17.
E. Ahmed and W.H. Wan Badaruzzaman., 2005. Finite Element Prediction on the Applicability of Profiled Steel Sheet Dry Board Structural Composite System as a Disaster Relief Shelter. Journal of Construction and Building Materials. Vol. 19, No. 4, pp. 285-295.
E. Ahmed and W.H. Wan Badaruzzaman., 2013. Vibration Performance of Profiled Steel Sheet Dry Board Composite Floor Panel, KSCE Journal of Civil Engineering. Vol. 17, No. 1, pp. 133-138.
E. Ahmed, W.H. Wan Badaruzzaman and H.D. Wright., 2000. Experimental and Finite Element Study of Profiled Steel Sheet Dry Board Folded Plate Structures. Thin-Walled Structures. Vol. 38, No. 2, pp. 125-143. E. Ahmed, W.H. Wan Badaruzzaman and H.D. Wright., 2002. Two Way Bending Behaviour of Profiled Steel Sheet Dry Board System. Thin-Walled Structures. Vol. 40. No. 11, pp. 971-990.
F. Gandomkar, W.H. Wan Badaruzzaman and S.A. Osman., 2011. The Natural Frequencies of Composite Profiled Steel Sheet Dry Board with Concrete Infill (PSSDBC) System. Latin American Journal of Solids and Structures. Vol. 8, No. 3, pp. 351-372.
F. Gandomkar, W.H. Wan Badaruzzaman and S.A. Osman., 2012. Dynamic Response of Low Frequency Pro-filed Steel Sheet Dry Board with Concrete infill (PSSDBC) Floor System under Human Walking Load. Latin American Journal of Solids and Structures. Vol. 9, No. 3, pp. 21-41.
F. Gandomkar, W.H. Wan Badaruzzaman, S.A. Osman and A. Ismail., 2013a. Experimental and Numerical Investigation of the Natural Frequencies of the Composite Profiled Steel Sheet Dry Board (PSSDB) System. Journal of the South African Institution of Civil Engineering. Vol. 55, No. 1, pp. 11-21.
F. J. Vecchio & K. Tang., 1990. Membrane action in reinforced concrete slab. Canadian Journal of Civil Engi-neering. 17: 686-697.
F. Pacheco-Torgal, J. Castro-Gomes & S. Jalali., 2008. Alkali-Activated Binders. A Riview Part 2: About Materials and Binders Manufacture. Journal of Construction and Building Materials, 22, pp 1315-1322
Fernández-Jiménez and Palomo., 2005. Composition and microstructure of alkali activated fly ash binder : Effect of the activator. Cement and Concrete Research, 35(10), pp 1984–1992.
H. B. M. Shodiq., 2004. Performance of new profiled steel sheeting dry board floor system with concrete infill. Ph.D Thesis. Universiti Kebangsaan Malaysia.
H. D. Wright, H. R. Evans & C. A. Burt., 1989. Profiled steel sheet/dry boarding composite floors. The Struc-tural Engineer 67(7): 114–129.
H. Xu., 2000. The geopolymerisation of alumino-silicate minerals. , Int. J. Miner. Process. 59(3), pp. 247–266. Hume Cemboard Bhd. 2007. PRIMAflex: General purpose cladding sheet. Petaling Jaya.
J. A. Dobrowolski., 1998. Concrete construction handbook, 4th Ed. New York: Mc. Graw-Hill.
L. Zheng, W. Wang & Y. Shi., 2010. The Effect of Alkaline Dosage and Si/AI Ratio on the Immobilization of Heavy Metals in Municipal Solid Waste Incineration Fly ash Based Geopolymer. Journal of Chemosphere, 79. pp 665-671.
M. A. Crisfield., 1982. Local Instabilities In The Non-Linear Analysis Of Reinforced Concrete Beamsand Slabs. Proc. Instn. Civ. Engrs. Part 2, 73. pp. 135-145.
M. Criado, A. F. Jiménez & A. Palomo., 2010. Effect of Sodium Sulfate on the Alkali Activation of Fly Ash. Journal of Cement and Concrete Composite, 32(8), pp 589-594
M. M. A. Abdullah, H. Kamarudin, H. Mohammed, I. Khairul Nizar, A. R.Rafiza And Y. Zarina. 2011.The Relationship Of NaOh Molarity, Na2SiO3/Naoh Ratio, Fly Ash/Alkaline Activator Ratio, And Curing Tem-perature To The Strength Of Fly Ash-Based Geopolymer. Advanced Materials Research Vols. 328-330 pp 1475-1482.
M. M. A. Abdullah., 2013. Basic of Geopolymer, Theory & Practice Handbook. Universiti Malaysia Perlis. M. Seraji, W. H. Wan Badaruzzaman, & S.A. Osman., 2012. Experimental Study on the Compressive Mem-brane Action in Profiled Steel Sheeting Dry Board (PSSDB) Floor System. International Journal on Advanced Science Engineering and Information Technology 2(2012 No. 2): 46:48.
M. Seraji, W.H. Wan Badaruzzaman and S.A. Osman., 2013. Membrane Action in Profiled Steel Sheeting Dry Board (PSSDB) Floor Slab System. Journal of Engineering Science & Technology. Vol. 8, No. 1, pp. 57-68. P.J. Davidovits., 2002. Environmentally Driven Geopolymer Cement Applications . Geopolymer Conference, October 28-29, 2002, (6), Geopolymer Institute, 02100 Saint-Quentin, France. pp.1–9.
V. M. Malhotra., 2002. "Introduction: Sustainable Development and Concrete Technology." ACI Concrete International 24(7): 22.
W. H. Wan Badaruzzaman, M. F. M. Zain, A.M. Akhand and E. Ahmed., 2003. Dry Board as a Load Bear-ing Element in the Profiled Steel Sheet Dry Board Floor Panel System - Structural Performance and Applica-tions. Journal of Construction and Building Materials. Vol. 17, No. 4, pp. 289-297.