Mu- and Kappa-Opioid Receptors
Jennifer M. Johnston, Marta Filizola*
Department of Structural and Chemical Biology, Icahn School of Medicine at Mount Sinai, New York, New York, United States of America
Abstract
The recent mu-opioid receptor (MOPr) and kappa-opioid receptor (KOPr) crystal structures have inspired hypotheses of physiologically relevant dimerization contacts, specifically: a closely packed interface involving transmembrane (TM) helices TM5 and TM6, and a less compact interface, involving TM1, TM2, and helix 8 (H8). While the former was only found in MOPr crystals, similar arrangements of the latter were identified for both KOPr and MOPr. The relevance of these interfaces outside of a crystal lattice is called into question by the possibility that they might be influenced by the specific crystallization conditions. In this study, we have employed umbrella sampling molecular dynamics simulations of coarse-grained representations of the interacting MOPr or KOPr crystallographic structures, in the absence of the T4 lysozyme, and in an explicit lipid-water environment, to determine the strength of receptor dimerization at the different crystallographic interfaces. We note that the shape of the interface plays a dominant role in the strength of the interaction, and the pattern of contacting residues defines the shape of the potential of mean force. This information can be used to guide experiments aimed at exploring the role of dimerization in opioid receptor function.
Citation:Johnston JM, Filizola M (2014) Differential Stability of the Crystallographic Interfaces of Mu- and Kappa-Opioid Receptors. PLoS ONE 9(2): e90694. doi:10.1371/journal.pone.0090694
Editor:Paolo Carloni, German Research School for Simulation Science, Germany
ReceivedDecember 11, 2013;AcceptedFebruary 5, 2014;PublishedFebruary 28, 2014
Copyright:ß2014 Johnston, Filizola. This is an open-access article distributed under the terms of the Creative Commons Attribution License, which permits unrestricted use, distribution, and reproduction in any medium, provided the original author and source are credited.
Funding:Funding for this work was provided, in whole or in part, by National Institutes of Health grants DA026434 and DA034049. JMJ was supported in part by NIDA grant T32 DA007135. The funders had no role in study design, data collection and analysis, decision to publish, or preparation of the manuscript.
Competing Interests:The authors have declared that no competing interests exist. * E-mail: [email protected]
Introduction
Following several breakthroughs in crystallization techniques for G Protein-Coupled Receptors (GPCRs), particularly T4 lysozyme (T4L)-stabilized constructs and lipid cubic phase environments [1– 3], several GPCR crystallographic structures have been solved in recent years, including those of opioid receptors [4–7]. While the majority of currently available crystal structures of GPCRs display single protomers in the asymmetric unit of the crystal, some of them, including those of the mu-opioid receptor (MOPr) and the kappa-opioid receptor (KOPr), have revealed parallel arrange-ments of interacting receptors. It is tempting to speculate that these parallel arrangements correspond to physiologically relevant dimeric configurations, notwithstanding the possibility that exper-imental conditions for crystallogenesis might have altered the receptor-receptor interactions that occur naturally in a living cell. The two interfaces revealed by the MOPr crystals are i) a tightly packed interface involving transmembrane (TM) helices TM5 and TM6 from both interacting protomers (henceforth called the TM5,6/TM5,6 interface), and ii) a more loosely packed arrange-ment, with dominant symmetric contacts between TM1 and H8 in the adjacent protomers, as well as contacts between TM1 on one protomer, and TM2 on the adjacent protomer (henceforth called the TM1,2,H8/TM1,2,H8 interface). A similar, albeit not identical, TM5,6/TM5,6 interface has also been seen in five independent crystal structures of the chemokine receptor CXCR4 [8], which is another member of the same peptide subfamily of GPCRs to which opioid receptors belong. To the best of our knowledge, the physiological relevance of this putative dimeric interface simultaneously involving TM5 and TM6 has yet to be
demonstratedin vivo. On the other hand, evidence exists from both biophysical and biochemical (mostly cross-linking) experiments that the TM5 helix may be part of a physiologically relevant, dimer interface for several GPCRs, including the MOPr cognate system, DOPr [9]. However, these interfaces typically involve TM4 and the intracellular loop 2 (IL2), in addition to TM5 (e.g., see [10,11]).
concluded that, with the exception of the class F Smoothened receptor, none of the analyzed crystallographic interfaces of GPCRs exhibit the signature geometrical packing and evolution patterns expected for high-affinity, physiologically-relevant inter-faces. While this is interesting, the results of an evolutionary analysis are limited by the number of relatively close sequence homologs that are available for the alignment, the uniformity of the distribution of identities in the homologs, and the simplicity of a sequence-based approach, which takes into account neither the energetics underlying the dimerization process, nor the role of the environment.
In this study, we sought to investigate both the viability and relative stability of the crystallographic interfaces identified for the MOPr and the KOPr in an explicit lipid-water environment, and in the absence of the T4L, in an effort to start prioritizing mutagenesis experiments aimed at exploring the role of dimeriza-tion in opioid receptor funcdimeriza-tion.
Materials and Methods
System Setup
Missing loop segments from the crystallographic structures of the mouse MOPr (PDB ID: 4DKL) [5] (residues 263–270) and chain A of the human KOPr (PDB ID: 4DJH) [6] (residues 262 and 301–307) were built using ROSETTA version 2.2 [17]. The conformation for IL3 was selected as the minimum energy structure reported by ROSETTA. For MOPr, the lowest energy conformation that also did not interfere (inter-lock) with the IL3 of the adjacent receptor at the crystallographic TM5,6/TM5,6 interface was selected. Throughout this article we use the Ballesteros-Weinstein numbering scheme [18] to facilitate com-parison between the receptor subtype TM regions. Accordingly, the first number of this scheme indicates the TM helix in which the residue in question resides, and the second number indicates the position of the residue relative to the most conserved residue in the helix, which is always numbered 50 (e.g., 1.45 indicates a residue 5 positions upstream from the most conserved residue in TM1).
The receptors, without N- and C-termini or ligands, were converted to a coarse-grained (CG) representation under the MARTINI force field (version 2.1) [19–21] and a modified elastic network was applied, as we have described, in detail, in earlier publications [22]. Unlike other GPCRs, which exhibit palmitoy-lated cysteines at the C-terminus, mutagenesis experiments [23,24] have demonstrated that the only relevant site for palmitoylation in MOPr is at a specific cysteine position in the cytoplasmic side of TM3. Thus, receptors were palmitoylated at the C3.55 position, with a coarse-grained palmitoyl chain consisting of 4 C1-type beads, with a bond length of 0.47 nm, a force constant of 1250 kJ mol21
nm22
and angles of 180u, with a force constant 25 kJ mol21
. The ligand-free, CG systems were aligned onto the pairs of receptors associated along their crystallographic two-fold axes through two different interfaces involving TM1, TM2, and H8 or TM5 and TM6 in the case of MOPr, and one interface involving TM1, TM2, and H8 in the case of KOPr (Figure 1). These associated receptors were embedded into an explicit, MARTINI CG 1-palmitoyl,2-oleoyl-sn-glycero-3-phosphocholine (POPC)/ 10% cholesterol membrane, solvated with the MARTINI CG water model, and neutralizing counterions were added for each system. The resulting systems were minimized and equilibrated with harmonic restraints on protein backbone beads, of decreasing strength over 10 ns.
Umbrella Sampling Simulations
Umbrella sampling simulations were carried out for the MOPr TM1,2,H8/TM1,2,H8, MOPr TM5,6/TM5,6, and KOPr TM1,2,H8/TM1,2,H8 systems, separately. The starting configu-rations for each umbrella sampling window simulation were taken from an unconverged metadynamics simulation in the same manner as we previously reported in the literature [25]. These starting configurations of,15,000 beads (the absolute value varies slightly between interface systems, but not between windows) were taken at varying values of separation (r) of the protomers, with spacing between windows of 0.04 nm, and the total number of windows required for complete sampling varied between 76 and 92 for the different systems. The receptors were separated along the line connecting the centers of mass (COMs) of their TM regions by adding a Gaussian bias. The orientation of each crystallographic interface was maintained during the separation by two harmonic restraints centered on the values of the angles,aand
b, as defined in the crystal structures and illustrated in panel B of Figure 1. After minimization, 800 ns of simulation were performed with a third harmonic force restraining the value ofrbetween the COM of the two protomers to that from the starting frame, and with a time step of 20 fs. Periodic boundary conditions were employed, and neighbor searching was performed every 10 steps. The Shift algorithm was used for electrostatic interactions with a cut-off of 1.2 nm. A single cut-off of 1.2 nm was used for Van der Waals interactions. Temperature and pressure coupling used the V-rescale and the Berendsen algorithms respectively. The range of r explored, and the orientation for the different interfaces and receptors are outlined in Table 1. All simulations were carried out using Gromacs version 4.0.5 [26], enhanced with the Plumed plugin [27].
Analyses of Simulations
From the simulations in each window the value ofrduring the last 750 ns of simulation was collected. To remove the influence of the harmonic restraints on each window, each data point was reweighted by the sum of the exponential of the harmonic restraints applied to bothaand bat that point. The reweighted data were then combined using the weighted histogram analysis method (WHAM) [28,29] through an established, web-accessible implementation (http://membrane.urmc.rochester.edu/content/ wham-releases) to calculate the potential of mean force (PMF) as a function of the separation between the COMs of the TM regions of interacting receptors. We have compared the PMFs from different interfaces by aligning the plateaus of the curves to zero; the plateaus represent the values ofrat which the receptors are no longer interacting with one another (indicated by the gray region denoted ‘monomer’ in the plot in Figure 2). Error analyses were derived from the method described by Zhu and Hummer [30]. Specifically, errors were calculated based on the statistical variance of the raw data histograms estimated by block averages in increments of 200 ns. The dimerization constant, KD, and the free
energy, DG, were calculated using an approach pioneered by Roux and colleagues [31,32], specifically: equations (4) and (8) and a surface density for the POPC/cholesterol membrane patch of NL/A = 1.65610
6
mm22, as recently described in the literature [22]. The free energy was calculated as DG =2RT ln (KD6 NL/A) at T = 300 K. Analyses of contact maps and energetic
interactions were performed using Gromacs analysis tools [26].
Results and Discussion
stability of the three different crystallographic interfaces of opioid receptors that have been characterized to date. Specifically, we evaluated the strength of dimerization of MOPr and KOPr interfaces involving TM1, TM2, and H8, as well as the MOPr interface involving TM5 and TM6.
Relative Stability of the Crystallographic Interfaces of MOPr
In the more compact TM5,6/TM5,6 crystallographic interface of MOPr, compared to that involving TM1, TM2, and H8, contacts are formed along the length of both of the TM5 and TM6
membrane spanning helices and the separation between the COMs of the helix bundles is ,3.3 nm. The interface also comprises some involvement of the IL3, though this is somewhat cluttered by the inclusion of the T4L between residues R263 and E270 in each MOPr protomer, which contributes slightly to the interacting surface. The total buried solvent accessible surface area (SASA) in this interface between the MOPr protomers is 1606 A˚2 (with 114 A˚2contributed by the T4L) compared to the 615 A˚2of the alternative TM1,2,H8/TM1,2,H8 crystallographic interface, which shows no involvement of the T4L, and a ,4.0 nm separation between the COMs of the helical bundles [5].
Figure 1. The crystallographic structures of the opioid receptors indicate putative interfacial interactions. A) Side view of crystallographic dimers. MOPr protomers interacting at a TM1,2,H8/TM1,2,H8 interface colored in red and pink from PDB ID: 4DKL. MOPr protomers interacting at a TM5,6/TM5,6 interface in blue and light blue, also from PDB ID 4DKL, and KOPr protomers interacting at a TM1,2,H8/TM1,2,H8 interface are shown in green and light green, from PDB ID: 4DJH. T4L is shown in gray in all cases. B) Extracellular view of crystallographic dimers, colored as above. Cyan overlay shows collective variables used to define the interface between protomer 1 and protomer 2 (P1 and P2). The PMF is calculated as a function of the separation(r)between the COMs of the TM regions of the two protomers. The orientation of the interface was maintained during the simulations by two harmonic restraints centered on the values of the angles,aandb. The angleais the projection on the x, y plane of the angle calculated between the COM of the helix defining the interface, the COM of the helical bundle of the protomer bearing this helix (P1) and the COM of the adjacent protomer (P2). Anglebis the equivalent angle for the adjacent protomer.
doi:10.1371/journal.pone.0090694.g001
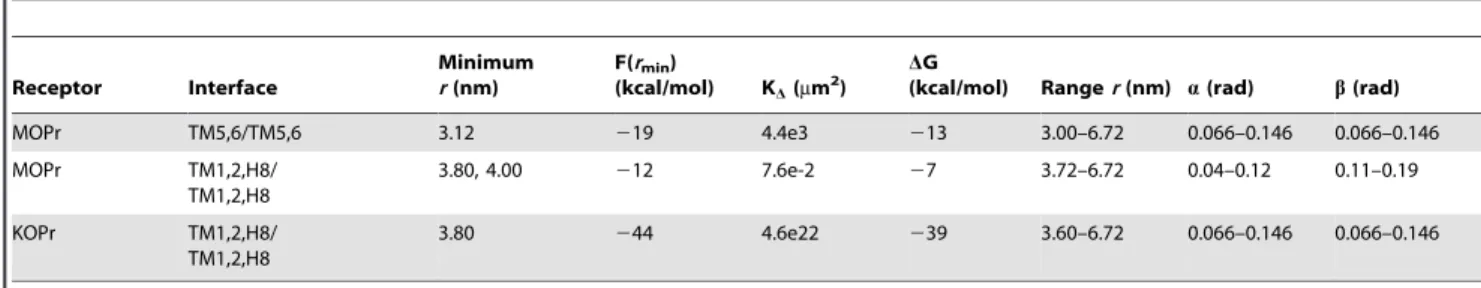
Table 1.Key results and methodological aspects of PMF curves in Figure 2.
Receptor Interface
Minimum r(nm)
F(rmin)
(kcal/mol) KD(mm2) D G
(kcal/mol) Ranger(nm) a(rad) b(rad)
MOPr TM5,6/TM5,6 3.12 219 4.4e3 213 3.00–6.72 0.066–0.146 0.066–0.146
MOPr TM1,2,H8/
TM1,2,H8
3.80, 4.00 212 7.6e-2 27 3.72–6.72 0.04–0.12 0.11–0.19
KOPr TM1,2,H8/
TM1,2,H8
3.80 244 4.6e22 239 3.60–6.72 0.066–0.146 0.066–0.146
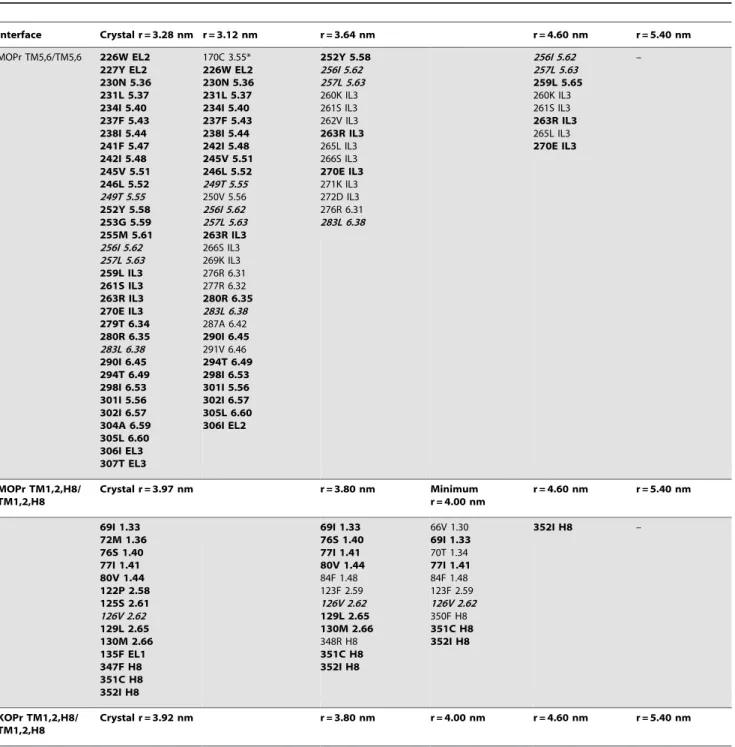
PMF free-energy curves for the two crystallographic interfaces of MOPr involving TM1, TM2, and H8, or TM5 and TM6 were derived from umbrella sampling simulations. These curves are shown in Figure 2 in red and blue colors, respectively. Inspection of these curves, as well as the values reported in Table 1, confirm a stronger free-energy of dimerization between receptors at the more compact crystallographic interface involving TM5 and TM6 than that involving TM1, TM2, and H8. In Figure 3, we have shown inter-protomer contact patterns for the minima from the PMF curves (identified in Figure 2 by dashed lines) and then at two large separation values (r= 4.60 nm and r= 5.40 nm). Contacts were defined as residues with an inter-protomer contact distance of less than 4.8 A˚ . The structures of the minima on which the contact maps are based were derived from clustering the frames of the simulation corresponding to each of the minima and taking the medoid of the largest cluster to be a representative structure.
For the TM5,6/TM5,6 interface of MOPr, close receptor packing leads to a densely populated interaction map involving residues spanning the entire TM5 and TM6 helices at short distances (r,3.64 nm). The corresponding PMF curve (blue line in Figure 2) shows a minimum atr= 3.12 nm, with shallower minima at r= 3.28 nm (corresponding to the crystal structure) and r= 3.64 nm. As shown in Table 2 and Figure 3, this contact
interface is especially extensive at the minimum distance of r= 3.12 nm. Interactions span the full length of TM5 and TM6, as
well as some of the residues comprising IL3 or EL2. The buried surface area in the coarse-grained minimum (at r =3.12 nm) is 16% of the entire monomeric surface. The corresponding value of buried surface area (i.e. T4L removed, and missing loop IL3 rebuilt) for the complete atomistic TM5,6/TM5,6 crystallographic dimer is 12%, and roughly equivalent to the SASA of the corresponding coarse-grained minimum in the PMF at r = 3.28 nm, as might be expected. Many of these close contacts are lost after the separation between the protomers approaches ,3.64 nm, and beyond this, the direct inter-protomer interactions are dominated by residues in the intracellular ends of TM5, TM6 and the IL3. Five of the IL3 residues at this interface are not present in the crystallographic structure, having been replaced by the T4L insertion. This persistent interaction precludes a smooth plateau in the PMF free-energy of the TM5,6/TM5,6 interface at values ofrlarger than 3.64 nm, and prevents clear establishment
of truly monomeric states for the receptors until well after this distance value. While the minimum of the PMF curve for MOP TM5,6/TM5,6 is deep, it is also narrow, which suggests that the packing of two protomers at this interface must be precise before a strong dimer would be formed under non-biased conditions. It must also be noted that while the elastic network used to maintain the secondary and tertiary structures is likely to impact the PMF, this effect would largely depend on the participation of loop regions at the interface, since the TM regions vary very little during simulation. The TM5,6/TM5,6 interface in MOPr contributes only ,20% of both the SASA and the interaction energy between the protomers during the simulation of the lowest dimeric minimum, suggesting that the elastic network might influence approximately,20% of the corresponding PMF.
Although the large number of contacting residues in the TM5,6/TM5,6 interface between protomers of the MOPr makes it significantly more stable than the TM1,2,H8/TM1,2,H8 crystallographic interface of the MOPr, the analyses herein cannot confirm that either interface would form spontaneously by self-association in an explicit membrane environment. If the TM5,6/ TM5,6 interface did form spontaneously, analysis of the contacts formed at the largest separation value before interface disruption (see Table 2 column corresponding tor= 4.60) suggests residues that might contribute more significantly than others to its stability, and that might be worthy of experimental testing. Notably, although the engineered palmitoyl chain at position C3.55 of one of the two MOPr protomers appears to form contacts with residues I2385.44 and I2425.48 of the adjacent protomer at the
representative dimeric minimum of the TM5,6/TM5,6 interface, these contacts are not retained at values ofrbeyond the minimum state, thus suggesting only a minimal contribution of the palmitoyl chain to the stability of the TM5,6/TM5,6 interface. Some trapping of cholesterol against TM4 by the palmitoylated C3.55 residue, recently suggested by a homology model of the MOPr [24], is observed in some of the windows of the simulations discussed herein, but the molecule is not located close enough to directly affect the TM5,6/TM5,6 interface.
Relative Stability of the Crystallographic Interfaces of MOPr and KOPr Involving TM1, TM2, and H8
The TM1,2,H8/TM1,2,H8 crystallographic interfaces of MOPr and KOPr are very similar interfaces with a separation between the COMs of the two protomers measured to be,4 nm in both cases. However, they are not identical. The most prominent difference between these interfaces stems from the conformation of TM1, being curved slightly backward toward the TM7 of the bundle in MOPr, but very straight, and protruding outwards from the rest of the bundle, in KOPr. As a consequence, there is a larger buried SASA at this interface in KOPr (1,100 A˚2) [6] compared to MOPr (615 A˚2) [5], and a slightly different
arrangement of the protomers relative to one another. In the KOPr, the principal axes of each of the two protomers comprising the dimer are parallel to one another, meaning that both protomers are expected to sit perpendicular to the membrane environment. For MOPr, the principal axes of each of the two protomers at the TM1,2,H8/TM1,2,H8 interface are offset by a torsion angle of approximately 20u, which may give rise to local differences in the membrane to accommodate each protomer.
Not surprisingly, inter-protomer interactions at the TM1,2,H8/ TM1,2,H8 interface are different for the two receptor subtypes, with KOPr exhibiting a) a more significant degree of contact at the extracellular terminus of TM1, which interacts directly with TM2 and EL1 on the adjacent protomer, and b) more significant inter-protomer contacts for H8, than observed in MOPr (see Table 2).
Figure 2. PMFs calculated from the umbrella sampling, coarse-grained simulations for each of the different interfaces: MOPr TM1,2,H8/TM1,2,H8 is shown in red (error bars in pink), MOPr TM5,6/TM5,6 is shown in blue (error bars in light blue), and KOPr TM1,2,H8/TM1,2,H8 is in green (error bars in light green).
The grayed region denoted ‘monomer’ is that in which the PMF curves were aligned to free-energy = 0. The dashed lines, shown at r = 3.12 nm, 3.64 nm, 3.80 nm, 4.00 nm, 4.60 nm, and 5.40 nm, indicate the values of separation at which the inter-protomer contacts were assessed. doi:10.1371/journal.pone.0090694.g002
The observed differences in the crystallographic contact map also render it unsurprising that, despite ostensibly involving the same helices, the two crystallographic interfaces of MOPr and KOPr exhibit very different PMF curves, in terms of both shape and depth (see Figure 2). This results in significantly different relative free-energies of dimerization (see Table 1). The PMF curve for MOPr has two minima, at approximately the same depth, with values ofr =3.80 and 4.00 nm and similar contact map profiles. The PMF curve is very much deeper for KOPr (shown in green) than for MOPr (shown in red), and the estimated free-energy of the interface suggests that the KOPr TM1,2,H8/TM1,2,H8 interface is very much more stable than for MOPr. If we examine the contacts between receptors at larger separations, as reported in Table 2, there are significant contacts for KOPr at r = 5.40 nm. These interactions involve the extracellular ends of TM1 and TM2, and they continue to contribute to the free-energy of dimerization at this interface, even at large protomer-protomer separation. In contrast, the most persistent inter-protomeric contact at the TM1,2,H8/TM1,2,H8 interface of MOPr is seen at r= 4.60 nm and is the terminal residue, I352, in H8. The paucity of inter-protomer interactions at this separation corre-sponds with the abrupt plateau in the shape of the PMF curve for the MOPr TM1,2,H8/TM1,2,H8 interface beyondr= 4.50 nm.
Taken together, these observations strongly suggest that the shape of the TM1,2,H8/TM1,2,H8 interface, particularly the position of TM1, either pointing away from the rest of the helical bundle as in KOPr, or toward the helical bundle, as in MOPr, influences the shape of the PMF describing the dimerization between receptors. However, since it is known that TM1 can adopt more than one conformation even within the same crystal lattice, as seen in the case of turkeyb1-adrenergic receptor [33], we cannot rule out the possibility of changes in the conformation of TM1 of KOPr. The elastic network, used to maintain the secondary and tertiary structure of the receptors under the CG force field during the simulations presented herein, prevents sampling of these different conformations. If the TM1 adopts the most extended conforma-tion, for either receptor subtype, during unbiased association between protomers, we speculate that the most stable receptor dimers would be formed.
Sequence comparison between the mouse MOPr and human KOPr also indicates some variation in the regions of TM1 and TM2 that may contribute to the differential stability of the TM1,2,H8/TM1,2,H8 interface for the two opioid receptor subtypes. Specifically, in the crystallographic structures and in the dimeric minima of KOPr and MOPr, variations in the contacts correspond to: a) different residues at positions 1.29 (a
Figure 3. Contact surfaces (shown for one protomer in dimeric arrangements) at the values of r indicated by dashed grey lines in Figure 2. The crystal structure contact surfaces are shown (on grey background) and additional distances are r = 3.12 nm, r = 3.64 nm and r = 4.60 nm for TM5,6/TM5,6 MOPr interface, and r = 3.80 nm, r = 4.00 nm and r = 4.60 nm for MOPr and KOPr at TM1,2,H8/TM1,2,H8, with the addition of r = 5.40 nm for KOPr.
Table 2.Interacting residues at key values of separation (r) in the PMF (shown by dashed lines in Figure 2).
Interface Crystal r = 3.28 nm r = 3.12 nm r = 3.64 nm r = 4.60 nm r = 5.40 nm
MOPr TM5,6/TM5,6 226W EL2 227Y EL2 230N 5.36 231L 5.37 234I 5.40 237F 5.43 238I 5.44 241F 5.47 242I 5.48 245V 5.51 246L 5.52 249T 5.55 252Y 5.58 253G 5.59 255M 5.61 256I 5.62 257L 5.63 259L IL3 261S IL3 263R IL3 270E IL3 279T 6.34 280R 6.35 283L 6.38 290I 6.45 294T 6.49 298I 6.53 301I 5.56 302I 6.57 304A 6.59 305L 6.60 306I EL3 307T EL3
170C 3.55*
226W EL2 230N 5.36 231L 5.37 234I 5.40 237F 5.43 238I 5.44 242I 5.48 245V 5.51 246L 5.52 249T 5.55 250V 5.56 256I 5.62 257L 5.63 263R IL3
266S IL3 269K IL3 276R 6.31 277R 6.32
280R 6.35 283L 6.38 287A 6.42
290I 6.45
291V 6.46
294T 6.49 298I 6.53 301I 5.56 302I 6.57 305L 6.60 306I EL2
252Y 5.58 256I 5.62 257L 5.63 260K IL3 261S IL3 262V IL3
263R IL3
265L IL3 266S IL3
270E IL3
271K IL3 272D IL3 276R 6.31 283L 6.38
256I 5.62 257L 5.63 259L 5.65
260K IL3 261S IL3
263R IL3
265L IL3
270E IL3
–
MOPr TM1,2,H8/ TM1,2,H8
Crystal r = 3.97 nm r = 3.80 nm Minimum
r = 4.00 nm
r = 4.60 nm r = 5.40 nm
69I 1.33 72M 1.36 76S 1.40 77I 1.41 80V 1.44 122P 2.58 125S 2.61 126V 2.62 129L 2.65 130M 2.66 135F EL1 347F H8 351C H8 352I H8
69I 1.33 76S 1.40 77I 1.41 80V 1.44
84F 1.48 123F 2.59 126V 2.62 129L 2.65 130M 2.66
348R H8
351C H8 352I H8
66V 1.30
69I 1.33
70T 1.34
77I 1.41
84F 1.48 123F 2.59 126V 2.62 350F H8
351C H8 352I H8
352I H8 –
KOPr TM1,2,H8/ TM1,2,H8
methionine in MOPr and a proline in KOPr), 1.32 (an alanine in MOPr and a proline in KOPr), 1.36 (a methionine in MOPr and a threonine in KOPr) and 2.62 (a valine in MOPr and a threonine in KOPr); b) a contact at position 1.43 for KOPr (phenylalanine), but not for MOPr (cysteine); and c) a contact at position 1.48 for MOPr (phenylalanine) but not for KOPr (valine). Notably, in a monomeric state, residues 1.32, 1.36 and 2.62 would be interacting directly with the lipid membrane, a potentially unfavorable energetic state, which, in this case, can be alleviated by receptor interaction at the KOPr TM1,2,H8/TM1,2,H8 interface. In MOPr, 1.32 is less exposed to the lipid membrane than in KOPr, owing to the bent conformation of TM1 in the MOPr crystal structure. Of these residues, P1.29 at the extreme of TM1 is among the residues remaining in contact up to the largest separation (r= 5.40 nm) for KOPr, and T1.36 is in contact in both the crystal structures, and at the largest separation, but does not appear consistently in the contact maps at the intermediate distances.
Conclusions
In this study, we have presented the calculation of the potential of mean force for the dimerization between protomers of KOPr or MOPr, at interfaces inferred from recent crystal structures of the receptors. Our results indicate that each of the crystallographic interfaces we have investigated forms an energetically viable dimeric configuration in an explicit membrane environment, with
the KOPr TM1/TM/H8 interface being the most stable of all, followed by MOPr TM5,6/TM5,6, and lastly by MOPr TM1,2,H8/TM1,2,H8. Thus, dimerization between opioid re-ceptors appears to vary widely among receptor subtypes, even at interfaces involving the same helices, and we discuss the contributions from the receptor sequence and shape to the relative interface stability. Although further experiments are still necessary to assess the likelihood of a specific opioid receptor region forming part of a physiologically relevant dimerization interface, our studies represent the first step in this direction by providing testable hypotheses of residues that, if mutated, could advance knowledge of the role of dimerization in opioid receptor function.
Acknowledgments
The authors wish to thank Dr. Davide Provasi for insightful discussions and technical assistance, including critical reading of this manuscript. Simulations were supported through the computational resources and staff expertise provided by the Scientific Computing Facility at the Icahn School of Medicine at Mount Sinai, and by the National Science Foundation through TeraGrid advanced computing resources provided by Texas Advanced Computing Center under TG-MCB080109N.
Author Contributions
Conceived and designed the experiments: JMJ MF. Performed the experiments: JMJ. Analyzed the data: JMJ MF. Wrote the paper: JMJ MF.
References
1. Salom D, Padayatti PS, Palczewski K (2013) Crystallization of g protein-coupled receptors. Methods Cell Biol 117: 451–468.
2. Bertheleme N, Chae PS, Singh S, Mossakowska D, Hann MM, et al. (2013) Unlocking the secrets of the gatekeeper: methods for stabilizing and crystallizing GPCRs. Biochim Biophys Acta 1828: 2583–2591.
3. Cherezov V, Abola E, Stevens RC (2010) Recent progress in the structure determination of GPCRs, a membrane protein family with high potential as pharmaceutical targets. Methods Mol Biol 654: 141–168.
4. Granier S, Manglik A, Kruse AC, Kobilka TS, Thian FS, et al. (2012) Structure of the delta-opioid receptor bound to naltrindole. Nature 485: 400–404. Table 2.Cont.
Interface Crystal r = 3.28 nm r = 3.12 nm r = 3.64 nm r = 4.60 nm r = 5.40 nm
56P 1.29 59P 1.32 60V 1.33 63T 1.36 64A 1.37 66Y 1.39 67S 1.40 68V 1.41 70F 1.43 71V 1.44 113P 2.58 114F 2.59 116S 2.61 117T 2.62 120L 2.65 125P EL1 126F EL1 331A 7.54 332F 7.55 338K H8 341F H8 342R H8 346F H8 347P H8
56P 1.29 57A 1.30 59P 1.32 67S 1.40 68V 1.41 70F 1.43 71V 1.44 113P 2.58 114F 2.59 124W EL1 126F EL1 328I 7.51 332F 7.55 341F H8 342R H8
343D H8
346F H8
57A 1.30
60V 1.33 67S 1.40 70F 1.43 71V 1.44 114F 2.59 126F EL1 341F H8
343D H8 345C H8
346F H8
347P H8
55S 1.28 56P 1.29 57A 1.30 59P 1.32 113P 2.58
120L 2.65
126F EL1
56P 1.29 63T 1.36 67S 1.40 116S 2.61
5. Manglik A, Kruse AC, Kobilka TS, Thian FS, Mathiesen JM, et al. (2012) Crystal structure of the mu-opioid receptor bound to a morphinan antagonist. Nature 485: 321–326.
6. Wu H, Wacker D, Mileni M, Katritch V, Han GW, et al. (2012) Structure of the human kappa-opioid receptor in complex with JDTic. Nature 485: 327–332. 7. Thompson AA, Liu W, Chun E, Katritch V, Wu H, et al. (2012) Structure of the
nociceptin/orphanin FQ receptor in complex with a peptide mimetic. Nature 485: 395–399.
8. Wu B, Chien EY, Mol CD, Fenalti G, Liu W, et al. (2010) Structures of the CXCR4 chemokine GPCR with small-molecule and cyclic peptide antagonists. Science 330: 1066–1071.
9. Johnston JM, Aburi M, Provasi D, Bortolato A, Urizar E, et al. (2011) Making Structural Sense of Dimerization Interfaces of Delta Opioid Receptor Homodimers. Biochemistry 50: 1682–1690.
10. Hu J, Thor D, Zhou Y, Liu T, Wang Y, et al. (2012) Structural aspects of M(3) muscarinic acetylcholine receptor dimer formation and activation. FASEB J 26: 604–616.
11. Huang J, Chen S, Zhang JJ, Huang XY (2013) Crystal structure of oligomeric beta1-adrenergic G protein-coupled receptors in ligand-free basal state. Nat Struct Mol Biol 20: 419–425.
12. Hu J, Hu K, Liu T, Stern MK, Mistry R, et al. (2013) Novel Structural and Functional Insights into M3 Muscarinic Receptor Dimer/Oligomer Formation. J Biol Chem 288: 34777–34790.
13. Knepp AM, Periole X, Marrink SJ, Sakmar TP, Huber T (2012) Rhodopsin forms a dimer with cytoplasmic helix 8 contacts in native membranes. Biochemistry 51: 1819–1821.
14. He SQ, Zhang ZN, Guan JS, Liu HR, Zhao B, et al. (2011) Facilitation of mu-opioid receptor activity by preventing delta-mu-opioid receptor-mediated codegra-dation. Neuron 69: 120–131.
15. O’Dowd BF, Ji X, O’Dowd PB, Nguyen T, George SR (2012) Disruption of the mu-delta opioid receptor heteromer. Biochem Biophys Res Commun 422: 556– 560.
16. Duarte JM, Biyani N, Baskaran K, Capitani G (2013) An analysis of oligomerization interfaces in transmembrane proteins. BMC Struct Biol 13: 21. 17. Wang C, Bradley P, Baker D (2007) Protein-protein docking with backbone
flexibility. Journal of Molecular Biology 373: 503–519.
18. Ballesteros JA, Weinstein H (1995) Integrated methods for the construction of three-dimensional models and computational probing of structure-function relations in G protein-coupled receptors. In: Sealfon SC, Conn PM, editors. Methods in Neurosciences: Academic Press. 366–428.
19. Marrink SJ, Risselada HJ, Yefimov S, Tieleman DP, de Vries AH (2007) The MARTINI force field: Coarse grained model for biomolecular simulations. Journal of Physical Chemistry B 111: 7812–7824.
20. Monticelli L, Kandasamy SK, Periole X, Larson RG, Tieleman DP, et al. (2008) The MARTINI coarse-grained force field: Extension to proteins. Journal of Chemical Theory and Computation 4: 819–834.
21. Periole X, Cavalli M, Marrink SJ, Ceruso MA (2009) Combining an Elastic Network With a Coarse-Grained Molecular Force Field: Structure, Dynamics, and Intermolecular Recognition. Journal of Chemical Theory and Computation 5: 2531–2543.
22. Provasi D, Johnston JM, Filizola M (2010) Lessons from Free Energy Simulations of delta-Opioid Receptor Homodimers Involving the Fourth Transmembrane Helix. Biochemistry 49: 6771–6776.
23. Chen C, Shahabi V, Xu W, Liu-Chen LY (1998) Palmitoylation of the rat mu opioid receptor. FEBS Lett 441: 148–152.
24. Zheng H, Pearsall EA, Hurst DP, Zhang Y, Chu J, et al. (2012) Palmitoylation and membrane cholesterol stabilize mu-opioid receptor homodimerization and G protein coupling. BMC Cell Biol 13: 6.
25. Johnston JM, Wang H, Provasi D, Filizola M (2012) Assessing the relative stability of dimer interfaces in g protein-coupled receptors. PLoS Comput Biol 8: e1002649.
26. Van der Spoel D, Lindahl E, Hess B, Groenhof G, Mark AE, et al. (2005) GROMACS: Fast, flexible, and free. Journal of Computational Chemistry 26: 1701–1718.
27. Bonomi M, Branduardi D, Bussi G, Camilloni C, Provasi D, et al. (2009) PLUMED: A portable plugin for free-energy calculations with molecular dynamics. Computer Physics Communications 180: 1961–1972.
28. Kumar S, Bouzida D, Swendsen RH, Kollman PA, Rosenberg JM (1992) The Weighted Histogram Analysis Method for Free-Energy Calculations on Biomolecules.1. The Method. Journal of Computational Chemistry 13: 1011– 1021.
29. Roux B (1995) The Calculation of the Potential of Mean Force Using Computer-Simulations. Computer Physics Communications 91: 275–282. 30. Zhu F, Hummer G (2012) Convergence and error estimation in free energy
calculations using the weighted histogram analysis method. J Comput Chem 33: 453–465.
31. Roux B (1999) Statistical mechanical equilibrium theory of selective ion channels. Biophysical Journal 77: 139–153.
32. Allen TW, Andersen OS, Roux B (2004) Energetics of ion conduction through the gramicidin channel. Proceedings of the National Academy of Sciences of the United States of America 101: 117–122.
33. Warne T, Serrano-Vega MJ, Baker JG, Moukhametzianov R, Edwards PC, et al. (2008) Structure of a beta(1)-adrenergic G-protein-coupled receptor. Nature 454: 486–491.