ANURANS FROM A LOCAL ASSEMBLAGE IN
CENTRAL BRAZIL: LINKING LOCAL PROCESSES WITH
MACROECOLOGICAL PATTERNS
DINIZ-FILHO, J. A. F.,1 BINI, L. M.,1 BASTOS, R. P.,2 VIEIRA, C. M.,3 SOUZA, M. C.,4 MOTTA, J. A. O.,5 POMBAL, J. P. Jr.6 and PEIXOTO, J. C.4
1Laboratório de Ecologia Teórica e Síntese, Departamento de Biologia Geral, Instituto de Ciências Biológicas, Universidade Federal de Goiás, CEP 74001-970, Goiânia, GO, Brazil
2Departamento de Biologia, Instituto de Ciências Biológicas, Universidade Federal de Goiás, CEP 74001-970, Goiânia, GO, Brazil
3Laboratório de Biodiversidade do Cerrado, Departamento de Biologia, Universidade Estadual de Goiás, Av. Juscelino Kubitschek, 146, Bairro Jundiaí, CEP 75110-390, Anápolis, GO, Brazil
4Programa de Pós-Graduação em Biologia, Instituto de Ciências Biológicas, Universidade Federal de Goiás, CEP 74001-970, Goiânia, GO, Brazil
5IBAMA, GO
6Departamento de Vertebrados, Museu Nacional, Universidade Federal do Rio de Janeiro, CEP 20940-040, Rio de Janeiro, RJ, Brazil
Correspondence to: José Alexandre F. Diniz-Filho, Laboratório de Ecologia Teórica e Síntese, Departamento de Biologia Geral, Instituto de Ciências Biológicas, Universidade Federal de Goiás, CEP 74001-970,
Goiânia, GO, Brazil, e-mail: [email protected]
Received August 19, 2002 – Accepted January 24, 2003 – Distributed February 29, 2004 (With 4 figures)
ABSTRACT
Macroecological variables of Anuran species found in a local assemblage from Central Brazil (Silvânia, Goiás State) were linked to population dynamics statistics of these species. Geographical range size (GRS), body size, and species’ midpoints were the macroecological variables investigated for those species found in the local assemblage and for all other species (105 in the total) found in the Cerrado biome. For each species found in the local assemblage, data on abundance was obtained. Using this data, local population variability as expressed by the coefficient of variation was estimated. Distri-bution of means, medians, maximum, variances, and skewness (g1), for both GRS and body size, estimated in the local assemblage were compared, using null models, with the data extracted from the overall Cerrado species pool. The results indicated a clear macroecological relationship between GRS and body size and a decrease in local abundance when distance between the locality analyzed and species midpoint increased. According to null models, both body size and GRS values measured in the local assemblage can be considered a random sample from the regional species pool (Cerrado region). Finally, a three-dimensional analysis using body size, GRS, and local population estimates (abundance and variability), indicated that less abundant and more fluctuating species fell near the lower boundary of the polygonal relationship between GRS and body size. Thus, macroecological results linked with local data on population dynamics supported the minimum viable population model.
Key words: Anura, macroecology, population abundance, Cerrado.
RESUMO
Anuros de uma assembléia local do Brasil Central: relacionando processos locais a padrões macroecológicos
de ocorrência (GRS), o tamanho de corpo e o centro de distribuição das espécies foram as variáveis macroecológicas investigadas para as espécies da assembléia local e para todas as outras espécies (105 no total) encontradas no bioma de Cerrado. Também foram obtidos dados de abundância para 15 espécies da assembléia local. Usando esses dados, a variabilidade populacional foi estimada pelo coeficiente de variação. A distribuição de médias, medianas, máximos, assimetrias e curtoses, para GRS e tamanho de corpo, da assembléia local foi comparada, por intermédio de modelos nulos, com os dados do conjunto de espécies do Cerrado. Os resultados indicaram clara relação macroecológica entre a GRS e o tamanho do corpo, bem como diminuição da abundância local com o aumento da distância entre os centros de distribuição das espécies e a localidade analisada. De acordo com os modelos nulos, os valores do tamanho de corpo e da GRS das espécies da assembléia local podem ser considerados uma amostra aleatória proveniente da composição regional de todo o Cerrado. Finalmente, uma análise tridimensional considerando o tamanho do corpo, a GRS, a abundância local e a variabilidade populacional indicou que espécies menos abundantes, com maior variabilidade populacional, estão próximas ao limite inferior da relação poligonal entre GRS e tamanho de corpo. Assim, os resultados macroecológicos, quando relacionados a dados obtidos em pequenas escalas espaciais, corroboraram o modelo de população mínima viável.
Palavras-chave: Anura, macroecologia, abundância, Cerrado.
INTRODUCTION
Macroecology evaluates the relationship a-mong complex ecological variables (usually body size, geographical range size, and population density) measured for multiple species on a continental scale (Brown, 1995; Maurer, 1999; Gaston & Blackburn, 2000; Blackburn & Gaston, 2001). In recent years, a considerable increase in macroecology research programs has occurred worldwide, addressing many questions about patterns and processes related to statistical distributions (Blackburn & Gaston, 1994a, b), relationships among macroecological variables (Gaston & Blackburn, 1996), and their spatial and phylogenetic patterns (Brown, 1999; Duncan et al., 1999; Gaston & Blackburn, 1999, 2000; Cardillo, 2002).
However, as Blackburn & Gaston (1998) and Gaston & Blackburn (1999) recently pointed out, one of the main criticisms of macroecology research programs is that they do not yet include a substantial body of mathematical modeling and an associated unifying theoretical framework. Moreover, Brown (1999) also points out that major emphasis in ma-croecological analyses has been in the establishment of patterns, but not in discovering underlying eco-logical and evolutionary processes.
These criticisms are linked to the common problem of inferring ecological processes from large-scale patterns (Ricklefs & Schluter, 1993; Levin, 1992). Thus, it is necessary to go down in the
ecological hierarchy to a local spatial scale, which is the relevant one for natural assemblages. Subse-quently, specific processes acting on local assem-blages can be invoked to explain large-scale patterns (Cyr et al., 1997). A well known example is the relationship between local population density and body size, that is usually linked to the energetic processes in local communities by the so-called “energetic equivalence rule” (EER) (Damuth, 1981; Blackburn & Gaston, 1997a, b, 1999). Despite many recent criticisms of EER (Bini et al., 2001 and references therein), it is nevertheless a good example of how a large-scale trend can be understood based on theory and models previously developed to be applied in a lower hierarchical level (Cyr et al., 1997).
The purpose of this paper is to evaluate how macroecological patterns in a local assemblage of Anura from Central Brazil (Silvânia, Goiás State) can be linked to local population dynamics. Despite the relatively low number of species, data on popu-lation dynamics among them are available, per-mitting, through extrapolation of inferred processes, the explanation of macroecological patterns.
MATERIAL AND METHODS
48o36’W). The protected area (900 MSL) occupies approximately 466 ha, and presents typical cerrado physiognomies: Cerrado (sensu stricto), cerradão, campo cerrado, and riparian forest (Oliveira-Fillho & Ratter, 2002).
In each survey, anurans were registered by visual encounter survey (Crump & Scott Jr., 1994) and by audio strip transect (Zimmerman, 1994). Abundance data of 15 out of the 26 species found in Silvânia that were also included in the macroecological analyses (see below) were obtained by using this sampling procedure (Table 1). Based on an extensive literature review and on records of the Museu Na-cional (Universidade Federal do Rio de Janeiro), macroecological data was collected for a pool of 105 species found in the Cerrado area of Central Brazil (Appendix 1; see also Colli et al., 2002). Species whose taxonomic status was undefined or that probably belong to groups of species (i.e., Scinax gr. ruber or Bufo gr. granulosus) were excluded from our macroecological data set. For each species, GRS (extent of occurrence) was defined by a minimum convex polygon based on occurrence points (Gaston, 1994). Based on this, we defined the geographical distance from Silvânia, where the local assemblage
was monitored, to the species midpoint, determining in this way if the population in this local assemblage, for a given species, is a central or peripheral population (Channell & Lomolino, 2000). Body size was considered as the average snout-vent length (SVL) obtained in the literature and expressed in millimeters. Thus, when comparing the fauna of Silvânia with that of the Cerrado overall, 15 species were included when using population dynamics data, and 26 species were used when dealing with macroecological (SVL and GRS) data only.
Data analysis
A first-order autoregressive model was fitted to estimate the degree of temporal autocorrelation of each time series (abundance data for each of the 15 species). The following model was used:
xt= φ1xt-1 + et where x
t is the abundance (in logarithmic scale plus
1.0) estimate for month t, φ1is the autoregressive parameter, and e is the random error component. Each observation is made up of a random error component and a linear combination (if more than one auto-regressive parameter is fitted) of prior observations.
Species SVL GRS DIST LPA
Bufo schneideri 150.0 2753669 65 0.116
Bufo rubescens 107.5 937612 364 0.058
Hyla albopunctata 55.1 1942199 260 1.641
Hyla biobeba 52.2 558866 195 1.814
Hyla cruzi 11.5 215272 52 1.205
Hyla goiana 33.1 392925 65 1.881
Hyla minuta 22.6 6201303 117 0.1
Hyla pseudopseudis 41.2 337865 78 0.019
Leptodactylus labyrinthicus 130.1 4011249 299 0.05
Leptodactylus ocellatus 103.0 3337023 0 0.039
Odontophrynus cultripes 57.0 2385638 559 0.196
Phyllomedusa hypochondrialis 33.5 1990972 715 0.108
Physalaemus cuvieri 28.0 3102080 130 1.007
Scinax centralis 25.0 33800 0 0.171
Scinax fuscomarginatus 24.0 1649474 247 0.031
TABLE 1
Fifteen species found in Silvânia (Goiás State) and the macroecological data used in this study. Abbreviations: SVL =
snout vent length (mm); GRS = geographic range size (km2); DIST = distance from midpoint to Silvânia in (km); LPA =
For each species, we calculated the mean value of x
t and used it as a measure of local abundance.
Variability of the x
t values was characterized by their
coefficient of variation (McArdle et al., 1990). We then correlated these local estimates (mean, co-efficient of variation, and autoregressive coco-efficient) with large-scale macroecological data established across species.
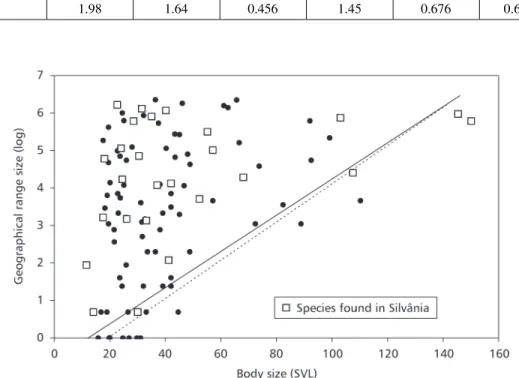
The shape of the relationship between geo-graphical range size and SVL was defined as a left triangle, with a symmetrical and upper right boundary. The null hypothesis of no relationship between GRS and SVL (i.e., the selected shape can be obtained by chance alone) was assessed by randomization procedures implemented in EcoSim v. 7.0 (Gotelli & Entsminger, 2000). Two criteria were used. First, the dispersion index (i.e., variance), which was calculated by dividing the bivariate space into four quadrants based on location of species points (median of the two variables), was compared with the distribution of variances obtained after randomizing the species positions in the bivariate space. The distribution was created by 1,000 simu-lated data sets. Thus, this procedure detects only nonrandom aggregation of species in the bivariate space formed by GRS and SVL. Second, a polygonal shape, as defined above and using the default options of EcoSim for the selection of the shape, was im-posed on the data and the number of species falling within the envelope was counted. This value was then compared with a null distribution of point counts constructed by randomizing 1.000 times the species position in the bivariate space. If the species are unusually clustered within the shape, then the ob-served number of species will be significantly larger than the number found in most randomized data sets. The GRS/SVL relationship was also analyzed using the 26 species found in Silvânia only, and compared with the same relationship based on the 105 species in the Cerrado species pool.
Species assembly rules assessment
We randomly drew 26 species from the Cer-rado species pool (n = 105), matching then with the species richness in Silvânia, and repeated this procedure 1,000 times, comparing the distribution of means, medians, maximum, variances, and skew-ness (g1) (Sokal & Rohlf, 1995), for both GRS and SVL, with real values defined for the local as-semblage from Silvânia (Blackburn & Gaston, 2001).
These estimates were expected to describe the statistical distribution of these two variables, which is usually extremely asymmetric (Gaston & Blackburn, 2000). Thus, it would be possible to determine if the GRS and SVL of those species found in the local assemblage (Silvânia) is a typical as-semblage randomly extracted from the overall Cerrado species pool.
RESULTS
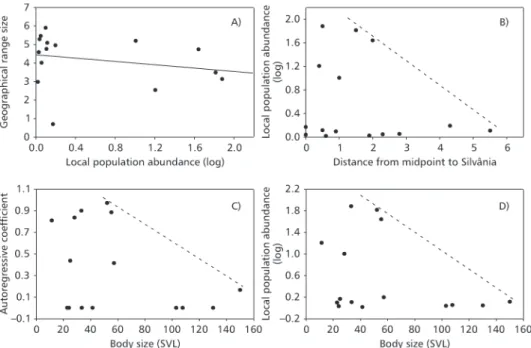
Despite the relatively low number of species and consequent difficulties in testing relationships by standard regression approaches or definition of constraint envelopes (due to low statistical power), some relationships between local statistics and macroecological variation followed overall expected tendencies (Fig. 1). There was a decrease in abun-dance when distances between Silvânia and species midpoint increases, but there was not a positive relationship between local population abundance and geographical range size, as expected (Fig. 1A, B). There was also a negative relationship between auto-regressive coefficient and body size (Fig. 1C) and between local population abundance and body size (Fig. 1D). As indicated above, these are only general tendencies with interpretable upper boundaries (see Discussion).
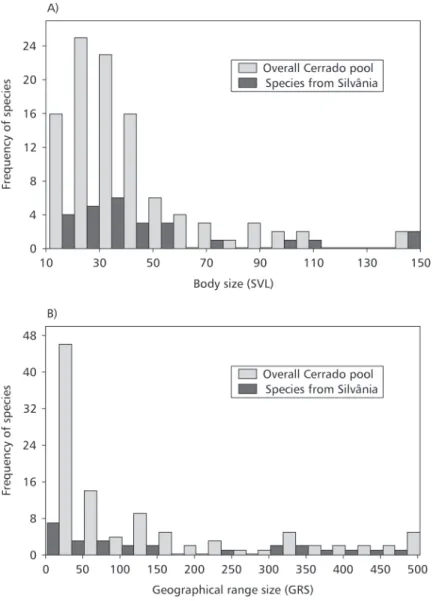
The frequency distributions of SVL and geo-graphical range sizes from both Silvânia and Cerrado species pool were right-skewed (Fig. 2), as expected by considering patterns in other macroecological data (Blackburn & Gaston, 2001, and references therein). More importantly, for the two variables, means, medians, variances, maximums, and g1, estimated in the local assemblagecan be considered random values extracted from the Cerrado species pool (Table 2) (with a single exception, i.e., variance in body size, with a P-value of 0.03).
Fig. 1 — Relationships between (A) GRS and local population abundance (LPA), (B) LPA and distance from midpoint to Silvânia (where the local assemblage was studied), (C) body size (snout-vent length; SVL) and the autoregressive coefficient, and (D) and SVL and LPA.
When the relationship is tested using the Silvânia species, the overall triangular shape remains, with a large overlap between the two polygons (Fig. 3). However, the statistical tests of dispersion and species count are no longer significant. Considering the small number of species in the local assemblage studied, this result can be attributed to low statistical power. However, as indicated above, the relationship was similar to that detected with the large-scale data.
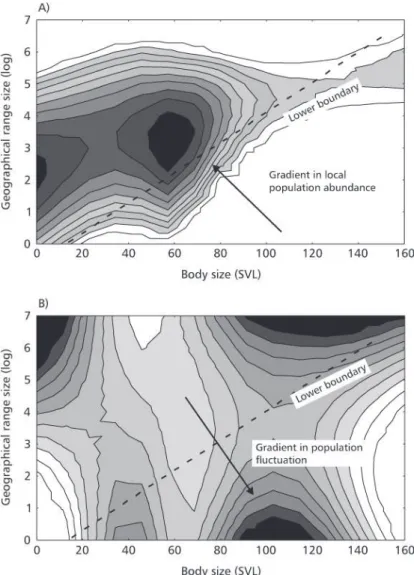
We performed a contouring procedure on both local population abundance and population variability (as expressed by the coefficient of variation of local abundance), using the distance weighted least squares procedure (DWLS), over the bivariate space formed by GRS and SVL (Fig. 4). Thus, contour regions indicate the third variable analyzed (GRS, SVL, and population abundance in Fig. 4A, and geographical range size, SVL, and population variability in Fig. 4B). It is possible to note that less abundant and more fluctuating species fall exactly within the lower boundary, with a
gra-dient of increasing abundance and decreasing fluc-tuation toward the central region of the polygon.
DISCUSSION
The links between local processes of commu-nity or population dynamics and macroecological patterns are not easily established, by reason of difficulties in sampling and variable definition (Blackburn & Gaston, 2001). In our study of anurans from Silvânia, the main problem is that the number of species analyzed at the local scale by population dynamics variables (abundance and variability) is only a relatively small part of the Cerrado species pool for which macroecological patterns can be established.
Using body size expressed by SVL as a pre-dictor, it is possible to see that both mean population abundance and autoregressive coefficients tend to be smaller for species with larger body size.
Thus, larger species are less abundant and have low auto-regressive coefficients (less predictable or with less variation in abundance) when compared to smaller species. A negative relationship between population abundance and body size can be explained by mass-related energy requirements (Carbone & Gittleman, 2002, and references therein).
The different forms of the interspecific relationship between abundance and body size in animals (a simple monotonic relationship or a nonhomogeneous polygonal relationships), however, may be a product of different sampling scales (Lawton, 1989; Blackburn & Gaston, 1997a). High temporal autocorrelation may indicate population stability, which tends to be higher in large-bodied species. In this way, the negative relationship between abundance and temporal autocorrelation is hard to explain.
SVL GRS
Cerrado Silvânia p (pool) Cerrado Silvânia p (pool)
Mean 41.09 47.88 0.111 119.84 170.61 0.059
Median 32.58 34.07 0.386 45.00 100.50 0.087
Variance 700.41 1420.57 0.030 23721.08 27371.53 0.328
Maximum 150.00 150.00 0.233 576.00 503.00 0.503
g1 1.98 1.64 0.456 1.45 0.676 0.676
Fig. 3 — Relationship between GRS and SVL. The boundaries were fitted according to Gotelli & Entsmiger (2000). Dashed
line = overall data; continuous line = Silvânia data.
TABLE 2
Basic statistics (mean, median, variance, maximum, and skewness) for body size (SVL) and geographical range size
(GRS) of the species found in the Cerrado species pool (n = 105) and in Silvânia (n = 26). The probability that these
statistics estimated for Silvânia species differ from randomly selected species from the Cerrado pool with n = 26 is
given by p(pool).
Besides, the coefficient of variation does not show a clear tendency, indicating that magnitude of population variability is not related to other variables, at least at this scale. Mean population abundance also decreases with increasing distance from species midpoint to Silvânia, indicating that local populations in the periphery of the
Resampling procedures indicate that both SVL and GRS values measured in the local assemblage studied can be characterized as a random sample coming from the regional species pool (Cerrado region). This result can be explained by the central position of Silvânia within the Cerrado region, both geographically and in terms of habitat representation occurring at a more re-gional scale. Also, the significant polygonal relationship between GRS and SVL is similar to those in other groups of species (Brown & Maurer, 1989; Brown, 1995) and more clear than those
found for anurans in other parts of the world (Murray et al., 1998). For Silvânia species only, the pattern is quite similar. But the most important aspect to note is how less abundant and more fluctuating species overlap on this bivariate space, a consistent pattern for which would support the minimum viable population model explaining the relationship between body size and geographical range size (Brown & Maurer, 1987, 1989; Gaston & Blackburn, 1996). Indeed, less abundant and more fluctuating species fall near the lower boundary, with a gradient toward the central region of the polygon.
Fig. 4 — Distance weighted least squares procedure smoothing fitted over the bivariate space formed by GRS and SVL.
This pattern is consistent with the minimum viable population model, in which the lower boundary is a probabilistic constraint line linked to a stochastic extinction process. In general, larger-bodied species require larger range sizes in order to maintain minimum viable populations (Brown & Maurer, 1987). Differential extinction of species of large body size with low population abundance prevents the occurrence of numerous widely dis-tributed large-bodied species in the regional pool. In addition, species of large body size tend to have extensive geographical ranges. As indicated by Figs. 3 and 4, a species is unlikely to occur with the following characteristics combined: low population abundance, large body sizes, low geographical range size, and higher population variability. The slope of the lower boundary would be largely variable among different groups of organisms and dependent on many factors, including extinction rates, dependence of population dynamics on body mass, and intensity of local competition. Although the number of species analyzed is small, predictions are in agreement with minimum viable population model, both in terms of local abundance and
po-pulation variability, another variable that has been linked to high extinction probability.
Murray et al. (1998) in analyzing macro-ecological patterns in Australian frogs rejected Brown’s minimum viable population model because partial relationships between body size and geo-graphical range size, after taking into account population density, are still significant. This suggests that this relationship is not fully explained by underlying variations in species density. The prece-ding authors found out that Gaston’s (1991) homeostasis model better explains this relationship. However, it is important to note that relationships among these macroecological variables in not well described by linear models, and partial correlation may be flawed. We believe that observing the overlay between the three variables, as performed here, provides a better approach for understanding more complex non-linear patterns. Although no statistical test on this overlay was performed (and, in fact, it would be useless due to low statistical power), we believe that observed macroecological patterns, linked with data of local population dynamics, support the minimum viable population model.
Species SVL GRS
Adenomera bokermanni 23.70 42.00
Adenomera hylaedactyla 24.45 405.00
Adenomera martinezi 24.45 69.00
Aplastodiscus perviridis* 68.00 73.00
Barycholos ternetzi* 26.00 24.00
Bufo guttatus 99.14 208.00
Bufo ocellatus 43.42 124.00
Bufo ornatus 72.35 21.00
Bufo rubescens*, # 107.50 82.00
Bufo schneideri*, # 150.00 325.00
Chiasmocleis albopunctata* 30.40 129.00
Chiasmocleis centralis 23.60 128.00
Colostethus goianus 16.75 2.00
Crossodactylus bokermanni 25.80 7.00
Dermatonotus muelleri 66.50 183.00
APPENDIX 1
Species SVL GRS
Elachistocleis ovalis 25.00 59.00
Eleutherodactylus crepitans 31.00 1.00 Eleutherodactylus duendeei 29.75 1.00 Eleutherodactylus heterodactylum 24.60 1.00 Eleutherodactylus juipoca* 17.50 25.00
Epipedobates braccatus 20.05 63.00
Epipedobates flavopictus 25.90 115.00
Epipedobates pictus 22.70 147.00
Hyla albopunctata*, # 55.12 245.00
Hyla alvarengai 88.75 21.00
Hyla anataliasiasi 23.00 28.00
Hyla araguaya 19.80 1.00
Hyla biobeba*, # 52.20 41.00
Hyla cerradensis 18.90 2.00
Hyla cipoensis 31.45 22.00
Hyla circumdata 57.04 39.00
Hyla crepitans 62.50 468.00
Hyla cruzi*, # 11.50 7.00
Hyla elianeae 22.80 47.00
Hyla ericae 26.5 2.00
Hyla faber 92.50 115.00
Hyla goiana*, # 33.14 23.00
Hyla ibitiguara 42.00 4.00
Hyla jimi 21.60 13.00
Hyla melanargyrea 19.50 108.00
Hyla minuta*, # 22.62 503.00
Hyla multifasciata 40.20 158.00
Hyla nana 19.50 277.00
Hyla nanuzae 42.00 5.00
Hyla pinima 19.50 21.00
Hyla pseudopseudis*, # 41.20 8.00
Hyla punctata 32.10 378.00
Hyla raniceps 65.64 574.00
Hyla rubicundula* 18.00 119.00
Hyla saxicola 48.75 10.00
Hyla sazimai 36.40 10.00
Hyla soaresi* 31.10 37.00
Hyla tritaeniata 19.00 45.00
Hylodes otavioi 33.50 10.00
Leptodactylus curicularius 38.00 18.00
Leptodactylus camaquara 39.00 4.00
Leptodactylus chaquensis 46.70 58.00
Leptodactylus furnarius 39.00 28.00
Leptodactylus fuscus* 40.10 433.00
Leptodactylus jolyi 45.00 27.00
Leptodactylus labyrinthicus*, # 145.35 394.00
APPENDIX 1 (Continued.)
Species SVL GRS
Leptodactylus mystaceus 46.02 525.00
Leptodactylus mystacinus 48.02 135.00
Leptodactylus ocellatus*, # 103.00 356.00
Leptodactylus petersii 37.50 308.00
Leptodactylus podicipinus 36.40 576.00
Leptodactylus pustulatus 38.00 60.00
Leptodactylus syphax 73.70 98.00
Leptodactylus tapiti 33.00 2.00
Leptodactylus troglodytes 48.80 103.00
Lysapus limellus 17.50 195.00
Odontophrynus americanus 43.40 231.00
Odontophrynus cultripes*, # 57.00 150.00
Odontophrynus moratoi 31.65 15.00
Odontophrynus salvatori* 30.00 2.00
Phasmahyla jandai 30.00 2.00
Phrynohyas venulosa 61.00 492.00
Phyllomedusa burmeisteri 110.20 39.00
Phyllomedusa centralis 42.00 33.00
Phyllomedusa hypochondrialis*, # 31.50 454.00
Physalaemus albonotatus 25.85 25.00
Physalaemus centralis* 37.00 59.00
Physalaemus cuvieri*, # 28.50 326.00
Physalaemus deimaticus 24.40 4.00
Physalaemus evangelistai 21.50 18.00
Physalaemus fuscomaculatus 45.00 228.00
Physalaemus nattereri* 42.00 62.00
Proceratophrys cururu 44.60 2.00
Proceratophrys goyana 32.58 24.00
Pseudis bolbodactyla* 35.00 367.00
Pseudopaludicola ameghini 18.00 45.00
Pseudopaludicola falcipes 15.80 1.00
Pseudopaludicola mineira 14.30 2.00
Pseudopaludicola saltica 18.14 32.00
Rana palmipes 92.00 327.00
Scinax canastrensis 31.98 4.00
Scinax centralis*, # 14.00 2.00
Scinax duartei 26.50 2.00
Scinax fuscomarginatus*, # 24.00 158.00
Scinax machadoi 23.50 5.00
Scinax maracaya 26.86 1.00
Scinax nebulosus 28.00 163.00
Scinax squalirostris 25.00 331.00
Thoropa megatympanum 42.00 47.00
* Species found in the Silvânia region, Goiás.
Acknowledgments — We thank L.P. Lima and M.B. Alcantara
for help in fieldwork, and Ibama for providing logistical support in Silvânia. Financial support was provided by several grants from CNPq (Programa Centro-Oeste de Pesquisa & Pós-Gra-duação – PCOPG 520804/99-6, proc. 400381/97-4 to RPB, and productivity fellowships to JAFD-F, LMB, RPB and JPP-Jr), FUNAPE/UFG, and Capes.
REFERENCES
BINI, L. M., COELHO, A. S. & DINIZ-FILHO, J. A. F., 2001, Is the relationship between population density and body size consistent across independent studies? A meta-analytical approach. Rev. Bras. Biol., 61: 1-6.
BLACKBURN, T. M. & GASTON, K. J., 1994a, Animal body size distributions: patterns, mechanisms and implications.
Trends Ecol. Evol., 9: 471-474.
BLACKBURN, T. M. & GASTON, K. J., 1994b, The distribution of body sizes of the world’s bird species. Oikos, 70: 127-130.
BLACKBURN, T. M. & GASTON, K. J., 1997a, A critical assessment of the form of the interspecific relationship between abundance and body size in animals. J. Anim. Ecol., 66: 233-249.
BLACKBURN, T. M. & GASTON, K. J., 1997b, The relationship between animal abundance and body size: a review of the mechanisms. Advances in Ecological Research, 28: 181-210.
BLACKBURN, T. M. & GASTON, K. J., 1998, Some metho-dological issues in macroecology. Am. Nat., 151: 68-83.
BLACKBURN, T. M. & GASTON, K. J., 2001, Linking patterns in macroecology. J. Animal Ecol., 70: 338-352.
BLAMIRES, D., DINIZ-FILHO, J. A. F., SANT´ANA, C. E. R. & VALGAS, A. B., 2002, Relação entre abundância e tamanho do corpo em uma comunidade de aves no Brasil Central. Ararajuba, 10: 1-14.
BROWN, J. H. & MAURER, B. A., 1987, Evolution of species assemblages: effects of energetic constraints and species dynamics on the diversification of North American avifauna.
Am. Nat., 130: 1-17.
BROWN, J. H. & MAURER, B. A., 1989, Macroecology: the division of food and space among species on continents.
Science, 243: 1145-1150.
BROWN, J. H., 1995, Macroecology. University of Chicago
Press, Chicago.
BROWN, J. H., 1999, Macroecology: progress and prospect.
Oikos, 87: 3-14.
BROWN, J. H., MEHLMAN, D. W. & STEVENS, G. C., 1995, Spatial variation in abundance. Ecology,76: 2028-2043. CARBONE, C. & GITTLEMAN, J. L., 2002, A common rule for the scaling of carnivore density. Science, 295: 2273-2276. CARDILLO, M., 2002, Body size and latitudinal gradients in regional diversity of New Word birds. Global Ecol. Biogeogr.,
11: 59-65.
CHANNELL, R. & LOMOLINO, M. V., 2000, Dynamic biogeography and conservation of endangered species.
Nature, 403: 84-86.
COLLI, G. R., BASTOS, R. P. & ARAÚJO, A. F. B., 2002, The character and dynamics of the Cerrado herpetofauna. In: P. S. Oliveira & R. J. Marquis (eds.), The Cerrados of Brazil: ecology and natural history of a Neotropical savanna.
Columbia University Press, Irvington, pp. 223-241.
CRUMP, M. L. & SCOTT Jr., N. J., 1994, Visual encounter surveys. In: W. R. Heyer, M. A. Donnelly, R. W. McDiarmid, L. Hayek & M. S. Foster (eds.), Measuring and monitoring biological diversity – standard methods for Amphibians.
Smithsonian Inst. Press, Washington, pp. 84-91. CYR, H., DOWNING, J. A. & PETERS, R. H., 1997,
Density-body size relationships in local aquatic communities. Oikos,
79: 333-346.
DAMUTH, J., 1981, Population density and body size in mammals. Nature, 290: 699-700.
DUNCAN, R. P., BLACKBURN, T. M. & VELTMAN, C. J., 1999, Determinants of geographical range sizes: a test using introduced New Zealand birds. J. Anim. Ecol., 68: 963-975. GASTON, K. J., 1991, How large is a species geographic range.
Oikos, 61: 434-438.
GASTON, K. J., 1994, Rarity. Chapman & Hall, London.
GASTON, K. J. & BLACKBURN, T. M., 1996, Range in size-body size relationships: evidence of scale dependence. Oikos, 75: 479-485.
GASTON, K. J. & BLACKBURN, T. M., 1999, A critique for macroecology. Oikos,84: 353-368.
GASTON, K. J. & BLACKBURN, T. M., 2000, Pattern and process in macroecology. Blackwell, London.
GOTELLI, N. J. & ENTSMINGER, G. L., 2000, EcoSim: null models software for ecology (version 5.0). Acquired Intelligence Inc. & Kesey-Bear.
LAWTON, J. H., 1989, What is the relationship between population density and body size in animals? Oikos, 55: 429-434.
LEVIN, S. A., 1992, The problem of pattern and scale in ecology.
Ecology, 73: 1943-1967.
MAURER, B. A., 1994, Geographical population analysis. Blackwell Scientific Publications, Oxford.
MAURER, B., 1999, Untangling ecological complexity. University of Chicago Press, Chicago.
McARDLE, B. H., GASTON, K. J. & LAWTON, J. H., 1990, Variation in the size of animal populations – patterns, problems and artifacts. J. Anim. Ecol., 59: 439-454. MURRAY, B. R., FONSECA, C. & WESTOBY, M., 1998, The
macroecology of Australian frogs. J. Anim. Ecol.,67: 567-579.
OLIVEIRA-FILHO, A. T. & RATTER, J., 2002, The woody vegetation and the Cerrado Physionomies. In: P. S. Oliveira
& R. J. Marquis (eds.), The Cerrados of Brazil: ecology and natural history of a Neotropical savanna. Columbia
University Press, Irvington, pp. 91-120.
RICKLEFS, R. E. & SCHLUTER, D., 1993, Species diversity: regional and historical influences. In: R. E. Ricklefs & D. Schluter (eds.), Species diversity in Ecological Communities.
University of Chicago Press, Chicago, pp. 350-363. SOKAL, R. R. & ROHLF, F. J., 1995, Biometry. W. H. Freeman,
New York.
ZIMMERMAN, B. L., 1994, Audio strip transects. In: W. R.
Heyer, M. A. Donnelly, R. W. McDiarmid, L. Hayek & M. S. Foster (eds.), Measuring and monitoring biological diversity – standard methods for Amphibians. Smithsonian