OR
IGI
N
A
L
R
E
S
E
A
R
C
H
Q angle and subtalar pronation are not good
predictors for pain and function in subjects with
patellofemoral pain syndrome
Ângulo Q e pronação subtalar não são bons preditores de dor e função em indivíduos com
síndrome da dor femoropatelar
No son buenos indicadores de dolor y de limitaciones funcionales el ángulo Q y la pronación
subastragalina en los sujetos con síndrome de dolor patelofemoral
Danilo de Oliveira Silva1, Ronaldo Valdir Briani2, Deisi Ferrari3, Marcella Ferraz Pazzinatto2,
Fernando Amâncio Aragão4, Fábio Mícolis de Azevedo5
Mailing address: Fábio Mícolis de Azevedo – Departamento de Fisioterapia, FCT-UNESP – Rua Roberto Simonsen, 305 – CEP: 19060-900 – Presidente Prudente (SP), Brazil E-mail: [email protected]–Phone: 3229-5820. – Presentation: Set. 2014 – Accepted for publication: May 2015
The research was approved by the Ethics Committee of Universidade Estadual do Oeste do Paraná – oicial opinion no. 096/2013
This study was conducted at Universidade Estadual do Oeste do Paraná, Physical Therapy Course, at the Human Movement Research Laboratory (Laboratório de Pesquisa do Movimento Humano – LAPEMH) and at Universidade Estadual Paulista “Júlio de Mesquita Filho” (FCT/UNESP), at the Biomechanics and Motor Control Laboratory.
1Physical Therapist, Physical Therapy Master’s Degree from Universidade Estadual Paulista “Júlio de Mesquita Filho” (FCT/UNESP) –
Campus Presidente Prudente (SP), Brazil.
2Physical Therapist, Physical Therapy Master’s Degree Student from Universidade Estadual Paulista “Júlio de Mesquita Filho” (FCT/
UNESP) – Campus Presidente Prudente (SP), Brazil.
3Physical Therapist, Master’s Degree Graduate, Doctor’s Degree Student from Universidade de São Paulo – Bioengineering Interunit
Post-Graduation Program – EESC/FMRP/IQSC-USP, São Carlos (SP), Brazil.
4PhD Professor. Physical Therapist at Universidade Estadual do Oeste do Paraná (UNIOESTE) – Cascavel (PR), Brazil.
5 PhD Professor. 2- Physical Therapist, and vice-coordinator in the post-graduation program - physical therapy master’s level - at
Universidade Estadual Paulista “Júlio de Mesquita Filho” (FCT/UNESP) – Campus Presidente Prudente (SP), Brazil.
ABSTRACT | The aim of this study was to evaluate the capability of Q angle and subtalar pronation clinical tests in predict pain and functional limitations reported by individuals with patellofemoral pain syndrome (PFPS). 31 individuals with PFPS were recruited for this study. The Anterior Knee Pain Scale questionnaire was applied to identify the functional limitations and the Visual Analogue Scale was used to identify the pain referred during the last month. Two clinical tests were performed in order to obtain the Q angle and subtalar pronation measurements. The values of the tests were entered in a multiple and linear regression models to obtain the R2 and the regression coeicients for non-continuous standardized measures, with a statistical signiicance set at α = 0.05. Both tests, when entered separately into the linear regression models achieved low values of pain and function prediction. On the other hand, when placed together in a multiple regression model, the tests explained 9% and 4% of the pain and functional limitations of the individuals with PFPS, respectively. Although there was an improvement in the pain and function limitation prediction when the tests were analyzed together, our indings showed that both measurement, Q angle and subtalar pronation, are not good
169
predictors of pain and functional limitations of individuals with PFPS.
Keywords | Linear Models; Knee; Patella; Patellofemoral Pain Syndrome.
baixos de predição de dor e função. Por outro lado, quando inseridos conjuntamente em modelos de regressão múltipla, os testes explicaram 9% e 4% da dor e das limitações funcionais de indivíduos com SDFP, respectivamente. Embora houve melhora da predição da dor e limitação funcional quando os testes foram avaliados em conjunto, as descobertas deste estudo mostram que ambas as medidas, ângulo Q e pronação subtalar, não são bons preditores de dor e limitações funcionais de indivíduos com SDFP.
Descritores | Modelos Lineares; Joelho; Patela, Síndrome da Dor Patelofemoral.
RESUMEN | En este estudio se buscó evaluar la capacidad de las pruebas clínicas de mediciones del ángulo Q y de la pronación subastragalina como indicadores del dolor y de las limitaciones funcionales en los sujetos con Síndrome de Dolor Patelofemoral (SDFP). A los 31 participantes con SDFP del estudio se les aplicaron el cuestionario Anterior Knee Pain Scale para identiicar las limitaciones funcionales y la Escala Visual
Analógica para medir el dolor sentido por ellos en el último mes. Se realizó dos pruebas clínicas estáticas, la medición del ángulo Q y la de postura de pronación subastragalina. Los valores de las pruebas se insertaron en los modelos de regresión lineal y múltiple para la obtención del R2 y de los coeicientes de regresión de las medidas no constantes con el nivel estándar de signiicancia de un α=0,05. Ambas pruebas fueron insertadas separadamente en los modelos de regresión lineales y resultaron en índices bajos de dolor y función. En cambio, cuando insertadas juntas a los modelos de regresión múltiple, mostraron un 9% y un 4% de los dolores y de las limitaciones de los sujetos con SDFP, respectivamente. Aunque haya demostrado esta mejora, los resultados de este estudio llaman la atención para las dos medidas, la del ángulo Q y la de la pronación subastragalina, que no son buenos indicadores del dolor y de las limitaciones funcionales en los sujetos con SDFP.
Palabras clave | Modelos Lineales; Rodilla; Rótula; Síndrome de Dolor Patelofemoral.
INTRODUCTION
Patellofemoral pain syndrome (PFPS) is characterized as a pain with an insidious onset in anterior, peri, or retropatellar regions. It is one of the main disorders which afect the knee, and it predominantly occurs in females, reaching
approximately 13% of women of ages 18 to 35 years1.
his painful condition is made worse by functional gestures such as going up or down stairs, squatting, and running, which limits those individuals’ participation
in sports and everyday activities (EDAs)2.
Despite its high incidence, the set of procedures to diagnose that dysfunction has not yet been deined, the literature has not reached a consensus in regards
to its etiological factors3. Due to that, investigations
on biomechanic variables are often found, in order to identify speciic musculoskeletal behaviors in individuals
with PFPS, aiming to characterize that disorder4-6. A
systematic review which investigated biomechanical factors that are associated with PFPS listed 47 studies with good quality methodologies which evaluated 523
diferent biomechanic parameters in total6. However,
even with that arsenal of parameters investigating PFPS in a multifactorial fashion, there is much controversy on which parameters are found to be altered in individuals
with PFPS2,7.
In that context, a concern is observed in the ield, to ind static and/or dynamic kinesiological alterations which are related to or can explain pain and the
functional limitations of individuals with PFPS8–10.
For instance, Nakagawa et al. investigated, through a motion analysis system, to which extent three hip and knee kinematic variables could predicted the related pain an functional limitations in those subjects; they found a 63% prediction for pain variation and 44% for
functional limitations8. However, the biomechanic tools
that are used to verify those results are not common or usual instruments in the everyday clinical practice. 3D Motion analysis systems are very costly, and they require specialized workforce to be used; likewise, kinetic analysis systems such as force platforms and isokinetic dynamometers are common in scientiic research, but they are rare in rehabilitation and diagnose clinics. Such fact reinforces the idea that clinical tests may be the most feasible option, and they must be further explored as they are easily applied and inexpensive. Due to the lack of a golden standard diagnostic tool, studies have been using sets of clinical tests to compose their inclusion criteria
and to classify subjects as either PFPS-afected or not11,3.
Clinical tests for static alterations such as Q angle and subtalar pronation posture measurements have been part of sets of tests which classify individuals as either
in the literature concerning how much those tests are capable of explaining pain and functional limitations that are found in those individuals. Although they are
found to have good interrater reproducibility values13-15,
those clinical tests need to show their ability to predict pain and function in PFPS. hat type of approach may be directly related and transported to clinical practice, as they have to be analyzed, as in this study, in order to know they can still be possibly used.
he aim of this study is to evaluate the ability from clinical tests to measure Q angle and subtalar pronation as predictors for pain and functional limitations that are reported by subjects with PFPS.
METHODOLOGY
Sample characterization
64 volunteeers with knee pain were selected to take part in the study; however, only 31 volunteers it the inclusion criteria - all of them were identiied with PFPS. In order to be included in the study, subjects were submitted to a screening process which is recommended
by high-quality studies in PFPS area7,16.
he inclusion criteria were: (1) anterior knee pain during at least two of the following activities: sitting for a prolonged time, during the squatting position or performing squats, kneeling, running, climbing up or down stairs; (2) patellar tenderness; (3) insidiously-onset symptoms for at least a month; (4) average pain level of at least three centimeters in visual analog scale (VAS), in which 0cm means no pain and 10cm,
the maximum amount of pain the previous month17;
and (5) 3 or more positive clinical signs in in the following exams: Clarke’s sign, McConnell test, Nobel compression test, Waldron test, and patella in medial or lateral positions. Subjects had to necessarily fulill all ive requirements in order to be identiied as having PFPS. As a non-inclusion criterion, any conditions other than PFPS were considered. hey included the following: patellar subluxation or luxation events, inlammatory process in any of the lower limbs, osteoarthritis, damaged patellar tendon or meniscus, and neurological diseases. All subjects were evaluated according to the inclusion or non-inclusion criteria by two physical therapists, both with ive-year experience in evaluating patients with PFPS. Subjects were only included in the study when both physical therapists
agreed on the criteria. Subjects’ anthropometric data are displayed in Table 1.
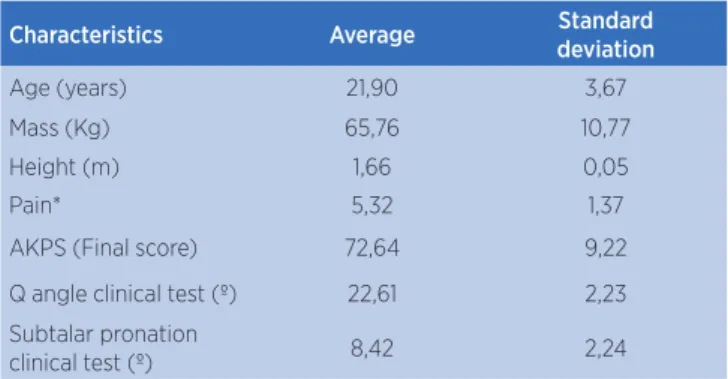
Table 1. Anthropometric data and characterization of subjects
Characteristics Average Standard
deviation
Age (years) 21,90 3,67 Mass (Kg) 65,76 10,77 Height (m) 1,66 0,05 Pain* 5,32 1,37 AKPS (Final score) 72,64 9,22 Q angle clinical test (º) 22,61 2,23 Subtalar pronation
clinical test (º) 8,42 2,24
* The data regarding pain were obtained through visual analog scales, which were applied at the time of the inclusion criteria. The pain the data refer to is the pain the subjects experienced over the month prior the collection of data
Experiment design and procedures
All participants were informed of procedures to
be conducted, and they signed consent forms (termo
de consentimento livre e esclarecido), according to the
regulations from the Research Ethics Committee from Universidade Estadual do Oeste do Paraná, approved under oicial opinion no. 096/2013
An Anterior Knee Pain Scale questionnaire (AKPS)
that had been validated for the Brazilian population18
was used to evaluate the functional limitations from the subjects. AKPS is a questionnaire with 13 items, and it evaluates subjective symptoms and functional limitations that are associated with anterior knee pain. Subjects are scored in a scale from 0 to 100 points; the total maximum score of 100 indicates no functional limitation. When it is below 82, it indicates a tendency
for patellofemoral disorders19. After answering the
questionnaire, subjects were submitted to two clinical tests; Q angle and subtalar pronation measurements.
Q angle measurement was conducted in the following way: subjects lay on their backs on gurneys, with feet perpendicular to the loor. With a dermographic pencil, anatomic points were marked in the anterior superior iliac spine (ASIS), in the anterior tibial tuberosis (ATT), and also in the superior, inferior, lateral, and medial patellar edges, thus locating the patellar center. Based on those points, two lines were drawn, the irst of which between ASIS and the center of the patella, and the second one between ATT and the patellar center. Following that, with the use of a universal goniometer (CARCI®), a rater
marked the angle between those two lines13. A test is
Subtalar pronation measurement (Figure 1), in turn, was performed on the following manner: with subtalar joints in neutral positions, subjects lay on their backs in gurneys, with their ankles and calcaneus bones parallel to the ground. he neutral position of the subtalar joint was determined through the palpation of the talus bone head in the medial and lateral edges of the talonavicular joint. When the talus bone could not be palpated or was felt to equally protrude to both sides, the neutral position was reconsidered. After that, leg bisection was determined through the palpation of medial and lateral leg regions, regardless of which direction the calcaneal tendon was turned to. he longitudinal calcaneal midline was also estimated through the palpation of medial and lateral calcaneal edges. Vertical lines were drawn with a ruler, in order to support the goniometer alignment. After that stage, subjects were instructed to stand on a bench; the angle between those two lines represented the
subtalar joint angle14. Tests are considered to be positive
when angles are equal to or above 820. he analyzed limb
for both tests was the one afected by PFPS. In case of bilateral pain, the most symptomatic one was analyzed.
Figure 1. Static measurement clinical test of subtalar pronation posture
STATISTICAL ANALYSIS
Data were analyzed through Statistical Package for the
Social Sciences (SPSS v. 18.0, Inc. Chicago, Illinois, USA).
Descriptive statistics was used to characterize subjects, and Shapiro-Wilk conirmed data were normally distributed. Linear and forced-entry multiple regression models were
executed in order to test to which extent clinical tests could predict the related pain and the functional limitations of subjects with PFPS. Associations within each multivariate model were considered to be signiicant when p≤0.05. he predictive power of clinical tests in each multivariate model was determined by the regression coeicients for non-continuous standardized measures (B) with conidence intervals being established at 95%. he general performance of inal models was evaluated through the
use of Nagelkerke’s R2, which estimates the variation of
measures as explained by the model21. Besides that, in order
to verify whether data were correctly adjusted to the model, regression analyses were conducted in order to check for
the presence of outliers, colinearity, or residue. An α=0,05
signiicance level was considered for all analyses.
RESULTS
he average AKPS score and the average pain in subjects are reported in Table 1, with their respective standard deviations.
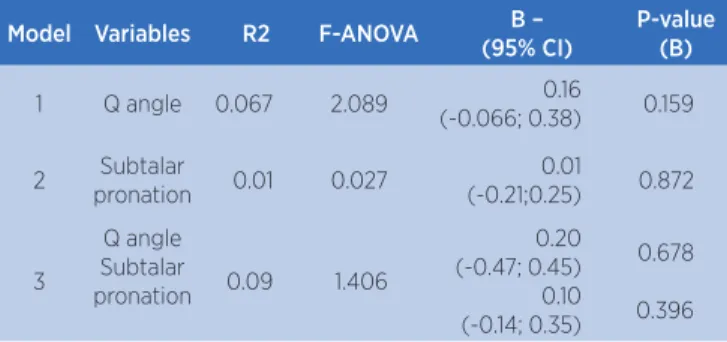
In regards to regression models, a linear regression was irst executed for each clinical test, and then a multiple regression with both tests inserted, in order to identify the pain variation as accounted by the models. he best combination was obtained in the multiple regression model, which was capable of accounting for 9% of the pain that was reported by the subjects with PFPS. No B values were signiicant, and the conidence intervals - established at 95% - were long, ranging from negative to positive (Table 2).
Table 2. Linear and multiple regression models with the values that were found in subtalar pronation and Q angle clinical tests as predictor variables, and pain values as a dependent variable
Model Variables R2 F-ANOVA B –
(95% CI)
P-value (B)
1 Q angle 0.067 2.089 0.16 (-0.066; 0.38) 0.159 2 Subtalar
pronation 0.01 0.027
0.01
(-0.21;0.25) 0.872
3
Q angle Subtalar
pronation 0.09 1.406
0.20 (-0.47; 0.45)
0.10 (-0.14; 0.35)
0.678 0.396
Table 2. Model 1 and model 2 refer to linear regression, and model 3, to multiple regression. Three colinearity cases were identiied in model 3, and subjects were discarded through the forced-entry multiple regression test. P values for the three models were p<0.05
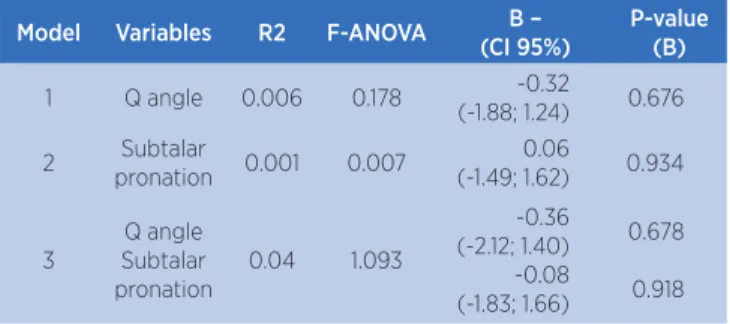
accounting for functional limitations that were found through AKPS questionnaire. Similarly, the best prediction value was found in the multiple regression model, which was capable of accounting for 4% of functional limitations that were mentioned by subjects. As with pain, no B value was signiicant (Table 3).
Table 3. Linear and multiple regression models with the values that were found in subtalar pronation and Q angle clinical tests as predictor variables, and AKPS values as a dependent variable
Model Variables R2 F-ANOVA B –
(CI 95%)
P-value (B)
1 Q angle 0.006 0.178 -0.32
(-1.88; 1.24) 0.676 2 Subtalar
pronation 0.001 0.007
0.06
(-1.49; 1.62) 0.934
3
Q angle Subtalar pronation
0.04 1.093
-0.36 (-2.12; 1.40)
-0.08 (-1.83; 1.66)
0.678 0.918
Table 3. Table 2. Model 1 and model 2 refer to linear regression, and model 3, to forced-entry multiple regression. P values for the three models were p<0.05
he F-ANOVA values, seen in tables 2 and 3, were lower than 1 when the tests were isolatedly inserted in the regression model, with the exception of Q angle as a pain predictor. In turn, F-ANOVA results in the multiple regression models were all above 1.
DISCUSSION
Clinical tests have been used in order to characterize individuals with PFPS; Nonetheless, no studies are found to report how much the results from those tests can account for the pain and functional limitations those individuals undergo. Subtalar joint hyperpronation and excessive Q angles are already well-established in
the literature as being characteristic of PFPS22,23; due
to that, this study investigated the ability from two clinical tests - Q angle and subtalar pronation posture measurements - to predict pain as reported through VAS and functional limitations through AKPS.
In regards to the regression models, the authors took measures to avoid type-II error, as each variable inserted in a model is suggested to be accompanied by a 15-subject sample size. As two predictor variables were used, the 31-subject sample was enough to avoid
compromising the regression quality24. When tests with
linear regressions were inserted in an isolated manner, they were shown to weak in accounting for the pain the subjects reported. For example, the subtalar pronation
clinical test accounted for only 0.1% of the pain variation, which indicated that alteration may exist in PFPS, as
reported by recent studies2,25; nevertheless it shows little
relationship with those individuals’ source of pain. As
reported by Aliberti et al.26, who used a photogrammetry
system to identify the subtalar pronation and Q angle measures in subjects with PFPS, there is no signiicant association between those measures and the pain that is found in PFPS. However, results were improved when the multiple regression model was performed. Together, the tests accounted for 9% of the pain. hose results indicate that, concerning clinical tests, the association among tests can generate better results.
When the regression was performed based on functional limitations, the prediction power of tests was lower than the values obtained with pain. When isolated, the subtalar pronation test accounted for 0.1%, and the Q angle test, for 0.6% of functional limitations in those subjects, which shows that those measures, separately, are even weaker in regards to function. Multiple regression was then again capable of improving the predictive power; together, the variables accounted for
4% of functional limitations. Freedman and Sheehan9
indicated that static measurement instruments cannot predict dynamic functions well, and as the questions in AKPS regard dynami conditions, our results corroborate the statement from that study.
As the PFPS-related literature has several clinical tests which are used as inclusion criteria, the results in this study suggest subtalar pronation and Q angle tests not be used, as they cannot predict pain and functional limitations in individuals with PFPS well.
he relationship between Q angle and PFPS is based on the theoretical model in which increased Q angles represent a source of excessive stress in the
patellofemoral joint27. hat fact causes pain, causing
the PFPS symptoms27. Besides that, there is evidence
that suggests that high Q angle values may lead to
degenerated joint cartilage28. It must be stressed that
assumption is based on the premise that Q angle represents the angle that arises from the quadriceps force vector and the direction the patellar tendon points
towards29 p<0.001. In order to test that concept, the
indings from Freedman et al.30 may back the indings in
line, and to analyze its relationship with patellofemoral kinetics. Corroborating those authors’ hypothesis, the Q angle has not represented the quadriceps action line, and higher Q angle values have not been found to correlate with the lateral patellar course. herefore, the authors suggested that static clinical Q angle measures are not related to PFPS.
Nonetheless, those results question the classic assumption that increased patellofemoral stress is a result from the patella moving towards the femoral condyle. Although it seem to be a reasonable explanation, during weight unloading activities, the contact between the patella and the femoral condyle may be a result
from the excessive femoral rotation under the patella31.
hus, analyzing the Q angle in activities with no weight unloading (Q angle clinical test) may be a strong bias source, as the femur remains ixed throughout the measurement - as it is well established in the literature, femoral rotation may be an important factor in the
event of abnormal Q angles31.
In regards to the standing posture, a possible explanation for the indings in this study is that the theoretical model which supports the relationship between subtalar hyperpronation and individuals with
PFPS32 is based on a dynamic condition. he excessive
range of subtalar pronation movement during the support phase of gait was proposed to result in excessive internal tibial rotation, which could delay or reduce the external tibial rotation range in relation to the femur. his movement is essential to allow for knee extent during the support phase; thus, as a compensatory mechanism, the femur allegedly performs excessive internal rotation, diminishing the contact area of the patellofemoral joint and consequently increasing lateral compression and joint stress, which could enable PFPS
development32. Recently, in the study by De Oliveira
Silva et al.2, individuals with PFPS were evaluated in
the dynamic and static conditions. hey found that, in the dynamic condition, most subjects were found to have excessive subtalar pronation; nevertheless, the same subjects were not found to have altered clinical tests in the subtalar pronation posture.
Future studies on the use of dynamic and functional tests to characterize those individuals are necessary. Results from static tests have not been efective, unlike the ones found by biomechanical parameters in functional conditions. Another subject which must be taken into account is the popularization of biomechanical tools in the
clinical context, as they have been found to yield better results. For example, a study on diagnostic accuracy was capable of diagnosing PFPS through
electromyographic measurements16. he validation
of low-cost electromyographic devices may be an excellent alternative, and it could also contribute to characterize PFPS in the clinical reality.
he lack of studies on prediction analyses for clinical tests in PFPS has limited the comparison of this study with the literature. Another limitation which can be pointed out was the non-inclusion of dynamic clinical tests in order to conirm the hypothesis that dynamic tests can better predict PFPS; however, the authors only opted for using the two classic tests which are often resorted to in the characterization of individuals with PFPS.
CONCLUSION
he results found show that clinical tests for Q angle and subtalar pronation posture measurement are not good predictors for pain and functional limitations which are reported by individuals with PFPS.
REFERENCES
1. Roush JR, Bay RC. Prevalence of anterior knee pain in 18-35 year-old females. Int J Sports Phys Ther. 2012;7(4):396-401. 2. De Oliveira Silva D, Briani RV, Pazzinatto MF, Ferrari D, Aragão
FA, Albuquerque CA et al. Reliability and diferentiation capability of dynamic and static kinematic measurements of rearfoot eversion in patellofemoral pain. Clin Biomech. 2015;30(2):144-8.
3. Nunes GS, Stapait EL, Kirsten MH, Noronha M, Santos GM. Clinical test for diagnosis of patellofemoral pain syndrome: systematic review with meta-analysis. Phys Ther Sport. 2013;14(1):54-9. doi:10.1016/j.ptsp.2012.11.003.
4. Silva CR, Silva DO, Ferrari D, Negrão Filho RF, Alves N, Azevedo FM. Exploratory study of electromyographic behavior of the vastus medialis and vastus lateralis at neuromuscular fatigue onset. Mot Rev Educ Física. 2014;20(2):213-20. doi:10.1590/ S1980-65742014000200012.
5. Silva CR, Silva DO, Aragão FA, Ferrari D, Alves N, Azevedo FM. Inluence of neuromuscular fatigue on co-contraction between vastus medialis and vastus lateralis during isometric contractions. Kinesiology. 2014;46(2):179-85.
6. Lankhorst NE, Bierma-Zeinstra SM, van Middelkoop M. Factors associated with patellofemoral pain syndrome: a systematic review. Br J Sports Med. 2013;47(4):193-206. doi:10.1136/bjsports-2011-090369.
and time domain electromyography parameters in women with patellofemoral pain. Clin Biomech. 2015;30(3):302-7. doi:10.1016/j.clinbiomech.2014.12.014.
8. Nakagawa TH, Serrão FV, Maciel CD, Powers CM. Hip and knee kinematics are associated with pain and self-reported functional status in males and females with patellofemoral pain. Int J Sports Med. 2013;34(11):997-1002. doi:10.1055/s-0033-1334966.
9. Freedman BR, Sheehan FT. Predicting three-dimensional patellofemoral kinematics from static imaging-based alignment measures. J Orthop Res. 2013;31(3):441-7. doi:10.1002/jor.22246.
10. Collins NJ, Bierma-Zeinstra SMA, Crossley KM, van Linschoten RL, Vicenzino B, van Middelkoop M. Prognostic factors for patellofemoral pain: a multicentre observational analysis. Br J Sports Med. 2013;47(4):227-33. doi:10.1136/ bjsports-2012-091696.
11. Cook C, Mabry L, Reiman MP, Hegedus EJ. Best tests/clinical indings for screening and diagnosis of patellofemoral pain syndrome: a systematic review. Physiotherapy. 2012;98(2):93-100.
12. Noehren B, Pohl MB, Sanchez Z, Cunningham T, Lattermann C. Proximal and distal kinematics in female runners with patellofemoral pain. Clin Biomech. 2012;27(4):366-71. doi:10.1016/j.clinbiomech.2011.10.005.
13. Weiss L, DeForest B, Hammond K, Schilling B, Ferreira L. Reliability of goniometry-based Q-angle. PM R. 2013;5(9):763-8.
14. Powers CM, Mafucci R, Hampton S. Rearfoot posture in subjects with patellofemoral pain. J Orthop Sport Phys Ther. 1995;22(4):155-60.
15. Witvrouw E, Callaghan MJ, Stefanik JJ, et al. Patellofemoral pain: consensus statement from the 3rd International Patellofemoral Pain Research Retreat held in Vancouver, september 2013. Br J Sports Med. 2014;48(6):411-4. doi:10.1136/bjsports-2014-093450.
16. Ferrari D, Kuriki HU, Silva CR, Alves N, Mícolis de Azevedo F. Diagnostic accuracy of the electromyography parameters associated with anterior knee pain in the diagnosis of patellofemoral pain syndrome. Arch Phys Med Rehabil. 2014;95(8):1521-6. doi:10.1016/j.apmr.2014.03.028.
17. Crossley KM, Bennell KL, Cowan SM, Green S. Analysis of outcome measures for persons with patellofemoral pain: which are reliable and valid? Arch Phys Med Rehabil. 2004;85(5):815-22. doi:10.1016/S0003-9993(03)00613-0. 18. Cunha RA, Costa LOP, Hespanhol Junior LC, Pires RS, Kujala
UM, Lopes AD. Translation, cross-cultural adaptation, and clinimetric testing of instruments used to assess patients with patellofemoral pain syndrome in the brazilian population. J Orthop Sports Phys Ther. 2013;43(5):332-9. doi:10.2519/ jospt.2013.4228.
19. Kujala UM, Jaakkola LH, Koskinen SK, Taimela S, Hurme M, Nelimarkka O. Scoring of patellofemoral disorders.
Arthroscopy. 1993;9(2):159-63. Disponível em: http://www. ncbi.nlm.nih.gov/pubmed/8461073.
20. Oliveira VM, Detoni GC, Ferreira C, Portela BS, Queiroga MR, Tartaruga MP. Inluência do gradiente de inclinação na pronação subtalar em corrida submáxima. Acta Ortop Bras. 2013;21(3):163-6.
21. Harrell FE Jr, Lee KL, Mark DB. Multivariable prognostic models: issues in developing models, evaluating assumptions and adequacy, and measuring and reducing errors. Stat Med. 1996;15(4):361-87.
22. Piazza L, Vidmar MF, Bortoluzzi LF, Pimentel GL, Santos GM. Avaliação isocinética, dor e funcionalidade de sujeitos com síndrome da dor patelofemoral. Fisioter e Pesqui. 2013;20(2):130-5.
23. Souza TR De, Pinto RZA, Trede RG, Araújo PA, Fonseca HL, Fonseca ST. Pronação excessiva e varismos de pé e perna: relação com o desenvolvimento de patologias músculo-esqueléticas: revisão de literatura. Fisioter e Pesqui. 2011;18(1):92-8.
24. Field A. Discovering statistics using IBM SPSS statistics. 4a ed.
London: Sage; 2013.
25. Neal BS, Griiths IB, Dowling GJ, Murley GS, Munteanu SE, Franettovich Smith MM et al. Foot posture as a risk factor for lower limb overuse injury: a systematic review and meta-analysis. J Foot Ankle Res. 2014;7(1):55. doi:10.1186/ s13047-014-0055-4.
26. Aliberti S, Costa MSX, João SMA, Pássaro A de C, Arnone AC, Sacco I de CN. Clinical rearfoot and knee static alignment measurements are not associated with patellofemoral pain syndrome. Fisioter e Pesq. 2012;19(1):45-51.
27. Mizuno Y, Kumagai M, Mattessich SM, Elias JJ, Ramrattan N, Cosgarea AJ et al. Q-angle inluences tibiofemoral and patellofemoral kinematics. J Orthop Res. 2001;19(5):834-40. doi:10.1016/S0736-0266(01)00008-0.
28. Utting MR, Davies G, Newman JH. Is anterior knee pain a predisposing factor to patellofemoral osteoarthritis? Knee. 2005;12(5):362-5. doi:10.1016/j.knee.2004.12.006.
29. Herrington L. Does the change in Q angle magnitude in unilateral stance difer when comparing asymptomatic individuals to those with patellofemoral pain? Phys Ther Sport. 2013;14(2):94-7.
30. Freedman BR, Brindle TJ, Sheehan FT. Re-evaluating the functional implications of the Q-angle and its relationship to in-vivo patellofemoral kinematics. Clin Biomech. 2014;29(10):1139-45. doi:10.1016/j.clinbiomech.2014.09.012. 31. Powers CM. The inluence of altered lower-extremity
kinematics on patellofemoral joint dysfunction: a theoretical perspective. J Orthop Sports Phys Ther. 2003;33(11):639-46. 32. Tiberio D. The efect of excessive subtalar joint pronation