ISSN 0104-6632 Printed in Brazil
www.abeq.org.br/bjche
Vol. 33, No. 02, pp. 415 - 426, April - June, 2016 dx.doi.org/10.1590/0104-6632.20160332s20150341
*To whom correspondence should be addressed
Brazilian Journal
of Chemical
Engineering
ETHANOL DEHYDRATION IN PACKED
DISTILLATION COLUMN USING GLYCEROL
AS ENTRAINER: EXPERIMENTS AND HETP
EVALUATION
W. L. R. Souza, C. S. Silva, L. A. C. Meleiro and M. F. Mendes
*Universidade Federal Rural do Rio de Janeiro, Chemical Engineering Department, Technology Institute, BR 465, km 7, CEP 23897-000, Seropédica, Rio de Janeiro - RJ, Brazil.
E-mail: [email protected]
(Submitted: May 29, 2015 ; Accepted: June 10, 2015)
Abstract - The ethanol-water separation is very important because ethanol is widely applied in the chemical industry and its use as a fuel can reduce the pollution emitted to the air. However, anhydrous ethanol production using conventional distillation is impossible, at atmospheric pressure, due to the presence of an azeotrope. In the present work, experimental tests were carried out in order to evaluate the use of glycerol as an entrainer, in substitution of ethylene glycol in an extractive distillation. The use of glycerol is motivated by the biodiesel production units, due to the fact that it is the main byproduct and a new market is necessary to consume its overproduction. The experiments were carried out in a distillation column packed with Raschig rings, varying the glycerol/feed (ethanol and water) ratio, S/F, from 0.5 to 0.9. The samples were analyzed using a digital densimeter. The results showed that glycerol was effective to promote ethanol dehydration and the presence of an azeotrope was not observed using a solvent to feed ratio (S/F) equal to 0.9. Some empirical correlations were investigated to evaluate the HETP (Height Equivalent to a Theoretical Plate), and the results provided a useful tool for designing a packed bed column for ethanol-water separation.
Keywords: Extractive distillation; Packing; Azeotrope; Mass transfer; Biofuel.
INTRODUCTION
In recent years increasing efforts have been made to produce biofuels in order to replace fossil fuels. This tendency is confirmed by the high investment and numerous researches in this area. Moreover, fos-sil fuels are associated with environmental problems and subjected to high price volatility. Besides bio-diesel, ethanol is also a good choice to replace petro-leum fuels, since it has already been used as an ad-dictive to gasoline or to completely substitute this fuel. In Brazil, for example, according to the government laws gasoline must be mixed with 22-27% of
anhy-drous ethanol. Another reason to use ethanol is that it is a clean-burning fuel and reduces the air pollution.
Ethanol uses are not restricted to fuel applica-tions; for example, in the chemical industry ethanol is widely used as an important reactant, an interme-diate compound or solvent to produce products of industrial interest (perfumes, paints, detergents, aero-sols and medicines). Moreover, biodiesel can also be produced by using anhydrous ethanol as reactant (Gil, 2008).
etha-Brazilian Journal of Chemical Engineering
nol is not feasible by using conventional distillation at atmospheric pressure, due to the formation of an azeotrope. There are several alternative processes that can be used to produce absolute ethanol, and one of the most applied is extractive distillation due to the lower energetic consumption and lower invest-ment and operational costs (Uyazán, 2006).
Summarizing, extractive distillation is the vapori-zation of a mixture with addition of a high boiling point compound, known as a separating agent, solvent or entrainer, in order to change the relative volatil-ities of the original mixture. The mechanism associ-ated with this phenomenon is the selective molecular association of the solvent with one of the compo-nents of the mixture in the liquid phase. As a result, a given separation can be achieved using smaller dis-tillation columns and azeotropes can be “broken” (Further, 1974; Perry and Chilton, 1980).
Since the entrainer does not form an azeotrope with any of the original compounds, its regeneration is carried out in a second distillation column in order to promote the recycling to the extractive column. The solvent recovery in extractive distillation is eas-ier than in azeotropic distillation. In addition, extrac-tive distillation is simpler and more widely applied than azeotropic distillation (Perry and Chilton, 1980).
It is worth to mention that, in the past, several separating agents were proposed to dehydrate etha-nol in order to achieve energy savings and/or sub-stitute a toxic solvent. Benzene, for example, was widely used as separating agent, but due to its tox-icity and adverse health effects, today this practice is against the law. Ethylene glycol is the usual sol-vent to promote absolute ethanol recovery, since it is a relatively low toxicity compound (Ravagnani et al., 2010).
In this context, the present work proposes the use of glycerol as entrainer for the ethanol-water separa-tion process. Since glycerol is a co-product of bio-diesel processing, its production is increasing greatly and, as a result, there are several researches on glyc-erin applications. The use of glycglyc-erin as a separating agent for ethanol dehydration may suggest an impor-tant integrated process concept, known as biorefin-ery. Packed distillation columns of small diameters can be employed since they are, generally, cheaper than the plate columns.
The design of a packed bed is based on the HETP concept, which is a function of mass transfer coeffi-cients and the effective interfacial area. In this work, some of the most applied general HETP correlations were evaluated in order to use the best one as a tool for providing useful information for the scale-up procedure.
PREVIOUS WORK
Schneible (1923) was the first to use glycerol as an entrainer to dehydrate ethanol. The author pro-posed a continuous process using a plate distillation column, with a spray of glycerol being charged into the top of the extractive column.
The engineer Mariller (1924) proposed an absorp-tion process to dehydrate ethanol using a plate distil-lation column. This process is similar to that pro-posed by Schneible (1923), the feed condition, vapor of hydrated ethanol, being one of the most important differences. This process was used in Europe up to 1960 and was forgotten due to economic and techni-cal problems, especially degradation and the high cost of glycerol (Drummond, 2004).
Lee and Pahl (1985) studied the effect of 11 po-tential solvents to “break” the ethanol-water azeotrope and concluded that the glycols are the best solvents to eliminate the azeotrope, being glycerol the most effective one.
Gil et al. (2005) studied the use of a mixture of glycerol-ethylene glycol as entrainer for ethanol dehydration by extractive distillation. The authors used the software Aspen Plus to simulate a continu-ous process with two distillation plate columns: an extractive and a solvent regeneration one. They varied the composition of the entrainer and it was con-cluded that glycerol is more effective than ethylene glycol.
Uyazán et al. (2006) simulated the use of glycerol for ethanol dehydration using the software Aspen Plus. The process simulated was constituted of two continuous distillation plate columns, like the proc-ess simulated by Gil et al. (2005). Uyazán et al.
(2006) demonstrated that the use of glycerol allows anhydrous ethanol production using smaller distilla-tions columns and the energy consumption is lower than using ethylene glycol.
Dias et al. (2008) simulated an alternative con-tinuous process to produce absolute ethanol using the software UniSim. The proposal of the authors is con-stituted by a single plate distillation column, operat-ing under vacuum in order to avoid decomposition of the glycerol. According to the authors, this proposal allows investment and operational cost savings. How-ever, it was demonstrated that this configuration is more economical when using ethyleneglycol.
Ethanol Dehydration in Packed Distillation Column Using Glycerol as Entrainer: Experiments and HETP Evaluation 417
Brazilian Journal of Chemical Engineering Vol. 33, No. 02, pp. 415 - 426, April - June, 2016
ethanol. Packed distillation columns have the advan-tage of lower cost in comparison to plate columns and can be easily used in small industrial distillation units.
Due to all that was cited above, the aim of this work was to study ethanol dehydration in a batch extractive distillation column using glycerol as en-trainer. Experiments were carried out in a distillation column packed with Raschig rings in order to study the influence of glycerol on the ethanol-water vapor-liquid equilibrium. The column performance was evaluated by HETP calculation using the generalized correlations of Onda et al. (1968), Bolles and Fair (1982) and Bravo and Fair (1982), because they have been largely used in packed bed design.
MATERIALS AND METHODS
Chemicals
The solutions used in this work were prepared with glycerol (99.5% minimum purity), absolute ethanol (minimum 99.8% purity), and distilled water. The binary systems were ethanol-water mixtures containing 0.20, 0.40, 0.60 and 0.85 ethanol mole fractions, with three different solvent to feed ratios (S/F): 0.5, 0.7 and 0.9 in weight fraction. These val-ues of S/F were chosen according to Furter (1974), based on the fact that liquid separator agents are generally present between 50 and 90% of the liquid phase.
Experimental Apparatus
Figure 1 show the experimental unit used in this work. The experimental tests were performed in a laboratory scale distillation column with a packed section (37 cm height and 5.9 cm of internal diame-ter) containing Raschig rings made of glass and nominal size of 0.73 cm. Temperature was checked with thermometers placed at the top and at the bottom of the packed section. The unit contains a condenser, a serpentine type, with 50 cm height, and the reboiler is a 6 L unit with 750 W of heat supply. Samples of the studied mixture were taken from two valves, placed at the top and at the bottom of the packed section.
Sample Analysis
The composition of the samples was obtained using the experimental measurements of specific mass, using a digital densimeter (GEHAKA, DSL
920 model). A previous calibration curve was ob-tained by preparing ethanol-water mixtures of known mole composition and analyzing in the digital den-simeter. The values of specific mass of these mix-tures were adjusted with a fifth-order polynomial. The calibration curve obtained for the specific mass of the ethanol-water system was used to determine the ethanol mole fractions of the samples.
Figure 1: Packed distillation column used in this work: 1) feed point; 2) heat supplier; 3) reboiler; 4) liquid temperature measurement; 5) vapor tempera-ture measurement; 6) bottom thermometer; 7) packed section; 8) Background sampling; 9) top sampling; 10) condenser; 11/12) inlet and outlet temperatures measurements of condenser; 13) top thermometer; 14) selector and indicator of the temperature
Experimental Procedure
Brazilian Journal of Chemical Engineering
bottom of the packed section and analyzed in the digital densimeter. All runs were carried out at atmos-pheric pressure.
HETP Calculation
The packed bed design is based on the HETP con-cept, according to Equation (1). HETP values are a measure of the packing efficiency in such a way that, when HETP values decrease, the packing efficiency increases. The height of a packed bed can be calcu-lated from Equation (1).
HETP Z
N
(1)
HETP values depend on mass transfer coeffi-cients, which are related to HETP by Equation (2). In this equation the effect of mass transfer is repre-sented by the height of an overall mass transfer unit,
HOV, given by Equation (3).
ln HETP
1
OV
H
(2)
OV V L
H H H (3)
The mass transfer coefficients are related to the height of the liquid and vapor phases in the transfer unit by Equations (4) e (5).
L L
L e L
G H
k a
(4)
V V
V e V
G H
k a M P
(5)
The overall transfer unit method used to estimate HETP is widely applied because it is mathematically simple and provides reliable results when using ap-propriate safety factors (Caldas and Lacerda, 1988). Several empirical correlations have been proposed over the years in order to allow the estimation of HETP by this method.
HETP Correlations – Onda et al. (1968)
Onda et al. (1968) presented empirical equations for the mass transfer coefficients of the vapor and liquid phases. They also developed a correlation for the wetted area, taking into account the liquid
sur-face tension that can be applied, with a deviation of ±20%, to a packing column with Raschig rings, Berl saddles and spheres. The interfacial area equation is general, because it takes into account the packing material. The proposed correlations are shown in Equations (6), (7) and (8), with the dimensionless parameters calculated by Equations (9), (10) and (11).
0.7 1
2 3
2
V
V
V p p C
p V p V
RT G
k a d S
a D a
(6)
2 1
1 3
3 0.4
2
0.0051
L
L L
L p p C
L w L
G
k a d S
g a
(7)
0.75 0.1 0.05 0.2
1 exp 1.45 Re
w
L L L
p C
a
Fr We a
(8)
L
L e
p L
G R
a
(9)
2 2 L
p L
R
L
a G F
g
(10)
2 L
L e
p L
G W
a
(11)
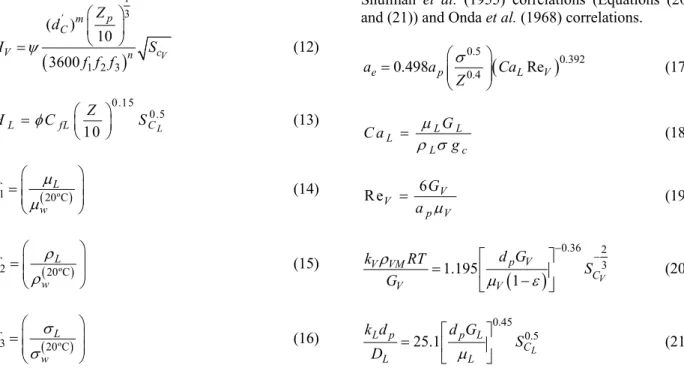
HETP Correlations – Bolles and Fair (1982)
These authors extended the data bank used by Cornell et al. (1960) and developed an improved model for the height of a transfer unit using 545 ob-servations, obtained from 13 original sources. This data bank covers a wide range of operating condi-tions, different column diameters, and packing types. Instead of mass transfer coefficients, the authors correlated physical properties, packing dimensions and hydrodynamic factors to the height of a transfer unit of liquid and vapor phases. The model proposed is shown in Equations (12) and (13). In these equa-tions the mass transfer influence is expressed by the and constants, which are obtained graphically and depend on flood point estimation. The m and n constants are, respectively, 1.24 and 0.6 for Raschig rings and 1.11 and 0.5 for Berl saddles. The factors
Ethanol Dehydration in Packed Distillation Column Using Glycerol as Entrainer: Experiments and HETP Evaluation 419
Brazilian Journal of Chemical Engineering Vol. 33, No. 02, pp. 415 - 426, April - June, 2016
1 3 ´
1 2 3
( ) 10 3600 V p m C
V n c
Z d
H S
f f f
(12)
0.15 0.5
1 0 L
L fL C
Z H C S
(13)
1 20ºCL
w
f
(14)
2 20ºCL
w f (15) 3 20ºCL
w
f
(16)
HETP Correlations – Bravo and Fair (1982)
Bravo and Fair (1982) presented a correlation for effective area of mass transfer (Equation (17)), spe-cific for distillation processes. These authors evalu-ated 231 runs covering 11 systems from the Bolles and Fair (1982) data bank. The model does not re-quire the flooding information and can be applied to any regular packing with a deviation of ±20%. Equa-tion (17) requires the calculaEqua-tion of the dimensionless parameters given by Equations (18) and (19). The mass transfer coefficients of the model proposed by Bravo and Fair (1982) were determined using the
Shulman et al. (1955) correlations (Equations (20) and (21)) and Onda et al. (1968) correlations.
0.5
0.392 0.4
0.498 Re
e p L V
a a Ca Z
(17)
L L L L c G C a g
(18)
6
R e V
V
p V
G a
(19)
0.36 2 3 1.195 1 V p V V VM C V V d G k RT S G (20)
0.45 0.5
25.1
L
L p p L
C
L L
k d d G S
D
(21)
RESULTS AND DISCUSSIONS
As explained previously, the experiments were done in triplicate using solutions of ethanol and water varying the ethanol content from 20 to 85% and varying the S/F ratios from 0.5 to 0.9. Figures 2, 3, 4 and 5 show the experimental results obtained in all cases studied. Experiments without glycerol were carried out in order to observe the solvent effect of the ethanol-water vapor-liquid equilibrium. All mole fraction values in the figures are represented on a solvent-free basis.
0.2 0.2 - S/F=0.5 0.2 - S/F=0.7 0.2 - S/F=0.9 0 0.25 0.5 0.75 1 Experiment E thanol m ol e f rac ti on Feed 0.505 0.724 0.538 0.734 0.501 0.735 0.532 0.758 Bottom Top
0.4 0.4 - S/F=0.5 0.4 - S/F=0.7 0.4 - S/F=0.9 0 0.25 0.5 0.75 1 Experiment E thano l m ol e f rac ti on Feed 0.555 0.778 0.642 0.764 0.645 0.787 0.686 0.819 Bottom Top
Figure 2: Experimental results of the feed with 0.2 ethanol mole fraction.
Brazilian Journal of Chemical Engineering 0.6 0.6 - S/F=0.5 0.6 - S/F=0.7 0.6 - S/F=0.9
0 0.25 0.5 0.75 1
Experiment
E
thanol
m
ol
e
fr
ac
ti
on Feed
0.682 0.812
0.753 0.816
0.773 0.823
0.785 0.822
Bottom Top
0.85 0.85 - S/F=0.5 0.85 - S/F=0.7 0.85 - S/F=0.9 0.5
0.625 0.75 0.875 1
Experiment
E
than
ol
m
ol
e f
rac
ti
on
Feed 0.872 0.883 0.889 0.891
0.894 0.894
0.913 0.916
Bottom Top
Figure 4: Experimental results of the feed with 0.6 ethanol mole fraction.
Figure 5: Experimental results of the feed with 0.85 ethanol mole fraction.
In order to evaluate the effect of glycerol as en-trainer in the ethanol dehydration process, statistics tests were performed using the triplicate measure-ments obtained for each distillation process. The main parameters of the analysis of variance (ANOVA) for top and bottom products are shown in Tables 1 and 2, respectively.
Based on the ANOVA results exhibited in Tables 1 and 2, the following conclusions can be deduced. Low values obtained for standard deviations (less than 3%), as well as for all coefficient of variations (less than 5%), indicate the good reproducibility of the experi-mental procedure, which means that the results pre-sented in this work are reliable.
Table 1: Analysis of variance of experimental data of top products (Fcritical = 4.0661).
Ethanol Systems Statistical Analysis
xfeed S/F
ratios x CV Fcalc p-value
0.20
0% 0.724 0.001 0.0008
5.6239 0.0226 50% 0.734 0.010 0.0142
70% 0.735 0.007 0.0089 90% 0.758 0.017 0.0225
0.40
0% 0.778 0.011 0.0143
4.3509 0.0427 50% 0.764 0.009 0.0117
70% 0.787 0.022 0.0273 90% 0.816 0.026 0.0313
0.60
0% 0.812 0.010 0.0126
0.6093 0.6275 50% 0.816 0.005 0.0058
70% 0.823 0.010 0.0117 90% 0.822 0.019 0.0226
0.85
0% 0.883 0.006 0.0069
8.3237 0.0076 50% 0.891 0.010 0.0115
70% 0.894 0.012 0.0133 90% 0.916 0.003 0.0029
xfeed stands for ethanol mole fraction in the feed solution, x is the mean
value of the ethanol fraction in distillation products, , and CV are the related standard deviation and variation coefficient, while Fcalc and
Fcritical are the calculated and critical F-values, respectively.
Table 2: Analysis of variance of experimental data of bottom products (Fcritical = 4.0661).
Ethanol Systems Statistical Analysis
xfeed S/F
ratios x CV Fcalc p-value
0.20
0% 0.505 0.006 0.0121
3.3520 0.0761 50% 0.538 0.015 0.0271
70% 0.501 0.030 0.0059 90% 0.532 0.010 0.0196
0.40
0% 0.555 0.011 0.0191
130.0957 3.97 x 10⁻⁷
50% 0.642 0.003 0.0041 70% 0.645 0.005 0.0072 90% 0.685 0.012 0.0169
0.60
0% 0.682 0.013 0.0188
44.5616 2.44 x 10⁻⁵
50% 0.753 0.006 0.0081 70% 0.773 0.010 0.0131 90% 0.785 0.016 0.0207
0.85
0% 0.872 0.013 0.0147
10.9722 0.0033 50% 0.889 0.009 0.0102
70% 0.894 0.006 0.0068 90% 0.913 0.005 0.0056
It can be observed that, when the ethanol mole fraction in the feed increases, the ethanol mole frac-tions in the top and bottom products also increase. This feature was already expected since as the etha-nol content increases, the relative volatility of the ethanol-water system decreases.
Considering the experimental apparatus used, and the operational conditions investigated in this work, the calculated F-values and p-values indicate that the addition of solvent in the distillation column was ef-fective, meaning that the use of glycerol promoted the enrichment of the original mixture in ethanol con-tent. Only two exceptions were observed, the sys-tems corresponding to xfeed = 0.6 (top) and xfeed = 0.2
(bottom), since they presented calculated F-values lower than the critical one (Fcritical = 4.0661), and
Ethanol Dehydration in Packed Distillation Column Using Glycerol as Entrainer: Experiments and HETP Evaluation 421
Brazilian Journal of Chemical Engineering Vol. 33, No. 02, pp. 415 - 426, April - June, 2016
effect observed in the bottom section for xfeed = 0.2
probably occurred due to the low ethanol content in these feed solutions, making the separation process more difficult. On the other hand, the same behav-iour observed in the top section for xfeed = 0.6 is not so
obvious and will be properly discussed considering the Tukey’s multiple comparison test presented below.
In order to verify the statistical difference among the products obtained at the top and bottom sections of the distillation column using different S/F ratios (i.e., the effect of glycerol on the separation process), the Tukey’s multiple comparison test was performed and the results are summarized in Table 3. In this table, for a given xfeed, the same letters in the
result-ing ethanol fraction (x) indicate that the top and/or bottom products were not significantly different from each other.
Table 3: Tukey’s test of experimental data for the top and bottom products.
Ethanol Systems
Results of the Multiple Comparison Test
Top Bottom
xfeed S/F ratios x x
0.20
90% 0.758 a
0.532a
70% 0.735 a
0.501a
50% 0.734 a,c
0.538a
0% 0.724 b,c
0.505a
0.40
90% 0.816 a
0.685a
70% 0.787 a,c
0.645b,c
50% 0.764 b,c
0.642b,c
0% 0.778 a,c
0.555b,d
0.60
90% 0.822 a
0.785a
70% 0.823 a
0.773a
50% 0.816 a
0.753b
0% 0.812 a
0.682c
0.85
90% 0.916 a
0.913a
70% 0.894 b
0.894b
50% 0.891 b
0.889b
0% 0.883 b
0.872b
From a broad analysis of the results exhibited in Table 3, it is possible to conclude that the effect of glycerol as entrainer was more effective in the bot-tom section of the distillation column, since there are more results that are statistically different from each
other in this section. This can probably be explained due to the reduced dimension of the packed section of the distillation column, that provides only one sepa-ration stage, and to the fact that the column operates with no solvent flow in this section. Besides, consid-ering the absence of glycerol in the packed section, the effect of glycerol on the feed composition only occurs in the reboiler.
In order to obtain complementary analysis of the glycerol effect on the distillation process, more infor-mation obtained from the Tukey’s test is presented in Table 4. In this table, the signal “≠” indicates, for a given xfeed, which changes in the S/F ratios produced
top and/or bottom products (x) significantly differ-ent from each other. The numbers in pardiffer-entheses correspond to the p-value (bi-caudal) obtained from the Tukey’s test for the associated pair of S/F ratios. The highlighted lines in Table 4 show the compari-son between distillation products obtained from feed solutions without solvent to those obtained from feed solutions with different glycerol content, while the other lines show the comparison between distillation products obtained from feed solutions with different glycerol content.
From the results shown in the Table 4, it is possi-ble to conclude that approximately 40% of the entire set of experiments produced ethanol mole fractions (top and bottom sections) statistically different from each other. It is also clear that the solvent effect was most effective in bottom section, which presented 54% of the results statistically different from each other. The corresponding result obtained in the top section is close to 25%.
Considering only the experiments where the dis-tillation products obtained from feed solutions with-out solvent were compared to those obtained from feed solutions with different glycerol content (the highlighted lines in Table 4), 42% of the distillations produced results statistically different from each other. Again, the solvent effect was more effective in the bottom section, since 58% of these results are statistically different, against 25% in the top section.
Table 4: Effect of entrainer on distillation products in top and bottom sections.
Compared S/F ratios
Top products Bottom products
xfeed xfeed
0.2 0.4 0.6 0.85 0.2 0.4 0.6 0.85
0% to 50% ≠(0.02%) ≠(0.10%)
0% to 70% ≠(4.85%) ≠(0.02%) ≠(0.10%)
0% to 90% ≠(2.60%) ≠(0.10%) ≠(0.01%) ≠(0.07%) ≠(0.68%)
50% to 70% ≠(4.48%)
50% to 90% ≠(2.97%) ≠(1.44%) ≠(0.34%) ≠(3.21%) ≠(1.63%)
Brazilian Journal of Chemical Engineering
It can also be concluded that the enrichment of the ethanol solution at the top section due to the sol-vent was only observed when the highest S/F ratio (90%) was used, since the p-value obtained for the result related to S/F ratio = 70% is too close to the required significance level, fixed at 5%. At the bot-tom section, the enrichment of the ethanol-water solutions due to the solvent effect was not observed in dilute feed solutions (xfeed = 0.2), while for feed
solutions with intermediate ethanol content (xfeed =
0.4 and 0.6) this effect is present in all S/F ratios. However, for higher concentration feed solutions (xfeed = 0.85), the solvent effect was only observed
for S/F ratio = 90%.
According to the results shown in Table 3, the azeotrope breaking was only obtained in the experi-ment corresponding to xfeed = 0.85 and S/F ratio = 90%,
were top and bottom products exhibited ethanol mole fractions higher than the azeotropic composition (x= 0.916 and 0.913, respectively). This value of S/F ratio to break the azeotrope is in accordance with the simulation result found by Uyazán et al. (2006).
In this work, the results obtained from feed solu-tion containing 85 mole% of ethanol were very prom-ising, and indicate the proper operational conditions for producing anhydrous ethanol by using glycerol as entrainer. The results obtained from experiments without glycerol are in agreement with the results found by Jing et al. (2010). These authors studied the ethanol-water separation using a batch distillation column with a packed rectification section (25 cm of height and 30 mm of internal diameter) and a packed extractive distillation section (1 m of height and 30 mm of internal diameter). The packing used by the authors was Dixon rings with characteristic diameter of 3 mm. Operating under total reflux and starting from a feed containing 88 mole% of ethanol, Jing et al. (2010) observed the azeotrope composition in the absence of a separating agent. In the present work, starting from feed solution containing 85 mole% ethanol, and operating in the absence of glycerol, the azeotrope composition was also observed (see Table 3). The azeotropic mixture was also observed in ex-periments carried out with the same feed solution (xfeed = 0.85) and using S/F ratios of 50% and 70%,
since the products obtained after distillation using these S/F ratios are not significantly different from that obtained in free-solvent conditions (see the high-lighted lines in Table 4).
It should be remarked that ethanol was not pro-duced in anhydrous condition probably due to the absence of glycerol in the packed section. This hy-pothesis can be better evaluated by the results found by Jing et al. (2010), since they used solvent (ethylene
glycol) flow in the packed section and obtained prod-ucts with higher ethanol content.
In addition, despite the use of a liquid separating agent, the absence of glycerol in all samples was observed. This result was confirmed because, when the S/F increases, the specific mass of the bottom and top products decreases. If glycerol was being dragged over, the expected tendency would be the increase of specific mass of the top and bottom prod-ucts, since glycerol is heavier than ethanol and water. In addition, the temperatures measured in the packed section of the column during the experiments with-out solvent (abwith-out 80 ºC) were similar to the meas-urements obtained in the experiments using glycerol. This fact indicates that the products are free of en-trainer, since the glycerol boiling point at 1 atm is 290 ºC (Reid et al., 1987). Finally, the absence of glycerol in all samples was also confirmed by a NMR (nuclear magnetic resonance) analysis. This fea-ture is very important because the final product does not require any additional separation process.
HETP ESTIMATION RESULTS
In this section HETP values from the models (Onda et al., 1968; Bolles and Fair, 1982; Bravo and Fair, 1982) were predicted and compared with HETP pseudo-experimental, values calculated by Equation (22), where Z=37 cm and N is given by the Fenske equation (Henley and Seader, 1981), which requires the experimental values of the compositions. Relative deviations (RD) between predicted and pseudo-experimental values were calculated by Equation (23). All physical properties required by generalized correlations were calculated according to Reid et al.
(1987). The evaluation of the HETP models was not done for the experiments using the feed with 85 mole% of ethanol. This was because the top and bottom samples were very similar in composition, causing some inconsistencies in the Fenske equation and in HETP models prediction.
exp
HETPpseudo erimental Z
N
(22)
exp
exp
HETP
HETP
(%) 100
HETP
pseudo erimental
predicted
pseudo erimental
RD
(23)
Ethanol Dehydration in Packed Distillation Column Using Glycerol as Entrainer: Experiments and HETP Evaluation 423
Brazilian Journal of Chemical Engineering Vol. 33, No. 02, pp. 415 - 426, April - June, 2016
obtained from the Onda et al. (1968) correlation for all the systems investigated in the experimental section.
Table 5: HETP predicted from Onda et al. (1968).
System HETP pseudo-experimental
(cm)
HETP predicted (cm)
RD (%)
0.2 18.5 10.6 42.5
0.2 - S/F=0.5 18.5 10.7 42.0
0.2 - S/F=0.7 18.5 10.7 42.2
0.2 - S/F=0.9 18.5 10.5 43.0
0.4 12.3 10.7 13.2
0.4 - S/F=0.5 18.5 10.6 43.0
0.4 - S/F=0.7 12.3 10.4 15.5
0.4 - S/F=0.9 12.3 10.1 18.5
0.6 12.3 10.2 17.5
0.6 - S/F=0.5 18.5 9.9 46.4
0.6 - S/F=0.7 18.5 9.9 46.0
0.6 - S/F=0.9 18.5 9.9 46.4
It can be noted from Table 5 that the highest predicted value is 10.74 cm and the lowest is 9.01 cm, leading to a maximum difference of 1.73 cm. The reason that all the predicted values are close to each other is related to the proximity of the physical properties calculated for all cases. The lower deviation was 13.18% and the highest, 46.44% and the predictions were lower than the pseudo-experimental results. This behavior could occur because of the surface tension of the systems studied, since the ratio σC/ σL was outside the range of correlation applicability. If the surface tensions were greater, the application range would be respected and the estimate of the wetted area would be smaller. Consequently, the predicted HETP would increase, reducing the deviations.
Soares (2010) also evaluated the HETP of the experimental unit of this work. The author studied the ethanol-water separation using some salts: NaCl, CaCl2, Ca(NO3)2, CH3COOK, CH3COONa and a mixture of the latter two. Two different feeds were studied, 2 mole% and 0.25 mole% of ethanol. The water-acetic acid separation was also studied. For the Onda et al. (1968) model, the predicted HETP obtained by Soares (2010) varied between 11.51 and 16.27 cm, the average predicted value being 12.83 cm. The minimum RD was 0.84% (water-acetic acid system) and the maximum 67.40%. The higher RDs were observed for all feeds with higher ethanol content. The HETP values obtained in the present work were slightly lower when compared with the results obtained by Soares (2010).
The Onda et al. (1968) correlation presents a safety factor of 2.23 to cover 95% of real cases; thus, the results in Table 5 are within this range.
The estimations for the HETP obtained by using the model of Bolles and Fair (1982) are shown in Table 6. This correlation provided HETP values greater than those obtained from Onda et al. (1968) and, as a consequence, the deviations from the pseudo-experimental values were smaller.
Table 6: HETP predicted from Bolles and Fair (1982).
System HETP pseudo-
experimental (cm)
HETP predicted (cm)
RD (%)
0.2 18.5 13.4 27.8
0.2 - S/F=0.5 18.5 13.7 25.9
0.2 - S/F=0.7 18.5 15.5 16.3
0.2 - S/F=0.9 18.5 15.8 14.5
0.4 12.3 15.9 29.0
0.4 - S/F=0.5 18.5 14.8 20.0
0.4 - S/F=0.7 12.3 15.6 26.1
0.4 - S/F=0.9 12.3 15.7 26.9
0.6 12.3 15.5 25.9
0.6 - S/F=0.5 18.5 15.2 17.6
0.6 - S/F=0.7 18.5 15.0 18.5
0.6 - S/F=0.9 18.5 15.1 18.4
Since the correlation of Bolles and Fair (1982) was not developed based on effective interfacial area, it has a strong dependence on liquid and vapor flow rates. Lower predicted values for HETP are related to higher flow rates, particularly the liquid flow rate, because the contribution of the height of the liquid phase in the mass transfer unit was higher than the vapor phase. This is in agreement with the expected result, because when the flow rate increases, it improves surface wettability and the effectiveness of the mass transfer.
Deviations obtained from the model proposed by Bolles e Fair (1982) usually did not exceed 30%. In this context, it is important to remember that the safety factor for this correlation is 1.7; thus, due to the low deviations observed, a small safety factor can be applied for this system. According to the au-thors, this strategy is used to determine HETP and it depends on the designer’s experience.
Brazilian Journal of Chemical Engineering
HETP predictions were also carried out using the Bravo and Fair (1982) correlation. In this approach, two different equations were used to determine the mass transfer coefficients: Shulman et al. (1955) the Onda et al. (1968). The results are shown in Tables 7 and 8, respectively.
Table 7 shows that the Bravo and Fair (1982) cor-relation using the Shulman et al. (1955) equations for computing the mass transfer coefficients provided HETP values lower than those obtained by using the Onda et al. (1968) equations, with deviations ranging from 7.6 to 47.49%. These results are related to the higher values of the mass transfer coefficients ob-tained by this approach, particularly KV, despite the
small effective interfacial area, causing a reduction in HETP values. The safety factor proposed by Bravo and Fair (1982) is 1.6 and, if it is applied, deviations will be even smaller. For this model, Soares (2010) obtained HETP predicted values higher than the pseudo-experimental ones, with the predictions vary-ing from 38.74 to 70.07 cm. The RD varied from 4.71% to 468%.
Table 7: HETP results obtained from Bravo and Fair (1982), using the Shulman et al. (1955) equations to obtain KV and KL.
System HETP pseudo-experimental
(cm)
HETP predicted (cm)
RD (%)
0.2 18.5 9.8 47.1
0.2 - S/F=0.5 18.5 9.7 47.5
0.2 - S/F=0.7 18.5 12.3 33.7
0.2 - S/F=0.9 18.5 12.0 35.5
0.4 12.3 11.4 7.6
0.4 - S/F=0.5 18.5 10.0 45.7
0.4 - S/F=0.7 12.3 10.8 12.8
0.4 - S/F=0.9 12.3 10.6 14.0
0.6 12.3 10.5 14.7
0.6 - S/F=0.5 18.5 10.3 44.3
0.6 - S/F=0.7 18.5 10.1 45.2
0.6 - S/F=0.9 18.5 10.2 45.0
Table 8 shows that the Bravo and Fair (1982) cor-relation coupled with the Onda et al. (1968) equa-tions for computing the mass transfer coefficients provided high deviations, all over 100%. The pre-dicted values were higher than those obtained by the pseudo-experimental approach, and varied from 37.57 to 40.09 cm. This correlation led to the highest HETP values obtained in this study. Using the Onda et al.
(1968) model, Soares (2010) also obtained HETP predicted values higher than pseudo-experimental, between 45.99 and 64.89 cm. Due to this, the RD obtained by the author varied from 32.42% to 426.1%.
Table 8: HETP results obtained from Bravo and Fair (1982), using the Onda et al. (1968) equations to obtain KV and KL.
System HETP pseudo-experimental
(cm)
HETP predicted (cm)
RD (%)
0.2 18.5 37.9 104.7
0.2 - S/F=0.5 18.5 37.6 103.0
0.2 - S/F=0.7 18.5 39.2 112.1
0.2 - S/F=0.9 18.5 40.0 116.5
0.4 12.3 38.5 212.0
0.4 - S/F=0.5 18.5 38.9 110.0
0.4 - S/F=0.7 12.3 39.3 218.2
0.4 - S/F=0.9 12.3 40.1 225.1
0.6 12.3 39.4 219.4
0.6 - S/F=0.5 18.5 39.6 114.1
0.6 - S/F=0.7 18.5 39.7 114.7
0.6 - S/F=0.9 18.5 40.0 116.5
Comparing the correlations proposed by Onda et al. (1968) and Bravo and Fair (1982), it is clear that the latter one led to small effective interfacial areas, providing the highest HETP values. Despite the ex-plicit dependence on surface tension to estimate effective interfacial mass transfer area, the largest areas are not related to lower surface tension. Thus, for the Bravo and Fair (1982) correlation, hydrody-namic factors overcome the influence on HETP of the surface tension.
Comparing the results shown in Tables 7 and 8, the high dependence of the Bravo and Fair (1982) correlation on the mass transfer coefficients can be noted. These results show that the Shulman et al.
(1955) equations provided higher mass transfer coef-ficients in order to compensate the small effective interfacial area, leading to better estimations for HETP values. Table 9 shows a comparison of all correla-tions studied.
Table 9: Comparison between the correlations stud-ied in this work.
Correlation Average predicted
HETP (cm)
RD (%)
Onda et al. (1968) 10.1 43.2
Bolles and Fair (1982) 15.0 36.5
Bravo and Fair (1982) - KV and KL obtained from Onda et al. (1968) equations
39.0 144.1
Bravo and Fair (1982) – KV and KL obtained from Shulman et al. (1955) equations
10.3 42.3
Ethanol Dehydration in Packed Distillation Column Using Glycerol as Entrainer: Experiments and HETP Evaluation 425
Brazilian Journal of Chemical Engineering Vol. 33, No. 02, pp. 415 - 426, April - June, 2016
the physical properties calculated for all systems, in accordance with Kister (1992). Table 9 also shows that the Bravo and Fair (1982) correlation using the Onda et al. (1968) equations overpredicted HETP values. The Onda et al. (1968) correlation and Bravo and Fair (1982) in conjunction with the Shulman et al. (1955) equations provided similar results, despite the smaller interfacial area obtained from the Bravo and Fair (1982) model. As pointed out previously, mass transfer coefficients were higher from the Shul-man et al. (1955) equation and the deviations for these two correlations are within the range of safety factors proposed by each work.
Caldas and Lacerda (1988) reported that the Bravo and Fair (1982) model provides better results than the Bolles and Fair (1982) correlation for distil-lation cases, because the latter was not developed especially for this purpose. However, this was not observed, since Bolles and Fair (1982) led to the lowest deviations obtained in this work.
The results obtained in this work showed that the Bolles and Fair (1982) correlation could be used for the scale-up procedure of small diameter packed col-umns, since a safety factor of 1.3 can be successfully applied for this model. Moreover, according to Eckert (1970), most of the designs for packed columns are made by using safety factors ranging from 10 to 35%.
CONCLUSIONS
The experimental results showed that glycerol is effective to dehydrate ethanol. Despite some limita-tions of the experimental unit, the azeotrope was not observed when S/F=0.9 was applied. It was observed that the products obtained are free of glycerol. Com-paring the correlations used for HETP estimation, the Bolles and Fair (1982) model provided the best re-sults. The Bravo and Fair (1982) correlation pro-duced moderate values for the interfacial area, while the equations proposed by Shulman et al. (1955) gave mass transfer coefficients higher than that ob-tained from the Onda et al. (1968) equations. The deviations are in the same range of the safety factor proposed by each author, except for the Bravo and Fair (1982) model with the Onda et al. (1968) equa-tions. The Bolles and Fair (1982) model is a good tool for the design of a packed bed for ethanol anhy-drous production. If the unit to be revamped allows the entrainer flow in the packed section, more studies have to be conducted in order to determine the glyc-erol effect on HETP estimation.
To obtain ethanol anhydrous without any modifi-cation of experimental apparatus, an alternative would
be to employ a series of columns similar to that used in this work. This proposal may be applied, for example, in a small distillery, since randomly packed columns are cheaper than plate ones.
NOMENCLATURE
ae Specific effective interfacial area
(cm2/cm3)
ap Specific area of packing (cm2/cm3)
aw Specific wetted interfacial area (cm2/cm3)
CaL Capillary number for the liquid
CfL Coefficient for effect of approach of flood
point on liquid phase mass transfer
dp Diameter (or nominal size) of packing
(cm)
D Diffusion coefficients (cm2/s)
1
f Correction factor viscosity 2
f Correction factor specific mass
3
f Correction factor surface tension
Fr Froude number
g Acceleration of gravity (cm/s2)
gc force/mass conversion factor (g.cm/N.s
2 )
G Superficial mass velocity (g/cm2.s) HETP Height Equivalent to Theoretical Plate
(cm)
HOV Height of a global mass transfer transfer
unit (cm)
H Height of a transfer unit (cm)
kL Mass transfer coefficient of the liquid
phase (cm/s)
kv Mass transfer coefficient of the vapor
phase (gmol/atm.cm2.s)
M Molecular weight of the vapor (g/gmol)
N Number of theoretical plates (stages)
P Absolute pressure (atm)
R Universal gas constant (atm.cm3/gmol.K)
Re Reynolds number
Sc Schmidt number
T Temperature (K)
We Weber number
Z Height of the packed bed (cm)
Greek Symbols
ε Fraction void in packing
Ratio of slopes of equilibrium to operation lines
Viscosity (g/cm.s) ρ Specific mass (g/cm3)
ρVM Molar specific mass of the vapor
Brazilian Journal of Chemical Engineering
σ Surface tension (dyn/cm or g/cm2) σc Critical surface tension (dyn/cm)
Packing parameter for liquid phase mass transfer
ψ Packing parameter for vapor phase mass transfer
Subscripts
L Liquid
V Vapor
w Water
REFERENCES
Bolles, W. L., Fair, J. R., Improved mass-transfer model enhances packed column design. Chemical Engineering, 89(14), p. 109-116 (1982).
Bravo, J. L., Fair, J. R., Generalized correlation for mass transfer in packed distillation. Industrial & Engineering Chemistry Process Design and De-velopment, 21(1), p. 162-170 (1982).
Caldas, J. N., Lacerda, A. I., Torres Recheadas. JR Editora Técnica Ltda., Rio de Janeiro (1988). (In Portuguese).
Cornell, D., Knapp, W. G., Fair, J. R., Mass transfer efficiency packed columns part 1. Chemical Engi-neering Progress, 56(7), p. 68-74 (1960).
DECHEMA, Vapor-Liquid Equilibrium Data Collec-tion, Aqueous-Organic Systems (Supplement 1), v. I, Part 1a. Gmehling, V. J., Onken, U., Arlt, W. Frankfurt/M. (1981).
Eckert, J. S., Selecting the proper distillation column packing. Chemical Engineering Progress, 66(3), p. 39-44 (1970).
Furter, W. F., Extractive distillation by salt effect. Extractive and azeotropic distillation. Advances in Chemistry Series, 115, American Chemical So-ciety, Washington, DC (1974).
Gil, I. D., Uyazán, A. M., Aguilar, J. L., Rodríguez, G., Caicedo, L. A., Separation of ethanol and water
by extractive distillation with salt and solvent as entrainer: Process simulation. Brazilian Journal of Chemical Engineering, 25(1), p. 207-215 (2008). Henley, E. J., Seader, J. D., Equilibrium-Stage
Sepa-ration OpeSepa-rations in Chemical Engineering. John Wiley & Sons, New York (1981).
Kister, H. Z. Distillation design, McGraw-Hill, New York (1992).
Lee, F. M., Pahl, R. H., Solvent screening study and conceptual extractive distillation process to pro-duce anhydrous ethanol from fermentation broth. Ind. Eng. Chem. Process Des. Dev., 24, p. 168-172 (1985).
Onda, K., Takeuchi, H., Okumoto, Y., Mass transfer coefficients between gas and liquid phases in packed columns. Journal of Chemical Engineer-ing of Japan, 1(1), p. 56-62 (1968).
Perry, R. H., Chilton, C. H., Manual de Engenharia Química. 2ª Ed., Editora Guanabara Dois S.A. Rio de Janeiro (1980). (In Portuguese).
Prausnitz, J. M., Lichtenthaler, R. N., Azevedo, E. G., Termodinámica molecular de los equilibrios de fases. 3ª Ed., Prentice Hall Iberia, Madrid (2000). (In Spanish).
Ravagnani, M. A. S. S., Reis, M. H. M., Filho, R. M., Wolf-Maciel, M. R., Anhydrous ethanol pro-duction by extractive distillation: A solvent case study. Process Safety and Environmental Protec-tion, 88, p. 67-73 (2010).
Reid, R. C., Prausnitz, J. M., Poling, B. E., The Prop-erties of Gases and Liquids. 4th Ed., McGraw-Hill, Inc., New York (1987).
Shulman, H. J., Ullrich, C. F., Proulx, A. Z., Zim-merman, J. O., Performance of packed columns. II. Wetted and effective-interfacial areas, gas-and liquid phase mass transfer rates. AIChE Journal, 1(2), p. 253-258 (1955).