ISSN 0104-6632 Printed in Brazil
www.abeq.org.br/bjche
Vol. 33, No. 02, pp. 401 - 414, April - June, 2016 dx.doi.org/10.1590/0104-6632.20160332s00003479
*To whom correspondence should be addressed
Brazilian Journal
of Chemical
Engineering
EVALUATION OF BIOMASS AND COAL
CO
–
GASIFICATION OF BRAZILIAN
FEEDSTOCK USING A CHEMICAL
EQUILIBRIUM MODEL
R. Rodrigues
1*, A. R. Muniz
2and N. R. Marcilio
21
Course of Chemical Engineering, Federal University of Pampa (UNIPAMPA), Bagé Campus, Avenida Maria Anunciação Gomes de Godoy, 1650, 96413-170, Bagé - RS, Brazil.
Phone: +55 53 3242 9931 E-mail: [email protected]
Website: http://cursos.unipampa.edu.br/cursos/engenhariaquimica
2
Department of Chemical Engineering, Federal University of Rio Grande do Sul (UFRGS), Central Campus, Rua Eng. Luis Englert, s/n, 90040-040, Porto Alegre - RS, Brazil.
Phone: + 55 51 3308 3956
E-mail: [email protected]; [email protected] Website: http://www.enq.ufrgs.br
(Submitted: May 2, 2014 ; Revised: May 19, 2015 ; Accepted: May 19, 2015)
Abstract - Coal and biomass are energy sources with great potential for use in Brazil. Coal-biomass co-gasification enables the combination of the positive characteristics of each fuel, besides leading to a cleaner use of coal. The present study evaluates the potential of co-gasification of binary coal-biomass blends using sources widely available in Brazil. This analysis employs computational simulations using a reliable thermodynamic equilibrium model. Favorable operational conditions at high temperatures are determined in order to obtain gaseous products suitable for energy cogeneration and chemical synthesis. This study shows that blends with biomass ratios of 5% and equivalence ratios ≤ 0.3 lead to high cold gas efficiencies. Suitable gaseous products for chemical synthesis were identified at biomass ratios ≤ 35% and moisture contents ≥ 40%. Formation of undesirable nitrogen and sulfur compounds was also analyzed.
Keywords: Coal and biomass energy; Co-gasification; Equilibrium modeling.
INTRODUCTION
Biomass has been used as an energy source since ancient times. It is a renewable resource, available in many forms throughout the world. According to Parikka (2004), the worldwide potential of energy from biomass is of about 103.8 EJ (EJ = 1018 J) per year, equivalent to about 5.9 trillion tons of biomass generated annually. In Brazil, the potential of this re-source in the national energy matrix recently reached 0.125 EJ, according to a technical report of the
402 R. Rodrigues, A. R. Muniz and N. R. Marcilio
Brazilian Journal of Chemical Engineering
Brazil has coal reserves of about 4.6 billion tons (EIA, 2008), corresponding to 1.4% of the national energy matrix (EPE, 2012).
The coal reserves in Brazil are concentrated pre-dominantly in the Southern region of the country, 89.25% of them being found in the state of Rio Grande do Sul (ANEEL, 2008). This coal is pre-dominantly sub-bituminous and has high ash content. Biomass sources are found in all regions of Brazil; however, their use in cogeneration brings technical difficulties related to the seasonal availability of certain types of biomass, their typical high moisture content and low heating value. A technical report of the National Agency of Electrical Energy (ANEEL, 2012) listed eight biomass sources suitable for ther-moelectric generation: sugarcane bagasse, black liquor (from cellulose industries), wood residues, biogas, elephant grass, charcoal, rice husk and palm kernel oil. A study by the Brazilian Reference Center on Biomass (Coelho et al., 2012) also evaluated the po-tential of biomass as an energy source in Brazil. This study took into account aspects of geographical dis-tribution and suggested the use of the following sources: sugarcane bagasse, forest residues, agricul-tural residues, palm oil and biogas from various re-newable sources.
Gasification is a technology that allows an effi-cient utilization of coal and biomass as energy sources. It consists of the thermochemical conver-sion of carbonaceous materials at high temperatures in the presence of a gasifying agent, usually air and/or steam. The final products are essentially a gaseous mixture with higher heating value known as “syngas” and solid byproducts. The co-processing of coal-bio-mass blends is called co-gasification.
Co-gasification of coal-biomass blends has been increasingly studied because it leads to a cleaner use of coal. The co-processing of coal-biomass blends can be carried out such that undesirable characteris-tics of one fuel can be compensated by desirable ones brought by the other. Some authors (Sjöström et al., 1999; Hernández et al., 2010; Xu et al., 2011; Song et al., 2013) have observed synergies using some combinations of these fuels. However, other authors (Collot et al., 1999; Zhu et al., 2008) reported the lack of interactions among fuels. Zhou (2014) pre-sented a review of synergy effects during co-gasi-fication in several experimental studies.
Brar et al. (2012) and Emami-Taba et al. (2013) presented a comprehensive review of recent progress in coal-biomass co-gasification technologies. Differ-ent types of chemical reactors are used in co-gasi-fication such as entrained-flow, fixed-bed and fluid-ized-bed gasifiers. According to Emami-Taba et al.
(2013), fluidized-bed gasifiers are the most used ones. Brar et al. (2012) pointed out that the operating temperature of gasifiers ranges from 850 to 1000 ºC, with a maximum temperature limit established to avoid ash sintering. The authors also observed that gasifiers operate from atmospheric pressure up to 20 bar. Emami-Taba et al. (2013) found that the increase of biomass ratio in the blends favors the formation of CO2, CO, and hydrocarbons due to the increase in the carbon conversion, resulting in higher biomass reac-tivity. Concomitantly, H2 production is disfavored by the increase of the biomass ratio in the blends, due to the greater oxygen content present in biomass. The authors also concluded that the increase of biomass ratio increases the cold gas efficiency.
The investigation of favorable combinations of coal and biomass for co-gasification (from both tech-nical and economic points of view) is the first step towards the design of efficient energy cogeneration and chemical synthesis processes. Experimental analysis would be costly and time-demanding, be-cause of the great number of possible coal-biomass combinations and corresponding relative propor-tions. The use of theoretical analysis, employing reliable computational simulations, is an alternative and attractive approach for a preliminary screening of the best options.
Evaluation of Biomass and Coal Co–Gasification of Brazilian Feedstock Using a Chemical Equilibrium Model 403
Brazilian Journal of Chemical Engineering Vol. 33, No. 02, pp. 401 - 414, April - June, 2016 THERMODYNAMIC EQUILIBRIUM
MODELING
There are two types of phenomenological models for gasification systems, based on either a kinetic ap-proach or an equilibrium apap-proach (Li et al., 2001). Kinetic models are able to predict the behavior of gasification systems in more details; however, they require the knowledge of kinetic parameters (ranging from a few to thousands), which are typically obtained experimentally. On the other hand, equilibrium mod-els require a reduced amount of information; however, they are only valid under chemical equilibrium con-ditions. Equilibrium models are valuable because they can predict the thermodynamic limits of a gasi-fication system (Prins et al., 2007). This approach is independent of the gasifier type, being suitable to study the influence of operating parameters on the gaseous product composition of the process (Puig-Arnavat et al., 2010). According to Puig-Arnavat et al. (2010), the largest discrepancies between predic-tions of equilibrium models and the corresponding values from actual gasification systems are found under low gasification temperatures. As a result, CO and H2 contents are typically overestimated and CO2, CH4, tar and char contents are underestimated.
There are few references in the literature for kinetic models of co-gasification processes (Usón et al., 2004; Chen and Hung, 2013; Mtui, 2013; Xu, 2013). According to Villanueva et al. (2008), the use of an equilibrium model is a good approach for en-trained-flow gasifiers; for downdraft fixed-bed gasi-fiers this approach is only valid for high tempera-tures and large residence times in the reduction zone. However, the authors recommend the use of adapted equilibrium models for updraft fixed-bed and fluid-ized-bed gasifiers. For a preliminary evaluation of the potential application of different biomass sources in co-gasification, as proposed in this work, an equi-librium approach is appropriate.
The model employed uses an equilibrium approach with a non-stoichiometric formulation (Baratieri et al., 2008; Rodrigues et al., 2010). This formulation calculates the product composition by performing the total Gibbs free energy minimization of an ideal multi-phase mixture. This equilibrium model allows calculating an equilibrium state with a large number of phases and chemical species. A list of expected species in the product must be established a priori. Thus, a large solution space must be used, comprising even rarely detected species (Baratieri et al., 2008).
The main assumptions of the model are the fol-lowing:
1. The feed stream (fuel and gasifying agent) consists of a combination of C, H, O, N, S, Cl, Ar, Si, Ca, Al, Fe, Na, K, Mg, P, and Ti atoms;
2. A multi-phase formulation consists of a two-phase mixture: gas- and solid-two-phase;
3. The fraction of non-converted solid carbon (char) is represented by graphitic carbon;
4. The process takes place in a perfectly mixed reactor in the steady-state at fixed pressure and tem-perature.
5. The gasification reaction rates are fast enough and residence time is sufficiently long to reach the equilibrium state.
The first and second assumptions are taken into account by choosing a list of expected chemical spe-cies from the NASA thermodynamic database (Gordon and McBride, 1971; Gordon et al., 1993). As a result, the solid-phase consists of 163 species and the gas-phase consists of 205 species. However, if only the products with concentrations higher than 1 ppm in the equilibrium state are considered relevant, the model is simplified to a solid-phase consisting of solid car-bon and 47 chemical species and a gas-phase consist-ing of 38 chemical species. The chemical species considered in the model are listed in Table 1. The model was implemented using the Cantera package (Goodwin et al., 2013). Cantera is an open-source library of object-oriented functions for solving prob-lems in different areas such as chemical kinetics, ther-modynamics and transport processes. The Cantera library has been successfully used in the simulation of coal and biomass thermochemical conversion problems (Baratieri et al., 2008; Baggio et al., 2009; Caton et al., 2010; Messig et al., 2010).
The model was validated using experimental data for co-gasification processes from the literature and was compared with predicted values of an equilib-rium model from the literature before carrying out the proposed study. A set of recent data for three ex-perimental systems was chosen for model validation since they present detailed information regarding feedstock and product composition under typical op-erating conditions, and distinct gasifier configura-tions. More specifically, these systems involve coal-biomass co-gasification in entrained-flow (Hernández
40
M
an n fo p
d
w an
04
Phase Gas
Solid
RE
Model Valida
Figure 1 s nd experime ández et al., or temperatu heric pressur
deviation (%)
where N is th nd xi,exp are t
Group Carbon Oxyge Hydrog Nitrog Sulfur Chlorin Phosph Other c Carbon Alumin Calciu Iron co Potassi Magne Sodium Silicon Titaniu
ESULTS AND
ation
shows the de ental values f
2010; Li et a
ures from 10 re. This para
1
1 )
i N
N
he number othe estimate
Figure 1: D 2010; Song 1000 to 115
Table 1: Li
p
n compounds en compounds
gen compounds en compounds compounds ne compounds horus compoun
compound n
nium compoun m compounds ompounds
ium compound esium compoun m compounds n compounds um compounds
D DISCUSS
eviation betw from differen
al., 2010; So 000 to 1150 ameter is defi
, ,
,
i exp i est
i exp
x x
x
f chemical s d and measu
Deviations b g et al., 2013
50 ºC. Feed s
R. Rodrigues, A
Brazilian Jou st of chemic
s
nds
ds
s nds
SION
ween estima nt sources (H ong et al., 20
ºC and atm ined as:
100%
species and x
ured volumet
between expe 3) and value stream comp
A. R. Muniz and N
urnal of Chemica cal species co
C C O H N S, C P2
A C A C Fe K M N Si Ti
ated
Her-13)
mos-(1)
xi,est
tric
fra tio ter (H wh exp sm via usi thi po for ran Th lib
al.
erimental dat es predicted b positions are
N. R. Marcilio
al Engineering onsidered in
hemical specie (g), CH4, CO,
, O2
H, H2, OH, H2O
N, N2, NH3, NO
, S2, SH, SO, S
l, Cl2, HCl, Cl 2, PH3, PO, PO
Ar (s)
Al2O3, AlN, AlC
a, CaO, CaO2H
e, FeO, Fe2O3,
K, K2O, KCN, K
MgO, MgS, Mg Na2O, Na2CO3,
i, SiC, SiO2, S
iC, TiO2, Ti2O
actions of spe on of fuel a
rms of oxyge H/C) ratios. T
hen the devi perimental v maller than 35
ations of up ing an adap is criterion, sed model w r temperatur nge of O/C he larger dev brium were o (2010) due
ta (Hernánde by the mode represented
n the model.
es CO2
O O, HCN
SO2, SO3, H2S
lO, SCl2
O2, P2O5, P3O6
Cl3, Al2SiO5, A
H2, CaS, CaSO
, Fe3O4, FeS, F
K2CO3, K2S, K
gSO4,MgCl2, M
NaCN, Na2SO
Si3N4, Si2N2O
O3, TiN, TiCl3
ecies i respec and gasifying en/carbon (O The model w
iation betwe values as cal 5%; Esmaili p to 40% ap pted equilibr
our calculati was conside res from 100
and H/C va viations (> 4 observed for
to the short
ez et al., 201 el for temper by H/C and
.
S, COS, CS2
6, P4O10, PCl3
Al6Si2O13
O4, CaCl2
FeCl2
K2SO4, KCl
MgAl2O4, MgS
O4, NaCl, NaA
ctively. The t g agent are O/C) and hy was considere
en model pr culated by e
et al. (2013 ppropriate fo
ium model. ions showed red satisfact 00 to 1150 º alues, as seen
40%) from c r the data of residence tim
10; Li et al., ratures from O/C ratios.
SiO3, Mg2SiO4
AlO2
total compos expressed drogen/carbo ed satisfacto redictions an equation 1 w 3) consider d for prediction
According d that the pr
torily accura ºC and a wid
n in Figure chemical equ f Hernández
me (~1.4 s) 4
si-in on ry nd was
de-ns to ro-ate
de 1.
ui-et
th iz a w ou th ti re (L 3 m co al 1 p m ri sp (1 re li O 1 F L F co a S d d p o ca an ap he entrained zed-bed gasif
l. (2013) stu was observed us products he larger vola imes larger t eactivity. Th Li et al., 201 5%. It shoul ments at tem onsidered he lso expected 150 ºC (as ex The results ared to pred model of Li e
ium compos pecies at 1.0 1000 K and esults repres ignocellulosi O, 0.51% N, 0
5% moisture Figure 2 can Li et al. (2004
Figure 2: Co onverted car
l., 2004) at olid lines (— ashed lines (
The overal icted by th resented in L f the results arbon C(s) nce of non ppearance o
Evaluation of Bi
Brazi
d-flow gasifi fiers in the L udies. For sam
d that higher closer to ch atile matter c than coal) th he deviations
10; Song et a
ld be empha mperatures hi ere, the prop
to be valid f xpected for a
s of the prop dictions of th
et al. (2004). ition for a p 013 bar and a 1100 K), in sent the gasi
ic biomass o 0.34% S (%w e (%wt, wb)
be compare 4).
omposition o rbon for rep 1.013 bar in —) represen (---) represen
ll trend of th he proposed
Li et al. (20 s are obtaine
contents. Pr n-converted of gaseous sp
iomass and Coal
ilian Journal of C
ier compared Li et al. (201 me set of He r BR blends hemical equi content of th hat increases s for the rem
al., 2013) we sized that, a gher than 12 posed equilib for temperatu any equilibriu posed model he multi-pha
Figure 2 sho proposed mo at two distin the range 0 fication of a f 50.9% C, 6 wt, daf), 1.1% ), and 20.6 M
d to Figure
of major gas presentative n the range o nt products a nt products at
he product co model is 04). The hig ed for non-c rovided that carbon C(s) pecies, some
Co–Gasification
Chemical Enginee
d to the flu 10) and Song rnández’ dat produced ga ilibrium due e biomass (f s the feedsto maining stud ere smaller th
lthough expe 200 ºC are brium mode ures higher th um model).
were also co ase equilibri ows the equil odel of 7 ma nct temperatu < ER < 1. T a representat
6.6% H, 40. % ash (%wt, d
MJ/kg of HH
13 obtained
seous and n biomass (Li of 0 ≤ ER ≤
at 1000 K a t 1100 K.
omposition p similar to t ghest deviatio
converted so the disappe ) leads to e deviations
of Brazilian Feed
ering Vol. 33, No
uid-g et
ta it ase-e to four ock dies han eri-not l is han om-ium lib-ajor ures The tive 5% db), HV. by on-i et
≤ 1.
and pre-that ons olid ear-the s of car rea att ash fue sum spe spe Se sim ord siti mo (ER def CG ER wh rea me hea (co con 10 Fig equ tio of lib tow col of wh cre In is 1.9 rem con ob con par
dstock Using a Ch
o. 02, pp. 401 - 4
rbon-based g ason of the d tributed to th
h content to b els with low mes the ash c ecies are al ecies.
ensitivity An
Before start mulations for
der to evalua ion and cold odel with res
R) and mois fined as: (1 LHV GE MC 2 2, O O stoic n R n
here nO2 is t actor,
2,
O sto n
etric O2, MC i ating value, oal or coal-bio
The compo nverted carb 00 ºC, 1 atm gure 3. Thes uivalence rat on. This effec O atoms in t bria in the o
wards CO2 a ld gas efficie approximat here the C(s eased due to those condit 69.6% SiO2, 9% CaCl2, 1. maining spec Figure 4 sh nverted solid tained for 0 nstant the s rameters use
hemical Equilibri
414, April - June,
gaseous spec deviations o he fact that L be inert, sinc w ash conten content to be llowed to in
nalysis of the
ing the analy r coal gasifi ate the sensiti d gas efficien spect to temp sture content ) syngas fuel V Y C LHV
the number o
ic is the num
is the moistur
Y is the syn omass blends osition of ga bon resulting m, 10% MC a se results sho tio increases ct is observe the system di oxidation of and H2O. As ency (CGE) ely 87.5% a s), CO, H2 a the increase tions the com , 8.3% FeS, 9% KCl, 1.3 cies in minor hows the ga d carbon co
≤ MC ≤ 50
same values ed in the prev
ium Model
2016
cies are also f C(s) predic i et al. (2004 ce the author nt. The prese e part of syst nteract with
e Model
ysis of coal-b cation were ivity of the s ncy (CGE) pr perature, equ t (MC). CGE
100%
of moles of O mber of mol re content, LH
ngas yield an s) is assumed aseous produ g from coal and 0 ≤ER ≤
ow that the i N2, CO2 and d because a isplaces the c f C(s), CH4 s a result, th reaches a m at ER = 0.09 and CH4 am
of CO2 and mposition of t 7% Al2O3, 3% MgSiO3,
concentratio aseous produ omposition o 0% and ER =
s for the ot vious analysi
4
observed. Th ctions may b 4) assumed th rs studied on
ent model a tem, so the a carbon-base
iomass blend carried out syngas comp redicted by th uivalence rat
GE and ER a
(2
(3
O2 injected in les of stoichi
HV is the low nd 1 kg of fu d as the basis.
ucts and no gasification
≤ 1 is shown increase of th
d H2O produ larger amou chemical equ , CO and H he variation maximum valu
9 at the poi mounts are d H2O amount the ash conte 6.7% Al2SiO 0.9% CaS an ons.
ucts and no on a dry bas
= 0.1, keepin ther operatin is. In this cas
40
it tu h fo af al sh fa
F
co g
≤
F
co 1
T si
06
t is possible t ure content
owever, C(s orming reac fter MC ≈ 1 lso observed hift reaction avors CO2 an
Figure 3: Com onverted car asification a
≤ER≤ 1.
Figure 4: Com onverted carb 000 °C in th
Table 2: List idered for se
Equilibriu
CH4 + H2O
CH4 + CO2
CO + H2O ↔
C(s) + H2O
C(s) + 2H2O
to observe th leads to H2, s) and CH4 i ctions (R1–R
5%. A progr d due to the o (R3 in Table nd H2 produc
mposition of rbon and co at 10% MC a
mposition of bon for coal e range 0 ≤M
of chemical ensitivity ana
um reaction
↔ CO + 3H2 ↔ 2CO + 2H2 ↔ CO2 + H2
↔ CO + H2
O ↔ CO2 + 2H2
hat an increa , CO and C is consumed R4 in Table ressive CO occurrence o e 2) after MC
ction.
f gaseous pro old gas effic and 1000 ºC
f gaseous pro gasification
MC≤ 50%.
equilibrium alysis of the
ΔHr (MJ/k
+ 206.0
+ 247.4
– 41.0 + 131.4
2 + 90.1
R. Rodrigues, A
Brazilian Jou
ase of the mo CH4 producti
d due to the e 2), vanish
consumption of the
water-C ≈ 10%, wh
oducts and n ciency for c C in the rang
oducts and n at ER = 0.1 a
m reactions c model.
kmol) Equatio
0 (R1) 4 (R2) 0 (R3) 4 (R4) 1 (R5)
A. R. Muniz and N
urnal of Chemica
ois-ion;
re-hing
n is gas hich
on-coal ge 0
on-and
on-on
con tur for ou tem ga rea H2
Fig
con and
agr sim Sh
An
ma ma saw and lid Th bio Ta
adv ga cha app de stu con
N. R. Marcilio
al Engineering
The compo nverted carb res from 700 r the other o us analyses, a
mperature pr s reactions actions (R1– 2O and CO2 c
gure 5: Com nverted carb d ER = 0.1 in
The results reement with milar gasific habbar and Ja
nalysis of Co
The analys ass blends e asses (rice h wmill wood
d sugarcane dity range of he proximate
omass source able 3. The as
The co-proc vantageous w sification are aracteristics propriate bio sirable chara udy are the h ntents, and l
ositions of g bon achieved 0 to 1200 ºC operating par are shown in romotes endo
(R4–R5 in –R2 in Table
conversion to
mposition of g bon for coal
n the range 7
s presented h results pre
ation proces anajreh, 2013
oal-Biomass
is of the co employing s husk, coconu wastes, cha straw) was the proposed e and ultima es available sh compositi
cessing of co when undesir
e eliminated of biomass omass ratio ( acteristics of high ash (42 low carbon c
aseous prod d at ER = 0.1 C, keeping th rameters used n Figure 5. T
othermic rea Table 2) a 2), which fav o CO and H2
gaseous prod l gasification 700 ≤T≤ 12
in this se sented in the sses (Esmaili 3).
s Co-Gasific
o-gasification seven types ut residues, e
arcoal, suga carried out d model estab ate analyses
in Brazil ar on is given i oal-biomass rable charact or minimize gasification (BR) in the b f the coal con 2.71%) and s content (33.3
ducts and no 1 and temper he same valu d in the prev The increase
actions: wate and reformin
vor C(s), CH 2.
ducts and no n at 10% M
00 ºC.
ection are e literature f i et al., 201
ation
n of coal-bi of solid bi elephant gras
rcane bagas within the v blished abov for coal an e presented in Table 4.
blends can b eristics of co ed by desirab n, by using a
blend. The u nsidered in th
sulfur (2.15% 39%). The u
n- ra-ues
vi-of er-ng H4,
n-MC
in for 3;
o-ss,
se va-ve.
nd in
be oal ble an
Evaluation of Biomass and Coal Co–Gasification of Brazilian Feedstock Using a Chemical Equilibrium Model 407
Brazilian Journal of Chemical Engineering Vol. 33, No. 02, pp. 401 - 414, April - June, 2016 Table 3: Characterization of the fuels considered in this study.
Coal1 Rice husk2 Coconut residue3
Sawmill wood waste4
Charcoal5 Sugarcane bagasse6
Sugarcane straw6
Elephant grass7 Proximate analysis (%wt, db)
Moisture (wb 11.06 12.00 83.74 11.78 7.14 50.20 2940 9.97
Volatile matter 20.29 67.80 10.20 86.44 N/A 79.90 83.30 68.93
Fixed carbon 25.09 13.60 79.70 13.22 N/A 18.00 12.80 7.95
Ash 42.71 18.60 10.30 0.35 2.43 2.20 3.90 12.84
Ultimate analysis (%wt, daf)
C 33.39 38.30 48.23 51.46 65.19 44.60 46.20 46.52
H 3.47 4.00 5.23 6.10 5.55 5.80 6.20 5.87
N 0.61 0.50 2.98 0.26 0.83 0.60 0.50 1.47
O 16.68 38.60 33.19 41.85 25.65 44.50 43.00 46.04
S 2.15 0.08* 0.12 0.01* 0.37 0.10 0.10 0.10
Cl 0.013 0.12* N/A 0.01* N/A 0.02 0.10 0.21*
HHV (MJ/kg, b) 13.39 15.49 22.81 20.25 25.28 18.10 17.40 16.94
wt = weight, db = dry basis, wb = wet basis, daf = dry ash free basis, N/A = not available.
1
Kalkreuth et al. (2006), 2
CIENTEC (1986) apud Hoffmann (1999), 3
Andrade et al. (2004) and Nogueira et al. (2000) apud Andrade et al. (2004), 4
Wander et al. (2004), 5
Fuwape (1993), 6
Linero and Lamônica (2005) apud Seabra et al. (2010), 7
Broetto et al. (2012)
*
Mean value from Vassilev et al. (2010).
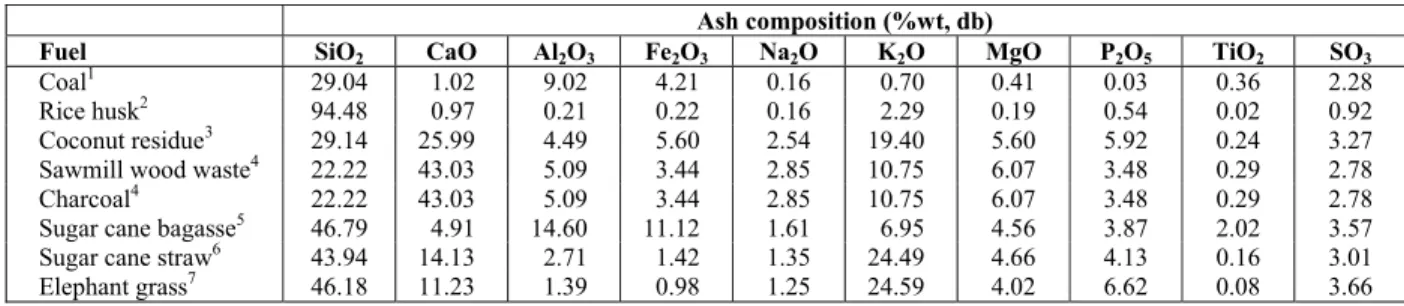
Table 4: Ash composition of the fuels considered in this study.
Ash composition (%wt, db)
Fuel SiO2 CaO Al2O3 Fe2O3 Na2O K2O MgO P2O5 TiO2 SO3
Coal1 29.04 1.02 9.02 4.21 0.16 0.70 0.41 0.03 0.36 2.28
Rice husk2 94.48 0.97 0.21 0.22 0.16 2.29 0.19 0.54 0.02 0.92
Coconut residue3 29.14 25.99 4.49 5.60 2.54 19.40 5.60 5.92 0.24 3.27
Sawmill wood waste4 22.22 43.03 5.09 3.44 2.85 10.75 6.07 3.48 0.29 2.78
Charcoal4 22.22 43.03 5.09 3.44 2.85 10.75 6.07 3.48 0.29 2.78
Sugar cane bagasse5 46.79 4.91 14.60 11.12 1.61 6.95 4.56 3.87 2.02 3.57
Sugar cane straw6 43.94 14.13 2.71 1.42 1.35 24.49 4.66 4.13 0.16 3.01
Elephant grass7 46.18 11.23 1.39 0.98 1.25 24.59 4.02 6.62 0.08 3.66
wt = weight, db = dry basis.
1
Kalkreuth et al. (2006), 2
Mean value from five sources (Vassilev et al., 2010), 3
Mean value for natural biomass (Vassilev et al., 2010), 4
Mean value for woody biomass (Vassilev et al., 2010), 5
Mean value from two sources (Vassilev et al., 2010), 6
Mean value for straws (Vassilev et al., 2010), 7
Mean value for grasses (Vassilev et al., 2010).
of a coal-biomass blend can properly raise or reduce these contents; also, the high oxygen content in bio-mass (25.65 to 46.04%) can favor gasification reac-tions without injecting additional oxygen into the gasifier. Some biomasses also have lower nitrogen content (0.26 to 0.5%) compared to coal (0.61%), which decreases the production of nitrogen-contain-ing compounds (NH3), minimiznitrogen-contain-ing the environmen-tal impact caused by the emissions.
Gas Composition and Carbon Conversion
The composition of the gaseous products from gasification of pure coal and different types of bio-masses (each one in pure form) were computed for 1000 ºC, 0% MC, ER = 0.4 and 0 ≤BR ≤ 100%. The results are summarized in Table 5. Then, the product composition resulting from coal-biomass co-gasifica-tion under different biomass ratios was calculated using the same set of parameters (1000 ºC, 0% MC
and ER = 0.4). Results for wood waste are shown in Figure 6. We observed that the product composition estimated for gasification of a coal-biomass blend is practically identical to the mass average of the values estimated for gasification of each individual fuel; deviations were smaller than 1.5%, which can be attributed to numerical errors in calculations. In other words, the product composition varied linearly with
40 F co at ra se p fo A th in g fe p eo b co ca sp ou 1 0 in co 08 T
High ash coa Rice husk Coconut resid Wood waste Charcoal Cane bagasse Cane straw Elephant gras
vol = volume,
Figure 6: Com onverted car t ER = 0.4 an For every ameters spec erved that t roduction du or a given ER
An increase o he blends. CH ncrease of B
rass blends. eature: the i roduction; co ous products lends compa onditions us arbon conve ponding to a us products.
The main r 000 ºC, 1 atm .4 and 0.6, a n Table 6. T
onversion of
Table 5: Resu
H2 al 10.6 12.2 due 13.8 14.6 13.3 e 14.5 14.9 ss 13.7
wb = wet basis, d
mposition of rbon for dry nd 1000 ºC in
coal-bioma cified in the p the increase
ue to the hig
R (i.e., total O of BR increa H4 productio
BR, except f Charcoal ble increase of B
onsequently, s with highe ared to other sed in these ersion (CC) a full convers
results for co m pressure, a and MC = 0, The increase f H2, CO an
ults for dry c
Gas co CO CH4
(ppm) 21.5 0.77 23.1 0.67 24.1 1.26 23.6 1.18 28.1 2.87 22.0 0.84 21.8 0.96 21.5 0.73
db = dry basis, H
f gaseous pro y coal-wood n the range 0 ss blend tes previous par of BR lead gher H cont O content rem
ases CO pro on usually inc for rice husk end exhibited
BR reduces , it is possibl er heating va rs. The temp
calculations for most of sion of solid
oal and wood and values o
10, 20 and 4 e of ER lea nd CH4 to H
R. Rodrigues, A
Brazilian Jou coal and bio
mposition (%v
)
CO2 H2
5.51 4.5 8.64 7.5 6.03 5.7 6.77 6.9 3.29 2.5 8.15 8.8 7.54 8.5 8.35 8.7 HHV = higher heat
oducts and n co-gasificat 0 ≤BR≤ 100 sted for the ragraph, we ds to larger
tent in biom mains consta oduction for
creases with k and eleph d an interest CO2 and H le to obtain g alue from th perature and led to a 10 f blends, cor
carbon to ga
d gasification f ER = 0.1, 0 40% are sho ads to a hig H2O and CO2
A. R. Muniz and N
urnal of Chemica omass gasific
vol, wb)
2O H2S
(ppm) 50 1690 55 86.8 70 31.2 91 0.0002 58 187 88 52.2 55 37 79 7.06
ting value, CC =
on-tion 0%. pa- ob-H2 mass nt). all the hant ting H2O gas-hese ER 0% rre- ase-n at 0.2, own gher 2 as exp on cre the hig low tha exc mo are Th for BR mo be all Ga sio inv fav Ta Nm Nm gen BR wh the ble for we 9.3 of po low can MJ
N. R. Marcilio
al Engineering cation at 10
Ga (Nm NH3 (ppm) 3.53 4.07 5.00 5.31 4.85 5.17 5.45 4.80 carbon conversio pected. The n H2 product
ease of MC r e H2/CO rat gher H2 over w equivalenc an 31.4% ar
cept for the oisture conte e obtained fo he H2/CO ra
r chemical sy
R≤ 25%, 45 ost of blends achieved us l blends.
as Yield, He
The gas yie on of solid ca
vestigated h vors gas yield aba et al., 20 m3 N2-free g m3/kg for ch
neral, the ga
R due to the h hich increase e increase of end, which in r gas product
The highes ere observed 37 MJ/kg as
the gaseous sition. Howe wer heating ne bagasse ( J/kg), for ex
00 ºC, 1 atm
as yield m3/kg, db)
H (MJ 0.66 0.96 1.34 1.44 1.76 1.27 1.32 1.12
on, CGE = cold g
moisture co tion for MC
reduces CH4 io is larger r CO conten ce ratio (ER
re achieved e charcoal b ents. CO co or 10% MC
atio equal to ynthesis) is
≤MC ≤ 50%
s. CH4 conten sing ER = 0.
ating Value
eld (Y) is dire arbon to gas ere showed d, as observe 013). The g gas per kg harcoal blend as yield incr
higher conte es the carbon fBR decrease ncreases the tion. st heating va d for charcoa shown in T product is d ever, the hig values. Thi (7.79 MJ/kg) xample. Thes
m and ER=0
HHV J/kg, db) C (% 4.31 99 6.26 99 9.12 10 9.37 10 13.7 10 7.79 10 8.03 10 6.84 10 gas efficiency.
ontent has l < 40%. How 4 production
than 1.0, w nt in gaseous
= 0.1), H2 c for 15% MC
blend that re ntents highe and 5% BR
2.0 (recom obtained for %, and 0.1 ≤ nts higher th 1, 0% MC a
and Cold G
ectly related seous produc that the in ed experimen gas yield can of coal, d.b ds as shown eases with th ent of H and
n conversion es the conten amount of s
alues of gas al, 13.7 MJ/k Table 5. The directly relat gher content is effect can ) and elepha se biomass .4. CC %) CGE (%) 9.8 44.0 9.9 53.4 00 55.9 00 66.1 00 75.9 00 60.7 00 66.8 00 56.5 ittle influen wever, the i . At 40% M
which indicat s products. A ontents high
C and 5% B
equires high er than 34.2 for all blend mended valu r values of 5
≤ER≤ 0.6 f han 0.03% ca and 5% BR f
Gas Efficienc
to the conve cts. The blend ncrease of B
ntally (Emam n exceed 0.6 b., up to 1.7 in Table 5. he increase O in biomas n. In additio nt of ash in th
solid availab
eous produc kg, and woo heating valu ted to its com t of ash led
n be seen f ant grass (6.8
Evaluation of Biomass and Coal Co–Gasification of Brazilian Feedstock Using a Chemical Equilibrium Model 409
Brazilian Journal of Chemical Engineering Vol. 33, No. 02, pp. 401 - 414, April - June, 2016 Table 6: Results for coal and wood gasification at 1000 ºC and 1 atm.
MC
(%wt)
ER Gas composition (%vol, wb) CC (%)
Gas yield (Nm3/kg, db)
HHV
(MJ/kg, db) CGE
(%) H2 CO CH4
(ppm)
CO2 H2O H2S
(ppm) NH3
(ppm) High ash coal 0 0.1
0.2 0.6 22.4 19.0 4.92 28.1 31.1 11.6 296 85.6 0.02 0.17 0.39 10.5 0.23 0.39 7.39 2920 2340 1320 8.33 7.34 1.21 69.6 90.4 100.0 0.59 0.68 0.59 3.76 4.85 2.85 50.2 58.4 24.9
10 0.2
0.4 0.6 22.8 12.3 5.89 27.7 16.9 9.16 10.1 0.45 0.02 3.39 7.83 11.3 4.63 9.43 12.1 2070 1570 1260 8.71 4.21 1.53 99.3 99.9 100.0 0.79 0.70 0.62 4.33 3.34 2.19 75.3 48.4 26.5
20 0.2
0.4 0.6 23.4 12.8 6.13 21.1 12.8 6.81 3.11 0.23 0.01 6.47 9.42 11.9 11.9 15.6 17.7 1830 1430 1170 8.46 4.27 1.56 99.8 100.0 100.0 0.82 0.71 0.61 3.32 2.51 1.59 82.9 51.5 26.7
40 0.2
0.4 0.6 20.5 10.9 4.42 10.8 6.26 2.74 0.41 0.03 0.001 9.41 10.6 11.7 29.5 30.7 31.2 1370 1130 95 6.17 3.07 0.88 100.0 100.0 100.0 0.78 0.65 0.53 1.74 1.21 0.62 95.4 52.7 20.8
Wood waste 0 0.1
0.2 0.6 33.2 27.6 7.23 38.7 39.4 13.3 1130 13.8 0.06 0.12 0.58 11.2 0.17 0.67 10.1 1.62×10⁻⁴ 1.42×10⁻⁴ 1.89×10⁻⁴ 12.6 11.2 2.04 81.7 100.0 100.0 1.46 1.63 1.27 9.82 11.9 6.54 90.5 100.0 38.8
10 0.2
0.4 0.6 28.2 15.2 7.59 34.8 21.0 11.8 22.6 0.86 0.05 2.88 7.97 11.7 3.86 9.51 12.4 1.94×10⁻⁴ 2.17×10⁻⁴ 2.26×10⁻⁴ 11.3 5.53 2.16 100.0 100.0 100.0 1.67 1.47 1.28 10.0 7.87 5.45 104.1 68.2 39.4
20 0.2
0.4 0.6 28.1 15.2 7.51 29.9 18.0 9.93 9.39 0.55 0.03 5.09 9.18 12.3 7.93 12.8 15.4 2.56×10⁻⁴ 2.68×10⁻⁴ 2.79×10⁻⁴ 11.0 5.46 2.10 100.0 100.0 100.0 1.67 1.45 1.26 8.24 6.39 4.31 105.4 67.5 37.6
40 0.2
0.4 0.6 25.7 13.4 5.73 19.7 11.3 5.35 1.98 0.14 0.005 8.77 11.2 13.2 19.0 21.9 23.4 4.12×10⁻⁴ 3.98×10⁻⁴ 3.84×10⁻⁴ 9.30 4.37 1.36 100.0 100.0 100.0 1.54 1.30 1.08 5.01 3.63 2.09 97.5 56.5 25.6
wt = weight, vol = volume, wb = wet basis, db = dry basis, HHV = higher heating value, CGE = cold gas efficiency.
similar gaseous products composition, but elephant grass has about 6 times higher ash content than cane bagasse. The cold gas efficiency (CGE) relates the heating value of the gaseous products with the heat-ing value of solid fuel. The coal gasification reached a CGE of 44.0% for the operating conditions studied here. The co-gasification of coal-biomass blends could attain a CGE of 75.9% by using charcoal blends.
The increase of ER led to the decrease of gas yield, heating value and cold gas efficiency, as shown in Table 6. Actually, higher gas yield could be ob-served at lower ER due to non-converted solid carbon. At higher ER, the remaining air amount de-creases the yield of useful gas (H2O and N2-free basis) as soon as solid carbon is converted to gaseous products. The same trend was observed with the in-crease of MC; however, the highest values of those parameters were observed at 10 ≤MC≤ 20%. These trends were also observed for the other blends. The coal-biomass co-gasification allows obtaining values of CGE higher than 80% with at least 5% BR, MC≥
5% and 0.1 ≤ER≤ 0.4 for most of cases.
Nitrogen and Sulfur Compounds
The evaluation of nitrogen and sulfur compound production (NH3 and H2S) is important when the
gaseous products are applied in chemical synthesis, fuel cells, and energy cogeneration. There are toler-ance limits for NH3 and H2S contents according to the application. According to Emami-Taba et al. (2013), NH3 and H2S contents must be smaller than 1 ppm (10-4 %vol) in chemical synthesis, and sulfur release must be close to zero in fuel cells. H2S con-tent should be smaller than 47 ppm and NH3 smaller than 65 ppm for use in energy cogeneration.
Table 5 shows that coal gasification generates gaseous products that meet the limits for NH3 con-tent (3.53 ppm) but not for H2S concon-tent (1690 ppm) in energy cogeneration. The appropriate H2S content can be achieved using blends of coconut residue (31.2 ppm), wood waste (0.2 ppb), sugarcane straw (37.0 ppm) or elephant grass (7.06 ppm). This hap-pens due to the lower content of S in such biomasses compared to coal. However, some types of biomasses with lower content of S have greater H2S production because of the type of ash composition that may sup-port H2S release.
The content of H2S in the products of dry coal-wood blends co-gasification at 1 atm is shown in Figures 7 and 8. Figure 7 shows the resulting content of H2S at ER = 0.4 for 75 ≤BR≤ 100% and tempera-tures of 900, 1000, 1100 and 1200 ºC. Moreover, Figure 8 shows the variation of H2S at 1000 °C for 0
41 in th E m ta v su p C u E v fo F ti 1 H F ca at fo 10
ncrease of BR
he gaseous p
ER also con mation. These
ally in the lit alue of ER
umption surp lained by the CaS) in ash c cts. The ent
ER = 1.0 due ariation of M
ormation.
Figure 7: H2S ion in the ran 200 °C at ER
H2S limit for
Figure 8: H2 ation in the t 1000 ºC. D or cogenerati
R led to the product. Low ntributed to
e trends have terature (Ema approximate passes its pro e conversion contents to g tire consump e to the oxid
MC revealed
S content for nge of 75 ≤
ER = 0.4. Da cogeneration
S contents fo ranges 0 ≤ E
Dashed line ( ion.
decrease of wer tempera the decreas e been observ
ami-Taba et
ely equal to oduction, wh n of solid-S (m
gaseous-S in ption of H2S dation of H2 d a minor inf
r dry coal-wo
BR≤ 100% shed line (--n.
for dry coal-w
ER ≤ 1 and 7 (---) indicate
R. Rodrigues, A
Brazilian Jou
f H2S content ature and lar se of H2S f ved experim
al., 2013). A 0.2, H2S c hich can be mainly FeS a n gaseous pr S takes place
2S to SO2. T fluence on H
ood co-gasifi and 900 ≤ T
--) indicates
wood co-gas 75 ≤BR≤ 9 es the H2S li
A. R. Muniz and N
urnal of Chemica
t in rger for- men-At a on- ex-and rod-e at The H2S ica-T≤ the sifi-5% mit wi ble nu lea BR Hi du of in val mo Su sis era pre lec eac res cog nar ble 80 ± 5 the H2 env als of be bio equ lim app and ate nu pri Ele and me ser can BR rat rat low ien con ele
N. R. Marcilio
al Engineering
The approp th at least 9 ends at ER = ut blends, the
ast 90% BR,
R of elephan gher values uction. There NH3 format Table 6. The lues for chem ost of the stu
ummary of R
This section s of coal-biom
ation and ch esents a sum ction of bina ch coal-biom sponding to
generation a rio (I) consid ends to reac % for cogen 5% for chem e same cond 2S and NH3
vironmental so shown for using coal-b The results used for co omass ratio a uivalence ra miting values
plied to cog d sugarcane e H2S and NH ut and sugarc
iate H2S and ephant grass d NH3 limiti ended H2S a rved for cha n also be suit
R ≤ 35% and tio did not h tio; however wer content nt for chemic
nut, wood, su ephant grass b
priate H2S co 95% BR for = 0.4 and 100 ese conditio
99% BR of nt grass also
of ER decrea e is an increa tion at highe e recommen mical synthe udied cases.
Results by E
n summarize mass co-gasi hemical syn mmary of gu
ary blends o mass blend, th the utilizatio and chemical ders the reco ch a cold g neration, and mical synthes ditions of sce
contents, i.e friendly sce r pure coal, t biomass blen show that al ogeneration p and moisture atio. The rec were not ob generation pu
bagasse blen H3 limiting v cane straw b d NH3 limiti s blends ach ing values fo and NH3 lim arcoal blends table for chem d higher mois have a signif r, higher val of H2 and C cal synthesis ugarcane bag blends achiev
ontents coul r co-gasifica 00 ºC. In the ns were ach sugarcane s
achieved th ase both H2S ase of H2S a er values of ded H2S and esis were no
Evaluation o
es the results ification for nthesis purpo
idelines to h of coal and here are two on of gaseou l synthesis p ommended bi as efficiency d H2/CO rati sis. Scenario
enario (I) an e., scenario enario. Both to demonstra ds instead of ll coal-bioma purposes for e content and commended bserved for p
urposes. Ric nds achieved alues for BR
blends achiev ing values fo ieved the ap or BR ≥ 55% miting values s. All coal-b mical synthes
sture content ficant effect lues of ER w
O that could s purposes. R gasse, sugarc ved the recom
d be achieve ation of woo e case of coc hieved with straw and 69 his condition S and NH3 pr
and a decrea
MC as show d NH3 limitin t observed f
f Scenarios
s of the anal energy coge oses. Table help in the s
biomass. F scenarios co us products f purposes. Sc iomass ratio y higher tha o equal to 2 (II) conside nd appropria (II) shows a h scenarios a
ate the benefi f pure coal.
ass blends ca any values d low values H2S and NH pure coal whe ce husk, woo d the appropr
≥ 95%. Coc ved the appr or BR ≥ 75% ppropriate H2 %. The recom
Evaluation of Biomass and Coal Co–Gasification of Brazilian Feedstock Using a Chemical Equilibrium Model 411
Brazilian Journal of Chemical Engineering Vol. 33, No. 02, pp. 401 - 414, April - June, 2016 Table 7: Guidelines for selection of binary coal-biomass blends.
Blend Scenario* Cogeneration purposes Chemical synthesis purposes BR (%) MC (%) ER BR (%) MC (%) ER
Coal (I) N/A 10–50 ≤ 0.25 N/A 40–50 —
(II) Not found N/A 50 ≥ 0.75
Coal-rice husk (I) — — ≤ 0.35 — 40–50 —
(II) ≥ 95 ≤ 5 ≤ 0.1 ≤ 20 50 ≥ 0.75
Coal-coconut (I) — — ≤ 0.4 ≤ 65 40–50 —
(II) ≥ 70 5–30 ≤ 0.3 ≤ 10 50 ≥ 0.75
Coal-wood (I) — — ≤ 0.3 ≤ 60 40–50 —
(II) ≥ 90 ≤ 25 ≤ 0.3 ≤ 10 50 ≥ 0.75
Coal-charcoal (I) — — ≤ 0.5 ≤ 35 40–50 —
(II) Not found ≤ 5 50 ≥ 0.75
Coal-cane bagasse (I) — — ≤ 0.4 ≤ 85 40–50 —
(II) ≥ 95 ≤ 10 ≤ 0.1 ≤ 10 50 ≥ 0.75
Coal-cane straw (I) — — ≤ 0.45 ≤ 90 40–50 —
(II) ≥ 75 ≤ 20 ≤ 0.3 ≤ 10 50 ≥ 0.75
Coal-elephant grass (I) — — ≤ 0.4 — 40–50 —
(II) ≥ 55 — ≤ 0.4 ≤ 15 50 ≥ 0.75
N/A = not applicable, —(dash) = any value.
*
Scenario (I) considers the recommended BR to reach CGE≥ 80% for cogeneration purposes and H2/CO = 2.0 ± 5% for
chemical synthesis purposes. Scenario (II) includes scenario (I) and appropriate H2S and NH3 contents.
and NH3 limiting values for BR ≤ 10%, ~50% MC, and equivalence ratio values higher than 0.75. Charcoal blends achieved the recommended H2S and NH3 lim-iting values for BR ≤ 5%.We can point out that higher moisture contents in the analysis may be assumed as a combination of moisture and steam amounts in the feed stream as long as the simulations do not include the initial state of H2O as liquid (moisture) or vapor (steam).
CONCLUSIONS
This study evaluated the potential of co-gasifica-tion of coal-biomass blends from sources available in Brazil for energy cogeneration and chemical synthe-sis purposes. A thermodynamic equilibrium model was employed, requiring a reduced amount of infor-mation. This model proved to be satisfactory, com-paring its predictions to experimental and simulated data available in the literature at high temperature (1000 ≤T≤ 1150 ºC). The study of the co-gasifica-tion potential of these blends identified the operating conditions (ER, MC and BR) required to achieve the optimal gaseous products in cogeneration and chemi-cal synthesis. Synergic effects were not observed in the predictions of the equilibrium model; the product compositions showed linear relationships with the linearly changing biomass ratio. Charcoal and wood blends led to gaseous product with higher heating values for 0% MC and ER = 0.4. Values higher than
80% CGE were achieved by blends with ER≤ 0.3. Based on technical criteria, suitable conditions for obtaining co-gasification products appropriate to use in chemical synthesis were identified for BR ≤ 35% and 40 ≤MC≤ 50%. Another aspect evaluated was the content of undesirable nitrogen and sulfur com-pounds in the gaseous products. The results showed that is possible to obtain a suitable gas fuel for co-generation within recommended H2S limits only for
BR ≥ 95% by gasifying most of the coal-biomass blends. However, NH3 release was shown to be adequate for all cases studied. The contents of H2S and NH3 in the products were below the values rec-ommended in chemical synthesis for BR ≤ 5% and higher values of MC and ER. This study is the first step towards the selection of optimal coal-biomass blends for co-gasification. Future studies will take into account economic criteria and other technical issues, such as regional and seasonal availability of biomass sources.
ACKNOWLEDGMENTS
412 R. Rodrigues, A. R. Muniz and N. R. Marcilio
Brazilian Journal of Chemical Engineering NOMENCLATURE
ΔHr Heat of reaction (MJ/kmol)
N Number of chemical species 2
O
n Number of moles of O2 injected into the
reactor (kmol) 2,
O stoic
n Stoichiometric number of moles of O2
(kmol)
xi,est Estimated volume fraction of species i
(m3/m3)
xi,exp Measured volume fraction of species i
(m3/m3)
Y Gas yield (Nm3/kg)
Abbreviations
BR Biomass Ratio (kg/kg)
CC Carbon Conversion (kmol/kmol) CGE Cold Gas Efficiency (MJ/MJ) daf Dry ash-free basis
db Dry basis (H2O-free basis) ER Equivalence Ratio (kmol/kmol) HHV Higher Heating Value (MJ/kg)
LHV Lower Heating Value (MJ/kg or MJ/Nm3) MC Moisture Content (kg/kg)
N/A Not Available, Not Applicable %vol Volume percent (m3/m3) wb Wet basis
%wt Weight percent (kg/kg)
REFERENCES
Andrade, A. M., Passos, P. R. A., Marques, L. G. C., Oliveira, L. B., Vidaurre, G. B. and Rocha, J. D. S., Pyrolysis of coconut residues (Cocos nucifera L.) and analysis of charcoal. R. Árvore, 28(5), p. 707-714 (2004).
ANEEL, Atlas Electrical Energy of Brazil. National Agency of Electrical Energy (ANEEL), Brasília, Brazil (2008).
ANEEL, ANEEL Technical Report 2011. National Agency of Electrical Energy (ANEEL), Brasília, Brazil (2012).
Baggio, P., Baratieri, M., Fiori, L., Grigiante, M., Avi, D. and Tosi, P., Experimental and modeling analysis of a batch gasification/pyrolysis reactor. Energ. Convers. Manage., 50(6), p. 1426-1435 (2009).
Baratieri, M., Baggio, P., Fiori, L. and Grigiante, M., Biomass as an energy source: Thermodynamic con-straints on the performance of the conversion pro-cess. Bioresource Technol., 99(15), p. 7063-7073 (2008).
Brar, J. S., Singh, K., Wang, J. and Kumar, S., Co-gasification of coal and biomass: A review. Int. J. Forest. Res., 363058, p. 1-10 (2012).
Broetto, C. C., Perondi, D., Dettmer, A. and Godi-nho, M., Caracterização e cinética da pirólise do capim elefante. Congresso Brasileiro de Engenha-ria e Ciência dos MateEngenha-riais. Joinville, Brazil (2012). (In Portuguese).
Caton, P. A., Carr, M. A., Kim, S. S. and Beautyman, M. J., Energy recovery from waste food by com-bustion or gasification with the potential for re-generative dehydration: A case study. Energ. Convers. Manage., 51(6), p. 1157-1169 (2010). Chen, C.-J. and Hung, C.-I., Optimization of
co-gasification process in an entrained-flow gasifier using the Taguchi method. J. Therm. Sci. Tech., 8(1), p. 190-208 (2013).
CIENTEC, Aproveitamento Energético da Casca de Arroz. Fundação de Ciência e Tecnologia, CIENTEC, Porto Alegre, Brazil (1986). (In Portu-guese).
Coelho, S. T., Monteiro, M. B. and Karniol, M. R., Bioenergy Atlas for Brazil. Brazilian Reference Center on Biomass (CENBIO), São Paulo, Brazil (2012). (In Portuguese).
Collot, A.-G., Zhuo, Y., Dugwell, D. and Kandiyoti, R., Co-pyrolysis and co-gasification of coal and biomass in bench-scale fixed-bed and fluidised bed reactors. Fuel, 78(6), p. 667-679 (1999). EIA, International energy statistics. U.S. Energy
Information Administration (EIA), Washington, USA (2008).
Emami-Taba, L., Irfan, M. F., Daud, W. M. A. and Chakrabarti, M. H., Fuel blending effects on the co-gasification of coal and biomass – A review. Biomass Bioenerg., 57, p. 249-263 (2013). EPE, Brazilian Energy Balance 2012, year 2011.
Energy Research Company (EPE), Rio de Janeiro, Brazil (2012).
EPE, Statistical Yearbook of Electrical Energy 2013. Energy Research Company (EPE), Rio de Ja-neiro, Brazil (2013).
Esmaili, E., Mahinpey, N. and Lim, C. J., Modified equilibrium modelling of coal gasification with in situ CO2 capture using sorbent CaO: Assessment of approach temperature. Chem. Eng. Res. Des., 91(7), p. 1361-1369 (2013).
Fuwape, J., Charcoal and fuel value of agroforestry tree crops. Agroforest. Syst., 22(3), p. 175-179 (1993).
Evaluation of Biomass and Coal Co–Gasification of Brazilian Feedstock Using a Chemical Equilibrium Model 413
Brazilian Journal of Chemical Engineering Vol. 33, No. 02, pp. 401 - 414, April - June, 2016
(2013). <http://www.cantera.org>
Gordon, S. and McBride, B. J., Computer program for calculations of complex chemical equilibrium compositions, rocket performance, incident and reflected shocks and Chapman-Jougeut detona-tion. NASA, Washington, USA (1971).
Gordon, S., McBride, B. J. and Reno, M. A., Coeffi-cients for calculating thermodynamic and trans-port properties of individual species. NASA, Wash-ington, USA (1993).
Hernández, J. J., Aranda-Almansa, G. and Serrano, C., Co-gasification of biomass wastes and coal– coke blends in an entrained flow gasifier: An experimental study. Energ. Fuel, 24(4), p. 2479-2488 (2010).
Hoffmann, R., A method to evaluate the regionalised energy generation, with power plants lower than 1 MW, by the residual biomass administration–The rice husk's case. PhD Thesis, Department of Me-chanical Engineering, Federal University of Rio Grande do Sul, Porto Alegre, Brazil (1999). (In Portuguese).
Kalkreuth, W., Holz, M., Kern, M., Machado, G., Mexias, A., Silva, M., Willett, J., Finkelman, R. and Burger, H., Petrology and chemistry of Per-mian coals from the Paraná Basin: 1. Santa Tere-zinha, Leão-Butiá and Candiota Coalfields, Rio Grande do Sul, Brazil. Int. J. Coal. Geol., 68(1-2), p. 79-116 (2006).
Li, K., Zhang, R. and Bi, J., Experimental study on syngas production by co-gasification of coal and biomass in a fluidized bed. Int. J. Hydrogen En-ergy, 35(7), p. 2722-2726 (2010).
Li, X. T., Grace, J. R., Lim, C. J., Watkinson, A. P., Chen, H. P. and Kim, J., R. Biomass gasification in a circulating fluidized bed. Biomass Bioenerg., 26(2), p. 171-193 (2004).
Li, X. T., Grace, J. R., Watkinson, A. P., Lim, C. J. and Ergüdenler, A., Equilibrium modeling of gasification: A free energy minimization approach and its application to a circulating fluidized bed coal gasifier. Fuel, 80(2), p. 195-207 (2001). Linero, F. A. B., Lamônica, H. M., Integração BIG/GT
– Usina. Geração de energia por biomassa: Bagaço e palha de cana. Seminário Alternativas Energéti-cas a partir da Cana-de-açúcar. Centro de Tecno-logia Canavieira, CTC, Piracicaba, Brazil (2005). (In Portuguese).
Messig, D., Uebel, K., Gräbner, M. and Meyer, B., Numerical simulations of coal gasification in entrained flow gasifiers with coalFoam. 5th Open FOAM Workshop. Gothenburg, Sweden (2010). Mtui, P., Euler-Lagrange modeling of entrained flow
gasification of coke-biomass slurry mixture. Am.
J. Energy Eng., 1(4), p. 43-50 (2013).
Nogueira, L. A. H., Lora, E. E. S., Trossero, M. A., Frisk, T., Dendroenergia: Fundamentos e Aplica-ções. National Agency of Electrical Energy (ANEEL), Brasília, Brazil (2000). (In Portuguese). Parikka, M., Global biomass fuel resources. Biomass
Bioenerg., 27(6), p. 613-620 (2004).
Prins, M. J., Ptasinski, K. J. and Janssen, F. J. J. G., From coal to biomass gasification: Comparison of thermodynamic efficiency. Energy, 32(7), p. 1248-1259 (2007).
Puig-Arnavat, M., Bruno, J. C. and Coronas, A., Review and analysis of biomass gasification models. Renewable Sustainable Energy Rev., 14(9), p. 2841-2851 (2010).
Rodrigues, R., Marcilio, N. R., Trierweiler, J. O., Godinho, M. and Pereira, A. M. S., Co-gasification of footwear leather waste and high ash coal: A thermodynamic analysis. 27th Ann. Int. Pittsburgh Coal Conf. Istanbul, Turkey (2010).
Shabbar, S., Janajreh, I., Thermodynamic equilib-rium analysis of coal gasification using Gibbs energy minimization method. Energ. Convers. Manage., 65, p. 755-763 (2013).
Seabra, J. E. A., Tao, L., Chun, H. L. and Macedo, I. C., A techno-economic evaluation of the effects of centralized cellulosic ethanol and co-products refin-ery options with sugarcane mill clustering. Bio-mass Bioenerg., 34(8), p. 1065-1078 (2010). Sjöström, K., Chen, G., Yu, Q., Brage, C. and Rosén,
C., Promoted reactivity of char in co-gasification of biomass and coal: Synergies in the thermochemical process. Fuel, 78(10), p. 1189-1194 (1999). Song, Y., Feng, J., Ji, M., Ding, T., Qin, Y. and Li, W.,
Impact of biomass on energy and element utili-zation efficiency during co-gasification with coal. Fuel. Process. Technol., 115, p. 42-49 (2013). Usón, S., Valero, A., Correas, L. and Martínez, A.,
Co-gasification of coal and biomass in an IGCC power plant: Gasifier modeling. Int. J. Thermody-namics, 7(4), p. 165-172 (2004).
Vassilev, S. V., Baxter, D., Andersen, L. K. and Vassileva, C. G., An overview of the chemical composition of biomass. Fuel, 89(5), p. 913-933 (2010).
Villanueva, A. L., Gómez-Barea, A., Revuelta, E., Campoy, M. and Ollero, P., Guidelines for selection of gasifiers modelling strategies. 16th Eur. Biomass Conf. and Exhibition, Valencia, Spain (2008). Wander, P. R., Altafini, C. R. and Barreto, R. M.,
As-sessment of a small sawdust gasification unit. Biomass Bioenerg., 27(5), p. 467-476 (2004). WCA, Coal Statistics. World Coal Association
414 R. Rodrigues, A. R. Muniz and N. R. Marcilio
Brazilian Journal of Chemical Engineering
Xu, Q., Investigation of co-gasification characteris-tics of biomass and coal in fluidized bed gasifiers. PhD Thesis, Department of Chemical and Process Engineering, University of Canterbury, Christ-church, New Zealand (2013).
Xu, Q., Pang, S. and Levi, T., Reaction kinetics and producer gas compositions of steam gasification of coal and biomass blend chars, part 1: Experi-mental investigation, Chem. Eng. Sci., 66(10),
p. 2141-2148 (2011).
Zhou, L., Kinetic study on co-gasification of coal and biomass. PhD Thesis, Faculty of Mechanical, Department of Process and Energy Engineering, Freiberg University of Mining and Technology, Freiberg, Germany (2014).