doi: 10.1590/0101-7438.2015.035.01.0187
ANALYZING PERCEPTIONS ABOUT THE INFLUENCE OF A MASTER COURSE OVER THE PROFESSIONAL SKILLS OF ITS ALUMNI:
A MULTICRITERIA APPROACH
L´ıvia Dias de Oliveira Nepomuceno
1*and Helder Gomes Costa
2Received May 17, 2013 / Accepted August 12, 2014
ABSTRACT.This work proposes and applies an approach to evaluate perceptions about the effects of Professional Master’s Degree in Engineering over the professional performance of their alumni. The pro-posal is based on a trichotomous outranking multicriteria method, called ELECTRE TRI (Mousseau et al., 2000). An application of the proposal has been made, catching the perceptions from students and professors of a Brazilian course of a Professional Master in Production Engineering, also from chiefs these students and coordinators of courses of Professional Masters of a similar range. The set of criteria was based on literature review and refined by opinions from specialists. The participants of the research were asked about their perceptions on importance degree of criteria and level of influence of the course upon the alumni’ skills, from each criterion considered in the survey. The results obtained from each group were compared. Additionally a sensibility analysis was carried on the results.
Keywords: Professional Skills, ELECTRE TRI, Professional Master’s Degree.
1 INTRODUCTION
A relevant issue for the staff of organizations is to known how their products performance are perceived by the market. In the context of goods or intangible products, this problem keeps relevant, but once it is produced while it is absorbed consumed the complexity rises because in the process of production of a good, the costumer is also working in process, material to be processed, and workforce. The growth in complexity implies in the increasing the relevance to identify the perceptions about the performance of intangible products.
In this context, a relevant question that emerges in university management environment is: how to categorize the influence of Professional Master Course over the Professional Skills of their alumni (one of the universities’ products). Knowing the answer to this question is relevant, since it could support university staff and council to improve their decisions and to review course goals.
*Corresponding author.
It is a typical operational research problem that regards multiple criteria or variables and could be approached by techniques such as data mining, artificial neural networks (ANN), multivariate statistics, or even a multicriteria method. As reported in Roy (1990) multicriteria decision aid (MCDA) methods are suitable for modeling problems under subjectivity, uncertainty and am-biguous, since they take into account such elements which turns the modeling closer to reality. Roy (1990) highlights that: despite MCDA methods could fail in supporting axiomatic valida-tions, they are robust while performing and validating coherence analysis. So, as the problem under focus is a peculiar sorting one in which subjectivity evaluations are in its core, a native multicriteria sorting method (ELECTRE TRI) was chosen to be applied in the modeling.
A search performed in scientific papers’ databases through Scopus, ISI Web of Science and SciELO, complemented by a search in Scholar Google found out some papers in literature that deal with the problem of university evaluations under a multicriteria approach, such as: Hon et al. (1996); Politis & Siskos (2004); Neves (2005); B¨uy¨uk¨ozkan et al. (2007); Celik et al. (2009); Chao & Chen (2009); Ginevicius & Gineviciene (2009); Ho et al. (2009); Chen & Chen (2010); Giannoulis & Ishizaka (2010); Hernandez et al. (2010); Lukman et al. (2010) and P´erez-Mart´ınez et al. (2010). Despite the existence of these previous works, it is relevant to underline that it was not found in literature a previous paper that has applied a multicriteria approach to modeling the problem of evaluation the influence of a Professional Master Course over the Professional Skills of the alumni, despite it is a typical multicriteria problem.
The objective of this paper is to present a modeling for sorting perceptions from different groups about the influence of a Master Course over professional profiles of its alumni. The modeling considers multiple criteria evaluations taken from multiple evaluators and it is based on the ap-plication of a trichotomous outranking MCDA method: ELECTRE TRI, reported in Yu (1992) and in Mousseau et al. (2000). The choice of ELECTRE TRI is justified by the fact that, at the time the modeling was built, it was the only one MCDA method to deals with sorting problems, as describe in the next section.
As a description of an application of an operations research method, the main contribution of the paper is to build the modeling of a relevant management problem by the use of an operations research method under a multiple criteria viewpoint.
2 MULTICRITERIA DECISION MAKING
because it addresses a set of decision issues not yet covered in therein, such as the project budget, market share, and cost sharing.
The multicriteria methods could also be classified into compensatory or non-compensatory, Compensatory methods are based in the principles of the Multi Attribute Utility Theory (MAUT) and, as reported in Fishburn (1970) or in Keeney & Raiffa (1976) in this approach a total func-tion is built as a linear combinafunc-tion of individual utility funcfunc-tions. In the other hand, a method that uses a non-compensatory logic, builds relationships between pairs of alternatives. These relationships can be of preference or outranking.
In order to well-establish the difference between compensatory and non-compensatory ap-proaches, Costa et al. (2007) considered an analogy with a volleyball match, in which team A wins team B by 25 to 5 in the first set; but lose the three following sets to team B by 25 to 20. In this situation we could adopt the following procedures to identify the winner of the match:
a) Use the sum of the points gained by the team in each set. In this case, team A would be the winner by 85×80. This procedure could be classified as a MAUT or compensatory approach.
b) Use the number of game sets that each team wins. In this case, team B would be the winner by 3×1. This procedure could be classified as a non-compensatory approach.
As reported in Costa (2014), the main principle of non-compensatory approach is similar to the second procedure above, if one considers each game set as a criterion. That is: the main principle of non-compensatory is that:
– an alternativea ispreferable than another oneb if ithas a performancebetterthanb, under the major importance criteria. This principle is applied for non-compensatory
preferencebased methods, as in PROMETHEE methods.
– an alternativea non-dominatedby another onebif ithasnot worseperformancethan
b, under the major importance criteria. This principle is applied for non-compensatory
outrankingbased methods, as inELECTRE methods.
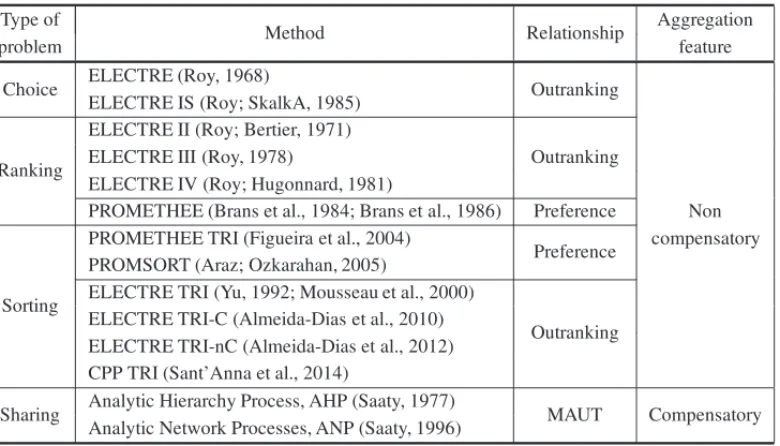
Based on these definitions, Table 1 was build and reports a brief differentiation between some of the most known methods of MCDA, those that are most cited in ISI Web of Science or in Scopus. The choice to insert only the most cited methods in Table 1 is because this work does not address the establishing an exhaustive comparison among MCDA methods and their features.
The following comments complement the information in Table 1:
• ELECTRE IS, TRI, TRI-C, TRI-nC, III and IV deal with “pseudo criteria”, while ELEC-TRE I and II deal with “true criteria” – see Roy & Skalka (1985) for the definitions of true criteria and pseudo criteria.
Table 1– Features of some MCDA methods.
Type of
Method Relationship Aggregation
problem feature
Choice ELECTRE (Roy, 1968) Outranking
Non ELECTRE IS (Roy; SkalkA, 1985)
compensatory Ranking
ELECTRE II (Roy; Bertier, 1971)
Outranking ELECTRE III (Roy, 1978)
ELECTRE IV (Roy; Hugonnard, 1981)
PROMETHEE (Brans et al., 1984; Brans et al., 1986) Preference
Sorting
PROMETHEE TRI (Figueira et al., 2004)
Preference PROMSORT (Araz; Ozkarahan, 2005)
ELECTRE TRI (Yu, 1992; Mousseau et al., 2000)
Outranking ELECTRE TRI-C (Almeida-Dias et al., 2010)
ELECTRE TRI-nC (Almeida-Dias et al., 2012) CPP TRI (Sant’Anna et al., 2014)
Sharing Analytic Hierarchy Process, AHP (Saaty, 1977) MAUT Compensatory Analytic Network Processes, ANP (Saaty, 1996)
• ELECTRE TRI-C and ELECTRE TRI nC are variations from ELECTRE TRI, and focus in the definition of the profiles that delimitate the categories in ELECTRE TRI.
• PROMETHE and ELECTRE are both non-compensatory multicriteria methods. PROME-THEE differs from ELECTRE because ELECTRE uses non-dominance relations, instead of the preference relations used in PROMETHEE.
• Although AHP was proposed and is used for choice problems, in its inner algorithm it first of all calculates the sharing of priorities. Is based in this first sharing that AHP builds in posterior steps a ranking and finally indicates a choice. However, the use of a sharing for building rankings to support choices is susceptible to rank reversal, which demands careful while using AHP for choice or ranking. In view of this and as the first result of AHP is a sharing, it was classified here as a sharing method, instead of a choice one.
Notice that the choice of a multicriteria method depends on the type of problem addressed; i.e.: it depends on the results that the decision maker wants to achieve in modeling the problem. As the object of this research is to solve a sorting problem, one should use one of the follow methods: ELECTRE TRI, PROMETHEE TRI, PROMSORT, ELECTRE TRI-C, ELECTRE TRI-nC and CPP-TRI.
categories’ profiles” (Sant’Anna et al., 2014). So, these methods (ELECTRE TRI-C, TRI-nC, PROMETHEE TRI, and CPP-TRI) as a whole, defines de profiles in “a posteriori” basis.
In the present paper, the evaluation was based in a verbal Likert scale (Likert, 1932), which implies in a pre-definition of the profiles or boundaries of the classes. In the other hand, the choice for use a non-dominance or outrank approach has justified the use of ELECTRE TRI as the method to be applied in the modeling.
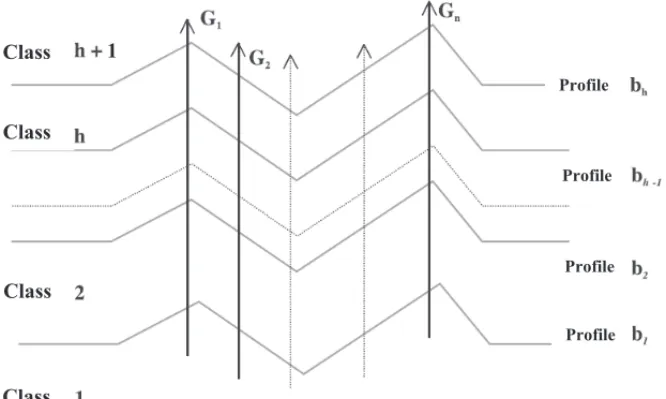
ELECTRE TRI is designed to approach sorting problems, in which alternatives of a set A = {a1,a2, . . . ,am}, are allocated into a set of categories or class in C= {C1,C2, . . . ,Ch}, consid-ering the performance of the elements in A under a set of criteria criteria set F= {c1,c2, . . . ,cj,
. . . ,cn}. The classes in C are delimited by a set B = {b1,b2, . . . ,bh}of profiles. A matrix of grades G=G(a)= {{g1(a1),g2(a1), . . . ,gn(a1)},{g1(a2),g2(a2), . . . ,gn(a2)}, . . . ,{g1(am), g2(am), . . . ,gn(am)},}, . . . ,{g1(a1),g2(am), . . . ,gn(am)}}. Figure 1 illustrates these elements used in ELECTRE TRI.
To assign an alternative to a category, ELECTRE TRI method defines two assignment proce-dures: an optimistic, and a pessimistic that tries to assign the alternatives into the lowest cate-gories.
In this work the pessimistic assignment procedure is adopted, in order to obtain a more exigent classification.
1 Class
Class
Class
Class
Profile
Profile
Profile
Profile
Figure 1– Class of the ELECTRE TRI (Costa et al., 2007).
3 ANALYSES OF PERCEPTIONS
This section presents the steps of the modeling reported in this paper, which has been structured on the following:
• Building the questionnaire for data collection
• Setting parameters of ELECTRE TRI
• Data collection from coordinators, professors, students and chiefs
• Using ELECTRE TRI algorithm for outranking
• Comparing the results from different groups
3.1 Contextualizing the Problem
The proposal was applied in two different contexts: to get the perceptions from coordinators of courses located in Brazil, about the influence of these courses on the skills of their alumni; and, to get the perception of the students, chiefs, and professors regarding a specific course on production engineering, also located in Brazil. Therefore, the sample was composed by the following groups:
• Group 1: Coordinators of courses of Professional Master’s Degree in Engineering III (Aerospace, Production, Mechanical and Naval engineering as denoted by CAPES – Coor-dination for the Improvement of Higher Education Personnel). This group was composed by 10 coordinators.
• Group 2: Professors of a Professional Master’s Degree course in Production Engineering. This group was composed by 32 professors.
• Group 3: Students of a specific class of the course mentioned in Group 2. This group was composed by 33 students.
• Group 4: Chiefs of the students in the company where they worked while the research was carried out. This group was composed by 5 Chiefs.
It is important to highlight that:
• The word “coordinator” is used as reference for professors who, at the time of the survey, also played an administrative position (coordination) in a post-graduate courses included in the survey;
• The word “professor” refers to teachers who, at the time of the survey, performed their job at the specific course which was investigated;
• The word “student” is used indiscriminately for students and alumni of the course (the students, in their entirety had already finished the lectures and were nearing to complete the dissertation – or have already completed it) and,
The responses from Groups 2, 3 and 4 refer to perceptions about the influence of a master’s degree program in a public university located in Southeast of Brazil, in the city of Niteroi at the metropolitan region of Rio de Janeiro State. This course was created in 2000 and focuses on studying organizational models for management under a sustainable perspective. It is interesting to highlight that companies have been sponsoring this kind of master program, as a strategy they adopt for qualifying their employees and improve their intellectual capital.
Whereas the objective of this case is to experience the application and to analyze the modeling difficulties, it was decided to experiment the proposal in a limited universe. Although this restric-tion implies on limiting the extrapolarestric-tion of results from this particular case, it does not imply on loss of generality about the analyzing of the proposal’s applicability.
Once the members of the Group G1 are spread along the Brazilian land, and the Curse is located in a unique Brazilian city, the previous experience from the member of the Group G1 should differ from the experience of the members of the other groups. Take this situation in mind is relevant when analyzing the results, in order to avoid misinterpretations and mistakes in the conclusion.
3.2 Building the Questionnaire
This section describes the preparation of the questionnaire and it is divided into two parts: definition of the set of criteria; and, definition of the scales used to collect the perceptions.
Building the criteria set
The definition of the set of criteria was supported by a review in papers dealing about evaluation of educational systems. As result of the literature review it was observed that most of the papers analyzed approach three aspects related to educational systems evaluation:
• Performance evaluation of courses and universities: in general, the papers in this subject takes into consideration the evaluation of infrastructure, curriculum and teachers, as in the works of: Hon et al. (1996); Celik et al. (2009); Ginevicius & Gineviciene (2009); Chen & Chen (2010); Giannoulis & Ishizaka (2010) and Lukman et al. (2010).
• Evaluation of learning methods: most of the articles in this context seeks primarily to assess the ways of acquiring knowledge by the student, as in the works of: B¨uy¨uk¨ozkan et al. (2007); Chao & Chen (2009); Ho et al. (2009); Hernandez et al. (2010) and P´erez-Mart´ınez et al. (2010).
• Evaluation of the influence of the course on the skills of its graduates: was found few papers dealing with this kind of theme. It is interesting to note that all the works in this subject were applied to analyze a course in the industrial engineering subject as one can see at Politis & Siskos (2004) and Neves (2005).
A preliminary version of the set of criteria was created based on the literature review, taking into account, mainly the works of Politis & Siskos (2004) and Neves (2005). Politis & Siskos (2004) used a MCDA approach to evaluate the performance of the Department of Industrial Engineering and Management of the Technical University of Crete based on perceptions from students, graduates and also from companies where they work. Neves (2005) adapted the criteria used in Politis & Siskos (2004) for evaluating a course of master’s degree under a strategic viewpoint, integrating the use of ELECTRE TRI to SWOT analysis.
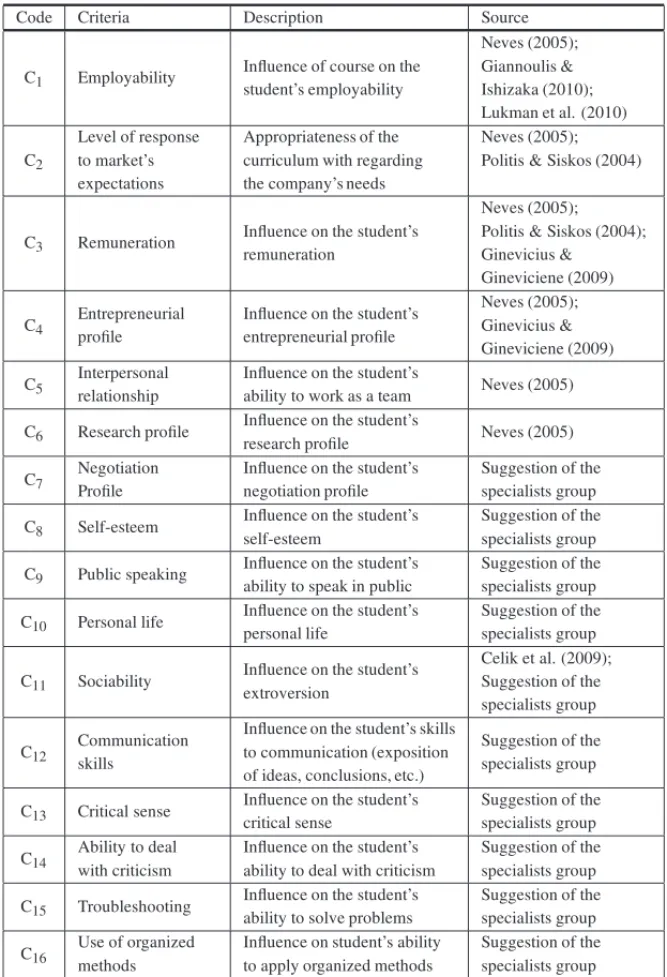
Based on these works, a draft version of the questionnaire was submitted for a group composed by five specialists for validation of the criteria. These specialists have a large previous experience in the management of courses in the context of Brazilians Master’s Degree Courses. This group has suggested an update of the questionnaire, in which has resulted in the set of criteria shown in Table 2. Note that criteria C7, C8, C9, C10, C11, C12, C13, C14, C15, C16 were included as a suggestion of the group of specialists.
The criteria C1(Employability), C3(Remuneration) and C10(Personal life) were not considered in the research with the chiefs, which was held by 13 other assessment criteria.
Defining scales to catch perceptions about criteria’s importance and about performance of the master’s degree course
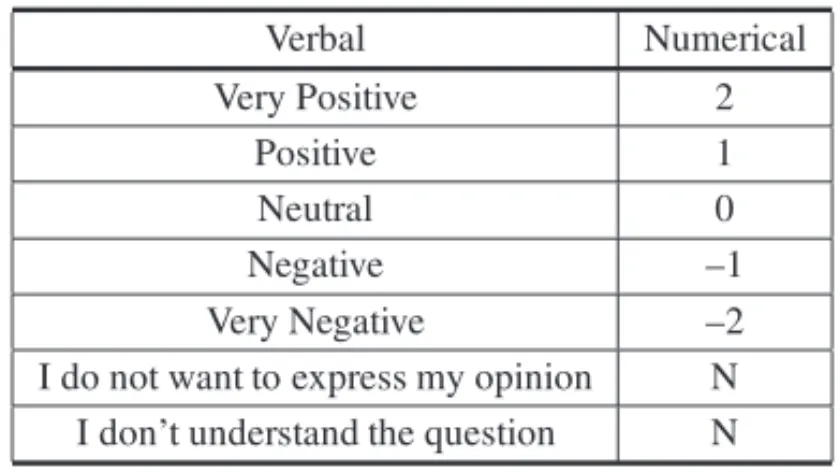
The Table 3 shows the scale used to get the perceptions about the influence of the course on alumni’s performance. The Table 4 presents the scales to catch perceptions about the importance degree of the criteria. The “zero” position (No Importance) mean the evaluator thinks the specific criterion should not be considered in the evaluation. These scales were adopted in a closed-end questionnaire in order to collect the perceptions from respondents on both aspects: degree of importance of each criterion; and, the influence of the course over the profiles of the alumni, under each criterion viewpoint. The scales shown in Tables 3 and 4 are based on Likert (1932) and Miller (1954). As highlighted in Costa et al. (2007) these scales allow to the evaluators “count on the fingers” while expressing his opinion and also allows the use of a verbal language. The response “I do not want to express my opinion/ I don’t understand the question” was also included as an option, in order to avoiding ambiguity on responses.
3.3 Setting ELECTRE TRI Parameters for Modeling
As described in Section 2, in ELECTRE TRI it is necessary to define a set of categories or reference classes. As shown in Figure 1, the reference classes are defined by a set of lower limits or profiles. In the other hand, the profiles are directly related to the scale used to collect perceptions about influence (shown in Table 3). Taking into account these directions, the classes of reference adopted in this proposal were defined in Table 5.
As one can observe, the Class A is contained into Class B, which is contained into Class C, which is contained into D, which is contained into Class E. So, mathematically these categories do not form a partition.
Table 2– Description of the criteria.
Code Criteria Description Source
C1 Employability
Influence of course on the student’s employability
Neves (2005); Giannoulis & Ishizaka (2010); Lukman et al. (2010)
C2
Level of response to market’s expectations
Appropriateness of the curriculum with regarding the company’s needs
Neves (2005); Politis & Siskos (2004)
C3 Remuneration Influence on the student’s
remuneration
Neves (2005); Politis & Siskos (2004); Ginevicius &
Gineviciene (2009)
C4
Entrepreneurial profile
Influence on the student’s entrepreneurial profile Neves (2005); Ginevicius & Gineviciene (2009) C5 Interpersonal relationship
Influence on the student’s
ability to work as a team Neves (2005)
C6 Research profile
Influence on the student’s
research profile Neves (2005)
C7
Negotiation Profile
Influence on the student’s negotiation profile
Suggestion of the specialists group
C8 Self-esteem
Influence on the student’s self-esteem
Suggestion of the specialists group
C9 Public speaking Influence on the student’s
ability to speak in public
Suggestion of the specialists group
C10 Personal life
Influence on the student’s personal life
Suggestion of the specialists group
C11 Sociability
Influence on the student’s extroversion
Celik et al. (2009); Suggestion of the specialists group
C12
Communication skills
Influence on the student’s skills to communication (exposition of ideas, conclusions, etc.)
Suggestion of the specialists group
C13 Critical sense
Influence on the student’s critical sense
Suggestion of the specialists group
C14
Ability to deal with criticism
Influence on the student’s ability to deal with criticism
Suggestion of the specialists group
C15 Troubleshooting
Influence on the student’s ability to solve problems
Suggestion of the specialists group
C16
Use of organized methods
Influence on student’s ability to apply organized methods
Suggestion of the specialists group
Table 3– Scale to assess the influence level of the course.
Verbal Numerical
Very Positive 2
Positive 1
Neutral 0
Negative –1
Very Negative –2
I do not want to express my opinion N I don’t understand the question N
Table 4– Scale to assess the degree of importance of the criteria.
Verbal Numerical
Extreme Importance 4 High Importance 3 Middle Importance 2
Low Importance 1
No Importance 0
I do not want to express my opinion N I don’t understand the question N
Table 5– References Classes.
Class Description Lower Limit A Very Positive 1.5
B Positive 0.5
C Neutral –0.5
D Negative –1.5 E Very Negative –∞
3.4 Data Collection
The questionnaires were sent by e-mail to members of the four groups. The Table 6 shows the response rate obtained.
Table 6– Percentage of answers.
Groups Answers Percentage (%) 1 (Coordinators) 9 90
2 (Professors) 20 62,5 3 (Students) 21 63,64
In the next sections the data collected from each group of respondents are shown, in a detailed way. It also presents a filtering process to the data avoiding “N” answers. By measuring the average, the criteria with higher value about degree of importance are considered as the most important criteria and the criteria with higher value about level of influence are considered as those with the most positive influence over alumni performance.
3.4.1 Data Collect from Coordinators
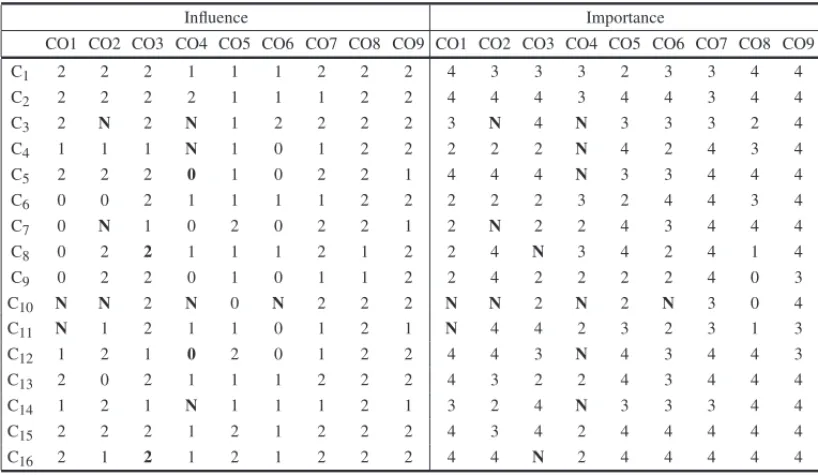
Table 7 shows the perceptions expressed by the Coordinators. In coordinators’ view, the most important criteria are C2(Level of response to market expectations), C5(Interpersonal relation-ship), C15(Troubleshooting) and C16(Use of organized methods). On the other hand, the coor-dinators think that the most positive influence of the Master’s degree course are linked to criteria C1(Employability), C2, C3(Remuneration), C15 and C16. We also note there were no answers “–1” and “–2”, whose perceptions are related to a negative influence level of the course and the coordinator CO8 thinks the criteria C9and C10are not important.
Table 7– Perceptions from coordinators about influence and importance.
Influence Importance
CO1 CO2 CO3 CO4 CO5 CO6 CO7 CO8 CO9 CO1 CO2 CO3 CO4 CO5 CO6 CO7 CO8 CO9
C1 2 2 2 1 1 1 2 2 2 4 3 3 3 2 3 3 4 4
C2 2 2 2 2 1 1 1 2 2 4 4 4 3 4 4 3 4 4
C3 2 N 2 N 1 2 2 2 2 3 N 4 N 3 3 3 2 4
C4 1 1 1 N 1 0 1 2 2 2 2 2 N 4 2 4 3 4
C5 2 2 2 0 1 0 2 2 1 4 4 4 N 3 3 4 4 4
C6 0 0 2 1 1 1 1 2 2 2 2 2 3 2 4 4 3 4
C7 0 N 1 0 2 0 2 2 1 2 N 2 2 4 3 4 4 4
C8 0 2 2 1 1 1 2 1 2 2 4 N 3 4 2 4 1 4
C9 0 2 2 0 1 0 1 1 2 2 4 2 2 2 2 4 0 3
C10 N N 2 N 0 N 2 2 2 N N 2 N 2 N 3 0 4
C11 N 1 2 1 1 0 1 2 1 N 4 4 2 3 2 3 1 3
C12 1 2 1 0 2 0 1 2 2 4 4 3 N 4 3 4 4 3
C13 2 0 2 1 1 1 2 2 2 4 3 2 2 4 3 4 4 4
C14 1 2 1 N 1 1 1 2 1 3 2 4 N 3 3 3 4 4
C15 2 2 2 1 2 1 2 2 2 4 3 4 2 4 4 4 4 4
C16 2 1 2 1 2 1 2 2 2 4 4 N 2 4 4 4 4 4
It can also be observed 24 answers “N” in the responses from coordinators. This result implies in a “N” rate inferior to 10%, since there are 288 responses. The answers “N” must not be considered in the calculus by ELECTRE TRI. Adopting this filtering process, the following evaluations were discarded while using ELECTRE TRI:
• Criteria C3: evaluations from coordinators CO2 and CO4.
• Criteria C5: evaluations from coordinator CO4.
• Criteria C7: evaluations from coordinator CO2.
• Criteria C8: evaluations from coordinator CO3.
• Criteria C10: evaluations from coordinators CO1, CO2, CO4 and CO6.
Another consideration on the “N” responses is that the criterion with major number of “N” an-swers was C10: “influence on personal life of the student”, which means that the coordinator does not know about the personal life of the student, which is not a surprising result.
3.4.2 Data Collect from Professors
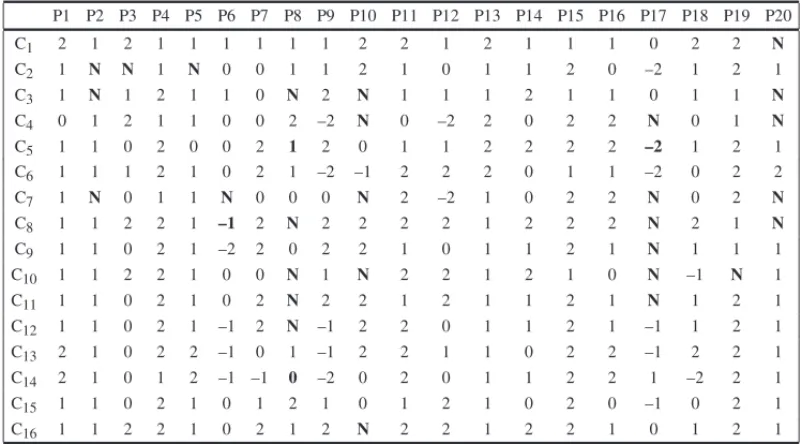
Tables 8 and 9 show the perceptions expressed by Professors. As can be observed, in professors’ view, the most important criteria are C1(Employability), C2 (Level of response to market ex-pectations), C6(Research profile), C12(Communication skills) and C13 (Critical sense). On the other hand, the professors think that the most positive influence of the Master’s degree course are linked to criteria C8(Self-esteem) and C16(Use of organized methods). We note some professors perceive a negative influence of the course linked to some criteria as shown following:
• P6 – Criteria C8, C9, C12, C13and C14
• P7 – Criteria C14
• P9 – Criteria C4, C6, C12, C13and C14
• P10 – Criteria C5
• P12 – Criteria C4and C7
• P17 – Criteria C2, C5, C6, C12, C13and C15
• P18 – Criteria C10and C14
One can also notice that some professors perceive that some criteria are not important:
• P3 – Criteria C10
• P9 – Criteria C8and C9
• P10 – Criteria C15
There are 44 answers “N” in the responses from professors. Adopting calculus by ELECTRE TRI, the following evaluations were discarded:
• Criteria C1: evaluations from professor P20.
Table 8– Perceptions from professors about influence.
P1 P2 P3 P4 P5 P6 P7 P8 P9 P10 P11 P12 P13 P14 P15 P16 P17 P18 P19 P20
C1 2 1 2 1 1 1 1 1 1 2 2 1 2 1 1 1 0 2 2 N
C2 1 N N 1 N 0 0 1 1 2 1 0 1 1 2 0 –2 1 2 1
C3 1 N 1 2 1 1 0 N 2 N 1 1 1 2 1 1 0 1 1 N
C4 0 1 2 1 1 0 0 2 –2 N 0 –2 2 0 2 2 N 0 1 N
C5 1 1 0 2 0 0 2 1 2 0 1 1 2 2 2 2 –2 1 2 1
C6 1 1 1 2 1 0 2 1 –2 –1 2 2 2 0 1 1 –2 0 2 2
C7 1 N 0 1 1 N 0 0 0 N 2 –2 1 0 2 2 N 0 2 N
C8 1 1 2 2 1 –1 2 N 2 2 2 2 1 2 2 2 N 2 1 N
C9 1 1 0 2 1 –2 2 0 2 2 1 0 1 1 2 1 N 1 1 1
C10 1 1 2 2 1 0 0 N 1 N 2 2 1 2 1 0 N –1 N 1
C11 1 1 0 2 1 0 2 N 2 2 1 2 1 1 2 1 N 1 2 1
C12 1 1 0 2 1 –1 2 N –1 2 2 0 1 1 2 1 –1 1 2 1
C13 2 1 0 2 2 –1 0 1 –1 2 2 1 1 0 2 2 –1 2 2 1
C14 2 1 0 1 2 –1 –1 0 –2 0 2 0 1 1 2 2 1 –2 2 1
C15 1 1 0 2 1 0 1 2 1 0 1 2 1 0 2 0 –1 0 2 1
C16 1 1 2 2 1 0 2 1 2 N 2 2 1 2 2 1 0 1 2 1
Table 9– Perceptions from professors about importance of the criteria.
P1 P2 P3 P4 P5 P6 P7 P8 P9 P10 P11 P12 P13 P14 P15 P16 P17 P18 P19 P20
C1 4 3 4 3 3 3 4 4 4 4 3 4 4 3 4 3 3 4 4 3
C2 4 N 4 2 N 4 3 3 4 4 4 3 4 4 2 2 4 3 4 3
C3 4 N 4 4 2 3 4 4 2 4 4 2 4 2 4 3 1 3 4 3
C4 4 2 3 3 2 3 2 4 4 3 3 2 3 3 2 4 N 2 4 2
C5 2 3 3 3 2 4 3 N 2 3 4 3 3 4 3 3 N 2 4 3
C6 3 2 2 4 4 3 2 4 4 2 4 4 3 4 2 2 4 4 4 4
C7 3 N 2 2 3 4 3 3 3 2 4 2 3 2 1 2 N 2 4 3
C8 3 2 2 4 4 N 1 2 0 4 4 4 4 4 1 4 N 4 4 3
C9 4 2 2 3 4 3 3 3 0 4 1 2 3 3 1 2 N 2 4 3
C10 4 2 0 4 4 3 1 3 2 N 4 4 3 3 1 1 N 4 4 2
C11 3 2 1 4 3 4 3 3 1 4 1 4 3 4 1 2 N 2 4 2
C12 3 2 3 4 4 4 4 3 4 4 4 2 4 4 1 4 2 3 4 4
C13 4 2 4 4 4 3 2 4 4 4 4 3 3 4 1 3 2 3 4 4
C14 4 2 1 1 4 3 3 N 4 4 4 4 3 3 1 4 2 2 4 3
C15 3 2 4 3 3 3 4 4 4 0 3 4 3 4 1 3 3 4 4 2
C16 3 2 1 3 3 2 3 3 4 N 4 4 3 4 3 3 4 4 4 2
• Criteria C3: evaluations from professors P2, P8, P10 and P20
• Criteria C4: evaluations from professors P10, P17 and P20.
• Criteria C5: evaluations from professors P8 and P17.
• Criteria C8: evaluations from professors P6, P8, P17 and P20.
• Criteria C9: evaluations from professor P17.
• Criteria C10: evaluations from professors P8, P10, P17 and P19.
• Criteria C11: evaluations from professor P8 and P17.
• Criteria C12: evaluations from professor P8.
• Criteria C14: evaluations from professor P8.
• Criteria C16: evaluations from professor P10.
The criterion with major number of “N” answers was C7: “influence on the negotiation profile of the student”, which means that the professor does not know about the negotiator profile of the student.
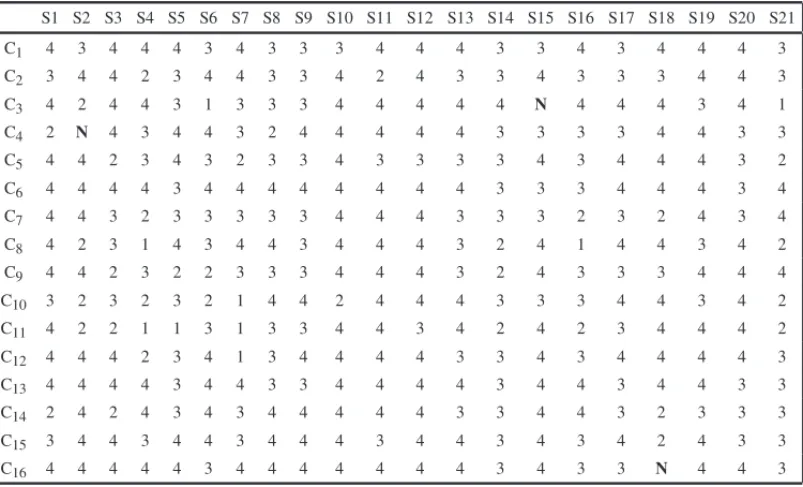
3.4.3 Data Collect from Students
Tables 10 and 11 show the perceptions expressed by the students. As can be observed, in stu-dents’ view, the most important criteria are C6(Research profile), C13(Critical sense) and C16 (Use of organized methods). On the other hand, the students think that the most positive influence of the Master’s degree course are linked to criteria C6, C8(Self-esteem) and C13. We note some students perceive a Negative influence of the course linked to some criteria as shown following:
• S12 – Criteria C3
• S16 – Criteria C7and C10
• S17 – Criteria C3and C10
• S19 – Criteria C3
The student S2 had answered “N” in questions 4 and 8, which should suggest that this student does not understand the questions 4 and 8. So the criteria C4 and C8 were discarded in the analysis of the answers of student S2, as well as criterion C3and criterion C16, respectively, have been avoided from the analyzes of the answers from students S15 and S18.
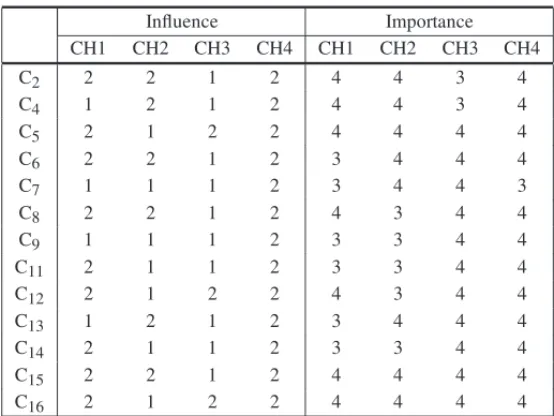
3.4.4 Data Collect from Chiefs
Table 12 shows the perceptions expressed by the chiefs. As can be observed, in chiefs’ view, the most important criteria are C5(Interpersonal relationship), C15 (Troubleshooting) and C16 (Use of organized methods). On the other hand, they think that the most positive influence of the Master’s degree course are linked to criteria C2(Level of response to market expectations), C5 (Interpersonal relationship), C6 (Research profile), C8(Self-esteem), C12 (Communication skills), C15(Troubleshooting) and C16(Use of organized methods).
Table 10– Perceptions from students about influence.
S1 S2 S3 S4 S5 S6 S7 S8 S9 S10 S11 S12 S13 S14 S15 S16 S17 S18 S19 S20 S21
C1 2 1 1 1 2 1 1 1 2 2 2 0 0 2 1 1 1 1 1 1 1
C2 2 1 0 1 2 2 1 1 2 1 2 1 1 1 1 1 1 1 1 1 1
C3 0 0 0 0 1 0 1 0 1 0 2 –2 0 0 N 0 –2 1 –1 0 1
C4 0 N 2 1 2 2 1 1 2 2 1 2 1 1 1 1 2 2 2 1 1
C5 2 1 1 1 2 1 0 2 2 2 1 1 2 2 2 0 1 2 2 1 1
C6 2 0 2 2 2 2 2 2 2 2 2 2 2 2 2 1 2 2 1 1 1
C7 2 0 1 0 1 1 1 1 2 1 2 2 1 1 1 –1 1 1 1 1 1
C8 2 N 2 1 2 2 2 2 1 2 2 1 1 1 2 1 2 2 1 2 1
C9 2 1 1 1 1 0 0 2 1 2 2 1 2 1 2 0 2 1 2 2 1
C10 2 1 2 0 1 1 0 2 2 2 0 1 1 1 2 –1 –1 2 0 2 1
C11 2 1 1 0 0 1 0 1 1 2 2 1 2 1 2 0 2 1 1 2 1
C12 2 1 2 1 2 2 0 1 1 2 2 1 2 1 2 1 2 2 2 2 1
C13 2 1 2 2 2 2 2 1 2 2 1 1 2 1 2 1 2 2 2 1 1
C14 1 1 2 2 1 1 1 2 2 2 0 2 2 2 1 1 1 1 2 1 1
C15 1 0 2 1 2 2 2 1 2 1 1 2 2 1 2 0 2 1 2 1 1
C16 2 0 2 2 2 1 2 1 2 1 2 1 2 1 2 0 2 N 2 2 1
Table 11– Perceptions from students about importance of the criteria.
S1 S2 S3 S4 S5 S6 S7 S8 S9 S10 S11 S12 S13 S14 S15 S16 S17 S18 S19 S20 S21
C1 4 3 4 4 4 3 4 3 3 3 4 4 4 3 3 4 3 4 4 4 3
C2 3 4 4 2 3 4 4 3 3 4 2 4 3 3 4 3 3 3 4 4 3
C3 4 2 4 4 3 1 3 3 3 4 4 4 4 4 N 4 4 4 3 4 1
C4 2 N 4 3 4 4 3 2 4 4 4 4 4 3 3 3 3 4 4 3 3
C5 4 4 2 3 4 3 2 3 3 4 3 3 3 3 4 3 4 4 4 3 2
C6 4 4 4 4 3 4 4 4 4 4 4 4 4 3 3 3 4 4 4 3 4
C7 4 4 3 2 3 3 3 3 3 4 4 4 3 3 3 2 3 2 4 3 4
C8 4 2 3 1 4 3 4 4 3 4 4 4 3 2 4 1 4 4 3 4 2
C9 4 4 2 3 2 2 3 3 3 4 4 4 3 2 4 3 3 3 4 4 4
C10 3 2 3 2 3 2 1 4 4 2 4 4 4 3 3 3 4 4 3 4 2
C11 4 2 2 1 1 3 1 3 3 4 4 3 4 2 4 2 3 4 4 4 2
C12 4 4 4 2 3 4 1 3 4 4 4 4 3 3 4 3 4 4 4 4 3
C13 4 4 4 4 3 4 4 3 3 4 4 4 4 3 4 4 3 4 4 3 3
C14 2 4 2 4 3 4 3 4 4 4 4 4 3 3 4 4 3 2 3 3 3
C15 3 4 4 3 4 4 3 4 4 4 3 4 4 3 4 3 4 2 4 3 3
Table 12– Perceptions from chiefs about influence and importance.
Influence Importance CH1 CH2 CH3 CH4 CH1 CH2 CH3 CH4
C2 2 2 1 2 4 4 3 4
C4 1 2 1 2 4 4 3 4
C5 2 1 2 2 4 4 4 4
C6 2 2 1 2 3 4 4 4
C7 1 1 1 2 3 4 4 3
C8 2 2 1 2 4 3 4 4
C9 1 1 1 2 3 3 4 4
C11 2 1 1 2 3 3 4 4
C12 2 1 2 2 4 3 4 4
C13 1 2 1 2 3 4 4 4
C14 2 1 1 2 3 3 4 4
C15 2 2 1 2 4 4 4 4
C16 2 1 2 2 4 4 4 4
3.5 Using the ELECTRE TRI for Classifying the Course: Coordinators’ Perceptions
The ELECTRE TRI was employed in order to obtain the categorization under each respondent perspective in order to find out the distribution of the classifications over the classes.
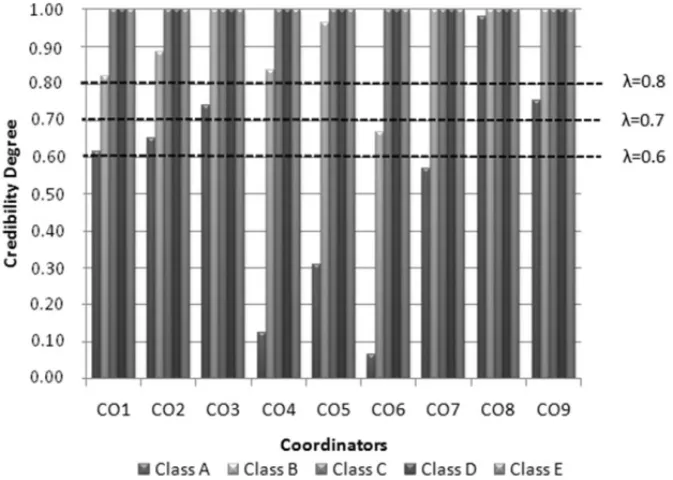
Figure 2 shows the credibility degree assigned to coordinators perceptions. The horizontal axis of this figure is associated to the coordinators’ code and the vertical axis is associated to the credi-bility degree. The values in Figure 2 inform the credicredi-bility degree associated with the affirmation that the influence of the course is not inferior to the boundary limit of the category. This figure also presents how a credibility profile (λ) equal to 0.8, 0.7 or 0.6 cuts the graph. For example, based on coordinator CO8 responses, there is a credibility degree of 98% that the influence of course is at least Class A (Very Positive) and a credibility degree of 100% that it is at least Class B (Positive).
Using a cut plane equal to 0.8, the pessimistic or more exigent ELECTRE TRI outranking pro-cedure works as follows:
• First it has classified perception of the coordinator CO8 into Class A (Very Positive influ-ence), since CO8’s credibility degree is greater than the cut plane=0.8 and therefore is associated to the assertive “the influence of the course is at least Very Positive”;
• In a second step it has classified in Class B (positive influence) all the other coordinators perceptions with a credibility degree associated to the assertive “the influence of the course is at least Positive”. So the perceptions of CO1, CO2, CO3, CO4, CO5, CO7, CO9 were classified in Class B (positive influence);
Figure 2– How the coordinators evaluated the influence of the course.
Figure 3 illustrates how profile values (λ) equal to 0.8, 0.7 and 0.6 cut the credibility degrees.
Figure 3– Classification of the coordinators’ perceptions.
To a credibility profile (λ) equal to 0.6 all the coordinators had a credibility degree associated to the assertive “the influence of the course is at least Positive” (Class B). While to a credibility profile (λ) equal to 0.8 and 0.7 all the coordinators had a credibility degree associated to the assertive “the influence of the course is at least neutral” (Class C).
3.6 Using the ELECTRE TRI for Classifying the Course: Professors’ Perceptions
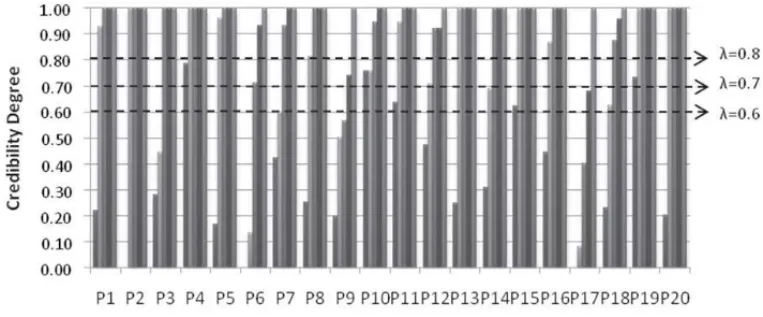
Figure 4– How the professors evaluated the influence of the course.
Using a cut plane equal to 0.8 and the pessimistic or more exigent ELECTRE TRI outranking procedure we can highlight:
• There isn’t any professor with a credibility degree into Class A (Very Positive influence).
• P1, P2, P4, P5, P8, P11, P13, P15, P16, P19, P20 are the professors which showed a cred-ibility degree associated to the assertive “the influence of the course is at least Positive”. They classified the course’s influence in Class B (positive influence).
• P3, P7, P10, P12, P14, P18 are the professors which showed a credibility degree associated to the assertive “the influence of the course is at least Neutral”. They classified the course’s influence in Class C (neutral influence).
• P6 is the professor which showed a credibility degree associated to the assertive “the in-fluence of the course is at least Negative”. He classified the course’s inin-fluence in Class D (negative influence).
• P9 and P17 are the professors which showed credibility degree associated to the assertive “the influence of the course is at least Very Negative”. They classified the course’s influ-ence in Class E (very negative influinflu-ence).
Figure 5 illustrates how profile values (λ) equal to 0.8, 0.7 and 0.6 cut the credibility degrees.
Figure 5– Classification of the professors’ perceptions.
3.7 Using the ELECTRE TRI for Classifying the Course: Students’ Perceptions
Figure 6 show the credibility degree assigned to students perceptions. The values in this figure inform the degree in which each student agrees with the affirmation that the influence of the course is not inferior to the boundary limit of the each. Figure 6 also presents how a credibility profile (λ) equal to 0.8, 0.7 and 0.6 cuts the graph.
Figure 6– How the students evaluated the influence of the course.
Using cut plane equal to 0.8 and the pessimistic or more exigent ELECTRE TRI outranking procedure we can highlight:
• In a second step it has classified in Class B (positive influence), all the other students perceptions, with a credibility degree associated to the assertive “the influence of the course is at least Positive”, is greater than 0.8. So the perceptions from S3, S4, S5, S6, S7, S8, S9, S10, S11, S12, S13, S14, S15, S17, S18, S19, S20, S21 were classified in Class B (positive influence).
• In a third and last step it has classified in Class C (neutral influence) the perceptions from students S2 and S16, which had a credibility degree associated to the assertive “the influ-ence of the course is at least Neutral”, is greater than 0.8.
Figure 7 illustrates how profile values (λ) equal to 0.8, 0.7 and 0.6 cut the credibility degrees.
Figure 7– Classification of the students’ perceptions.
To a credibility profile (λ) equal to 0.6, 95% of the students had a credibility degree associated to the assertive “the influence of the course is at least Positive” (Class B). While to a credibility profile (λ) equal to 0.8 and 0.7, 91% had a credibility degree associated to the assertive “the influence of the course is at least very Positive” (Class B).
3.8 Using the ELECTRE TRI for Classifying the Course: Chiefs’ Perceptions
Figure 8 shows the credibility degree assigned to chiefs perceptions. The values in this figure inform the degree in which each chief agrees with the affirmation that the influence of the course is not inferior to the boundary limit of the each. Figure 8 also presents how a credibility profile (λ) equal to 0.8, 0.7 and 0.6 cuts the graph.
Using cut plane equal to 0.8 and the pessimistic or more exigent ELECTRE TRI outranking procedure we can highlight that only “Chief 4” had a credibility degree associated to the assertive “the influence of the course is at least Positive” (Class A). The other chiefs had a credibility degree associated to the assertive “the influence of the course is at least Positive” (Class B).
Figure 8– How the chiefs evaluated the influence of the course.
Figure 9– Classification of the chiefs’ perceptions.
3.9 Sensibility Analysis
An overall sensibility analysis was developed for all the groups’ results taking into consideration the following values for the cut level degree: 0.6, 0.7 and 0.8. Table 13 shows the results which were obtained adopting this strategy. As one can note in this table, the main changes on results occur in coordinators categorization while relaxing the cut level from 0.8, to 0.6, which has generated a changing on the major evaluations from Class B to Class A. Another important change on the results occurs for the chiefs categorization while relaxing the cut level from 0.8 to 0.7, which also have a change on the major evaluations from Class B to Class A.
4 CONCLUSION
Table 13– How the classification results are sensible to the cut levelλ.
λ=0.8 λ=0.7 λ=0.6
Class (%) Class (%) Class (%)
A B C D E A B C D E A B C D E
Coordinators 11.11 77.78 11.11 0 0 3.33 55.56 11.11 0 0 55.56 44.44 0 0 0 Professors 0 55 30 5 10 15 50 25 5 5 25 55 10 10 0 Students 4.76 85.71 9.52 0 0 14.29 76.19 9.52 0 0 33.33 61.91 4.76 0 0
Chiefs 25 75 0 0 0 50 50 0 0 0 50 50 0 0 0
The approach was able to shows how the classifications spread among five classes of influence: Very Positive, Positive, Neutral, Negative or Very Negative. The criteria set used in the modeling is based on a deep literature review and was validated by a set of specialists. The low incidence of “N” responses (4.4 %) and the response rates of all groups (Table 6) indicate the suitability of the questionnaire.
As a whole, the results showed a positive influence of the course over the Professional Skills and behavior of its alumni. It is interesting to note that the most conservative or pessimistic classifi-cation is linked to the professors’ perceptions. Most of them (11 professors) have classified the course as Class B, adopting a cut level of 0.8.
It was observed that the G1 group (Coordinators) have perceptions about the influence of the course that differs from the Professors’ perceptions (G2). Although these differences should be because the members of G1 are in geographic areas different from the location of the members of G2, it should be interesting to promote a discussion about the objective of the course, among the professors and the coordinator, before starting new editions of the course.
It is not usual in literature that reports ELECTRE modeling, the inclusion about the influence of modeling parameters in the results. This paper presents a discussion about the influence of the cut-levelλin the results. This sensibility analysis allowed observing variations on the main results, caused by relaxingλfrom 0.8 to 0.7, 0.8 to 0.6 and 0.7 to 0.6.
Furthermore, other interesting contributions of this paper are:
• It shows how the ELECTRE TRI works on an original visual way, through of the Figures 2, 4, 6 and 8. This feature turns easy to interpret and analyze the sensibility of the results are sensible to the cut level;
• It shows an application of ELECTRE TRI to perceptions of different groups formed by multiple evaluators. However, the frequency analysis implemented in this work enables one free end result of compensatory effects, which could happen, for example, by using the average or mode as input data in the application of ELECTRE TRI.
It becomes difficult to perform a direct comparison between the results obtained in this study and others, including the work of Neves (2005) and Politis & Siskos (2004), because the set of criteria used, the methodology, as well as the body of research participants and the context of application are different. Nevertheless we highlight that this paper extends the works of Neves (2005) and Politis & Siskos (2004), by reviewing the criteria set and applying the modeling for a new situation.
As directions for future research, we suggest a comparison between the results presented here and those one should get by the applying other sorting methods such as PROMETHEE TRI, PROMSORT, ELECTRE TRI-C, ELECTRE TRI-nC or CPP-TRI.
The relevance of this work is enhanced by the novelty of the subject explored. It proposes a modeling to address the problem of classification the impact of the Professional Master’s Degree on the performance of its alumni, considering perceptions of different stakeholders of a course of this kind.
ACKNOWLEDGMENTS
This research has been partially sponsored by Brazilian Coordination for Improving Higher Education Personal (CAPES) and Brazilian Council for Scientific and Technological Develop-ment (CNPq).
REFERENCES
[1] ALMEIDA-DIASJ, FIGUEIRAJR & ROYB. 2010. ELECTRE TRI-C: A multiple criteria sorting method based on characteristic reference actions.European Journal of Operational Research,204: 565–580.
[2] ALMEIDA-DIASJ, FIGUEIRAJR & ROYB. 2012. A multiple criteria sorting method where each category is characterized by several reference actions: The ELECTRE TRI-nC method.European Journal of Operational Research,217(3): 567–579.
[3] ARAZ C & OZKARAHANI. 2005. A Multicriteria Sorting Procedure for Financial Classification Problems: The Case of Business Failure Risk Assessment.Lecture Notes in Computer Science,3578: 563–570.
[4] ARAZC & OZKARAHANI. 2007. Supplier evaluation and management system for strategic sourcing based on a new multicriteria sorting procedure.Int. J. Production Economics,106: 585–606.
[6] BRANSJP, MARESCHALB & VINCKEPH. 1986. How to select and how to rank projects: The PROMETHEE method.European Journal of Operational Research,24(2): 228–238.
[7] B ¨UYUK¨ OZKAN¨ G, RUAND & FEYZIOGLUO. 2007. Evaluating e-Learning Web site quality in a fuzzy environment.International Journal of Intelligent Systems,22: 567–586.
[8] CELIKM, KANDAKOGLUA & ERID. 2009. Structuring fuzzy integrated multi-stages evaluation model on academic personnel recruitment in MET institutions.Expert Systems with Applications,36: 6918–6927.
[9] CHAORJ & CHENYH. 2009. Evaluation of the criteria and effectiveness of distance e-learning with consistent fuzzy preference relations.Expert Systems with Applications,36: 10657–10662.
[10] CHENJK & CHENIS. 2010. Using a novel conjunctive MCDM approach based on DEMATEL, fuzzy ANP, and TOPSIS as an innovation support system for Taiwanese higher education.Expert Systems with Applications,37: 1981–1990.
[11] COSTAHG. 2006.Aux´ılio Multicrit´erio `A Decis ˜ao – M´etodo AHP. Rio de Janeiro: Abepro.
[12] COSTA HG. 2014. Graphical interpretation of outranking principles: avoiding misinterpretation results from ELECTRE I.Journal of Modelling in Management. (In Press 2014)
[13] COSTAHG & CORREAˆ PDS. 2010. Construction of an AHP-Based Model to Catch Criteria Weights In Post-Occupancy Evaluation.International Journal of the Analytic Hierarchy Process,2: 30–43.
[14] COSTAHG, MANSURAFU, FREITASALP & CARVALHORA. 2007. ELECTRE TRI aplicado a avaliac¸˜ao da satisfac¸˜ao de consumidores.Produc¸˜ao,17: 230–245.
[15] FIGUEIRAJ, SMETY & BRANSJ-P. 2004. MCDA methods for sorting and clustering problems: Promethee TRI and Promethee CLUSTER.Working Paper 2004/02, Universit´e Libre de Bruxelles, Service de Math´ematiques de la Gestion.
[16] FISHBURNPC. 1970.Utility theory for decision making. Wiley, New York.
[17] GIANNOULISC & ISHIZAKAA. 2010. A Web-based decision support system with ELECTRE III for a personalised ranking of British universities.Decision Support Systems,48: 488–497.
[18] GINEVICIUSR & GINEVICIENEVB. 2009. The compliance of master’s degree studies with the economic needs of the country.Technological and Economic Development of Economy,15: 136– 153.
[19] HERNANDEZW, BONACHEJ, COUSIDOC, PALMEROJ, LABRADORM & ALVAREZ-VELLISCO A. 2010. Statistical analysis of academic results before and after four years of Bologna.International Journal of Engineering Education,26: 1493–1502.
[20] HO W, HIGSONHE, DEY PK, XUX & BAHSOONR. 2009. Measuring performance of virtual learning environment system in higher education.Quality Assurance in Education,17: 6–29.
[21] HONCC, GUHYY, WANGKM & LEEES. 1996. Fuzzy multiple attributes and multiple hierarchical decision making.Computers and Mathematics with Applications,32: 109–119.
[22] KEENEYRL & RAIFFAH. 1976.Decisions with multiple objectives: preferences and value trade-offs. John Willey & Sons, New York.
[23] LIKERTRA. 1932. Technique for measurement of attitudes.Archives of Psychology,140: 5–55.
[25] M ´EXASMP, QUELHASOLG, COSTAHG. 2012. Prioritization criteria for enterprise resource plan-ning systems selection for civil construction companies: A multicriteria approach.Canadian Journal of Civil Engineering,39(8): 855–866.
[26] MILLERGA. 1954. The Magical Number Seven, Plus or Minus Two: Some Limits on Our Capacity for Processing Information.Psychological Review,101: 343–352.
[27] MOUSSEAUV, SLOWINSKIR & ZIELNIEWICZP. 2000. A user-oriented implementation of the ELECTRE-TRI method integrating preference elicitation support. Computers & Operations Re-search,27: 757–777.
[28] NEVESRB. 2005.Integrac¸˜ao da an´alise SWOT com o m´etodo electre tri na avaliac¸˜ao do desempenho de programas de p´os-graduac¸˜ao. Engenharia de Produc¸˜ao. Niter´oi, Brasil, Universidade Federal Fluminense.
[29] P ´EREZ-MART´INEZJE, GARCIA´ J, MUNOZ´ I & SIERRA-ALONSOA. 2010. Active learning and generic competences in an operating systems course.International Journal of Engineering Education,
26(9).
[30] POLITISY & SISKOSY. 2004. Multicriteria methodology for the evaluation of a Greek engineering department.European Journal of Operational Research,156: 223–240.
[31] ROYB. 1968.Classement et choix en pr´esence de points de vue multiples (la m´ethode ELECTRE), Lausanne Presses Polytechiniques et Universitaires Romandes.
[32] ROYB. 1978. ELECTRE III: Un alghoritme de m´ethode de classements fonde sur une representation floue des pr´ef´erences em pr´esence de crit´eres multiples.Cahieres de CERO,20: 3–24.
[33] ROYB. 1990. Decision-aid and decision-making.European Journal of Operational Research,45: 324–331.
[34] ROYB & BERTIERPM. 1971. La m´ethode ELECTRE II: Une m´ethode de classement en pr´esence de crit´eres multiples. IN SCIENTIFIQUE, D. Ed. Paris, SEMA (Metra International).
[35] ROYB & HUGONNARDJC. 1981. Classement des prolongements de lignes de stations en banlieu parisienne. IN LAMSADE. Ed.Cahiers du LAMSADE. Paris, Universit´e Dauphine et RATP.
[36] ROYB & SKALKAJM. 1985. ELECTRE IS: Asp´ects methodologiques et guide d´utilization. IN LAMSADE. Ed.Cahier du LAMSADE. Paris, Universit´e de Paris-Dauphine.
[37] SAATYTL. 1977. A scaling method for priorities in hierarchical structures.Journal of Mathematical Psychology,15(3): 234–281.
[38] SAATYTL. 1996.Decision Making with Dependence and Feedback: The Analytic Network Process. Pittsburgh, Pennsylvania: RWS Publications.
[39] SANT’ANNAAP, COSTAHG & PEREIRAV. 2014. CPP-TRI: A Sorting Method Based on the Prob-abilistic Composition of Preferences.International Journal of Information and Decision Sciences. (In Press 2014).