Title:
Reversed horizontal cyclic loading tests of flat slab
specimens with studs as shear reinforcement
Running head:
Experimental study
Author 1 (corresponding author):Brisid Isufi Ph.D. Student
Department of Civil Engineering, Faculty of Science and Technology, Universidade NOVA de Lisboa, Caparica, Portugal
Full contact details of corresponding author: Name: Brisid Isufi
Address: Universidade NOVA de Lisboa, Faculty of Science and Technology, Department of Civil Engineering, Quinta da Torre, Campus Universitário, 2829-516 Caparica, Portugal; Telephone: +351 932285562; email: [email protected]
Author 2:
António Manuel Pinho Ramos Assistant Professor
CERIS, ICIST, Department of Civil Engineering, Faculty of Science and Technology, Universidade NOVA de Lisboa, Caparica, Portugal
Author 3:
Válter José da Guia Lúcio Associate Professor
CERIS, Department of Civil Engineering, Faculty of Science and Technology, Universidade NOVA de Lisboa, Caparica, Portugal
Synopsis
The results of a series of experiments on four reinforced concrete flat slab specimens with shear studs and a control specimen without any shear reinforcement are presented. The specimens were tested under constant gravity loads and reversed horizontal cyclic displacements. The main test variables were the applied gravity load and the number of perimeters of studs. One of the specimens was tested in two phases to study the post-earthquake behaviour. Results showed a considerable improvement of the deformation capacity of specimens with studs compared to the reference specimen. In agreement with previous research, increasing the applied gravity shear ratio resulted in a lower experimental drift capacity. It is shown that a better explanation of the observed ultimate drifts can be made by considering also the flexural capacity and the extent of shear reinforcement. The specimen tested in two phases exhibited considerable residual capacity, even after severe horizontal loading.
Notations
Asw – area of shear reinforcement in a perimeter around the column
Ed – area within the hysteresis curve
Es – elastic strain energy
V0 – concentric punching shear resistance for a slab without shear reinforcement
V0,col – shear resistance at the face of the column
V0c,s – shear resistance within the shear – reinforced zone
V0,out – shear resistance outside the shear – reinforced zone
Vflex – shear force in the slab – column connection for which flexural failure of the slab occurs
Vg – gravity shear force in the slab – column connection
d – average effective depth of top reinforcement dr,u – ultimate drift ratio
fc – concrete cylinder strength
fc,cube – concrete cube strength
fct,sp – concrete tensile splitting strength
fy – longitudinal steel yield stress
fyw – shear reinforcement steel yield stress
k – factor accounting for size effect
sr – spacing of the studs in the radial direction
u – control perimeter
uout – nonreduced outer perimeter for shear – reinforced slabs
uout,ef – outer perimeter for the calculation of punching shear strength outside the shear –
reinforced zone based on Eurocode 2
εy – steel yield strain
ρw – shear reinforcement ratio
ξeq – equivalent viscous damping coefficient
ζ – proposed factor that account for the influence of GSR, GFR and the extent of shear
reinforcement on the drift capacity
GFR – Gravity Flexure Ratio GSR – Gravity Shear Ratio
1 Introduction
Shear studs are generally considered an effective mean of providing punching shear resistance in flat slabs. Their enhanced behaviour compared to other types of shear reinforcement is commonly attributed to good anchorage at both ends of the stud (Ghali & Youakim, 2005). Furthermore, the usage of shear studs in buildings is encouraged by their contribution to construction speed. They are often used in practice as ready-made proprietary products which can be placed on site after positioning the slab’s longitudinal reinforcement. In this study, the shear studs are made of reinforcing steel bars welded to rectangular steel heads.
The efficiency of shear studs in the enhancement of the punching shear strength has been investigated by several experimental concentric monotonic loading experiments such as those summarized in (Ferreira, et al., 2014) and more recent ones such as (Lips, et al., 2012) and (Hegger, et al., 2017). The experimental campaigns support the claim that significant enhancement in the punching shear capacity is achieved by introducing shear studs.
Although scarcer, horizontal cyclic loading tests of slabs with such reinforcement can also be found in the literature. For instance, (Cao, 1993), (Robertson, et al., 2002), (Brown, 2003), (Tan & Teng, 2005), (Broms, 2007), (Kang & Wallace, 2008), (Cheng, et al., 2010), (Park, et al., 2012) and (Matzke, et al., 2015) have tested headed studs or stud rail shear reinforcement in interior slab-column connections under reversed horizontal cyclic loading. Tests on exterior connections are reported in (Megally & Ghali, 2000). It should be noted, however, that cyclic loading tests of flat slabs with this type of shear reinforcement have considerable differences between them, due to the various types of products, methods of fabrication, varying material characteristics, diameters of studs, layout of reinforcement and test setups.
In this experimental campaign, the specimens were subjected to constant gravity loads and reversed horizontal cyclic displacements. The studs were arranged in a cruciform layout to avoid interference with the longitudinal reinforcement. Since Eurocode 2 (EC2 (CEN, 2004)) proposes a reduction of the perimeter where shear stresses should be checked to determine
the extent of shear reinforcement when the cruciform layout is used, all specimens have the same outermost perimeter. The purpose is to study the effect of the gravity load and the extent of shear reinforced zone in the behaviour of slab – column connections with studs under combined gravity and horizontal actions.
2 Experimental campaign
2.1 Description of the specimens
Horizontal cyclic loading tests of five flat slab specimens are described in this paper. The specimens are named C-Ref, C-SSR3, C-SSR5a, C-SSR5b and C-SSR5c. The names describe the type of loading (C – cyclic), type of shear reinforcement (SSR – shear stud reinforcement) followed by the number of rows of studs. Specimens with the same number of perimeters of studs are distinguished by small Latin letters. These three specimens differ by the concrete strength and the applied vertical load, as it will be described later.
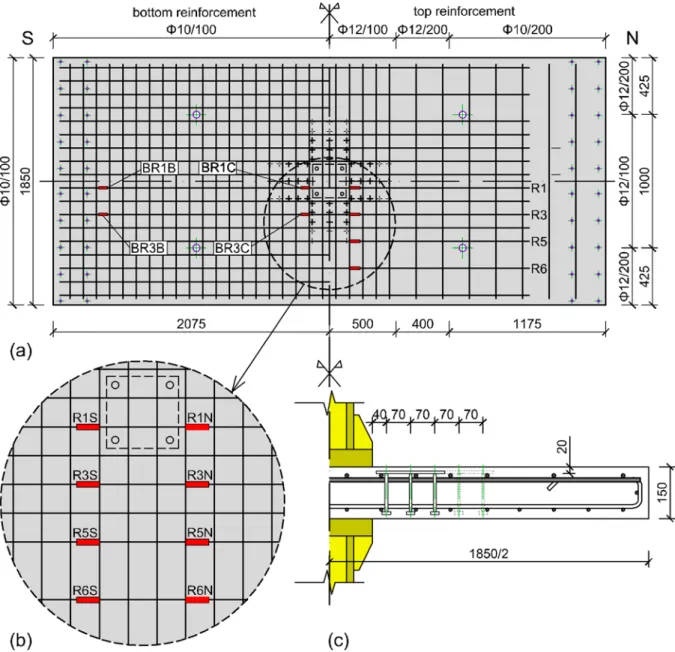
The specimens represented a 2/3 scale model of the column and the area bounded by the mid-span lines in the horizontal load direction (longitudinal direction of the specimen) and by lines parallel to the longitudinal direction located at a distance equal to 22% of the span length in the transversal direction of the specimen. The specimens had overall dimensions 4.15 m × 1.85 m, thickness equal to 150 mm and a 2.0 m steel column (1.0 m above and below the slab) with a rigid square base plate with cross section dimensions equal to 250 mm.
All five specimens had the same detailing of longitudinal reinforcement. The top reinforcement consisted of Φ12 mm bars spaced at 100 mm in the vicinity of the column and Φ12 mm and Φ10 mm bars spaced at 200 mm outside the column region. Reinforcing bars parallel to the longest direction were placed on top of the bars in the shortest direction. The bottom reinforcement consisted of Φ10 mm bars with a uniform spacing of 100 mm. The nominal concrete cover for the top and bottom longitudinal bars was 20 mm. However, before casting, the effective depth of the top bars was measured, and the average values are summarized in Table 1, along with the values of the longitudinal reinforcement ratio, ρl. Detailing of the top
Greek uppercase Phi: Φ Greek lowercase rho:
ρ
and bottom bars is given in Fig. 1. The longitudinal reinforcement and instrumentation used was similar to that of the slab specimens without shear reinforcement described in (Almeida, et al., 2016).
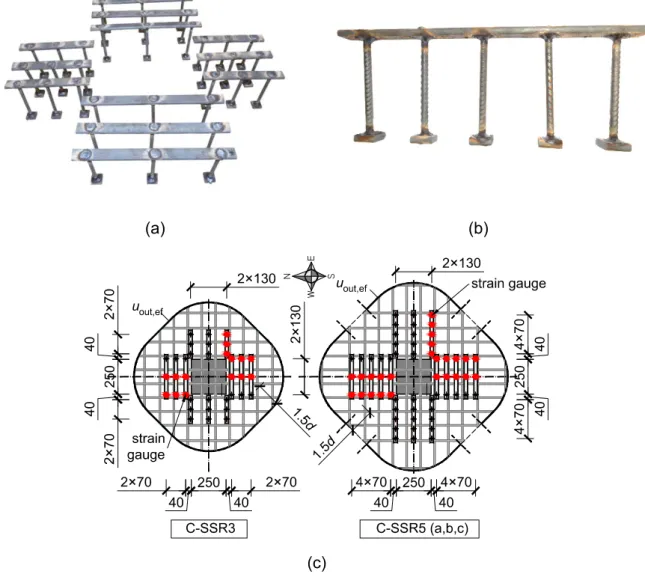
Shear reinforcement consisted of reinforcing steel bars welded into rectangular 25×8 mm steel bars (Fig. 2-a, b). The top bar ensures support on the longitudinal reinforcement bars. The bottom rectangular bars are cut to create a square stud head with side dimension equal to 25 mm. The dimension of the head was chosen to have approximately three times the diameter of the stud, in accordance with the recommendations of fib Model Code 2010 (Fédération Internationale du Béton (fib), 2013) for anchorage that leads to development of the full yield capacity of the stud. The spacing of the studs in the radial direction, sr, was 70 mm
for all the specimens with shear reinforcement. The shear reinforcement ratio, ρw, calculated
as Asw / (u sr) was 0.35%, where Asw is the area of studs in a perimeter around the column and
u is the control perimeter at a distance 2d from the face of the column in accordance with EC2
(CEN, 2004). The layout and the instrumentation of the shear reinforcement is presented in Fig. 2-c. In this figure, the outer punching perimeter uout,ef based on EC2 (CEN, 2004) is shown.
Due to the restrictions imposed by EC2 regarding the control perimeter for the cruciform layout of shear reinforcement, the value of uout,ef is equal to 3211 mm and applies to all specimens
with shear reinforcement.
2.2 Test setup and loading protocol
Test setups found in literature for horizontal cyclic loading of flat slab-column connections usually employ pinned or movable supports for the negative bending moment portion of the slab and pinned support for the column. In these setups, horizontal cyclic loading is applied at column ends (or at one column end) or at slab ends. Such test setups have been commonly accepted and used as good and simple representatives of slab-column connections. However, they use simplified boundary conditions, such as borders that are free of bending moments and vertically fixed, which lead to a static position of the zero-moment line and the inability to have bending moment redistribution (Ramos, et al., 2017). To overcome some of these
limitations, a different test setup has been developed at Department of Civil Engineering, Faculty of Sciences and Technology, Universidade NOVA de Lisboa (DEC/FCT/UNL) (Almeida, et al., 2016), (Ramos, et al., 2017). This setup allows vertical displacements at the slab borders; equal magnitude of shear forces, bending moments and rotations at the slab borders; mobility of the line of inflection location along the longitudinal direction and the possibility of applying high vertical load ratios. Therefore, the specimens tested in this test setup have both negative and positive bending moment regions and they represent the portion of the flat slab from mid-span to mid-span in the horizontal force direction. Two sub-assemblies of steel profiles are used for the test setup to enforce the boundary conditions, as shown in the idealized scheme of Fig. 3-a. The outer profiles in Fig. 3-b are represented in Fig. 3-a by the sub-assembly denoted as (1). This sub-assembly ensures equal displacements at the opposite slab borders. The sub-assembly denoted in Fig. 3-a as (2) ensures equal rotation at the opposite slab borders. The horizontal strut is equipped with a hydraulic actuator and a load cell to monitor the positive bending moments in the specimen. In the photo shown in Fig. 3-b, the steel profiles of this sub-assembly are the inner ones and are located underneath the specimen. The vertical load is applied by four hydraulic jacks that distribute their load on eight uniformly distributed locations on the upper surface (Fig. 5). The sub-assembly used for this purpose is denoted as (3) in Fig. 3-a. A more detailed description of this test setup can be found in (Almeida, et al., 2016).
After reaching the target value, the vertical load is kept constant during the rest of the test. The total vertical load applied Vg (including self-weight and the weight of the equipment) for
each specimen is given in Table 1. This table also contains the shear resistance V0 calculated
in accordance with EC2 (CEN, 2004) using average values for material characteristics and concentric loading without the contribution of the shear reinforcement, as follows:
f
u d k V l c 3 / 1 0 0.18 100
(1)where ρl is the longitudinal reinforcement ratio calculated as the geometric mean of
taken to be equal to the average strength as determined by tests, d is the effective depth of the top longitudinal reinforcement, calculated as the average value of the effective depths for each direction, u is the control perimeter, taken in accordance with EC2 (CEN, 2004) at a
distance 2d from the face of the column and
1
200
2
.
0
d
k
is a factor accounting for sizeeffect.
The ratio Vg/V0, known as Gravity Shear Ratio (GSR), has been recognized as a major factor
in the ultimate drift capacity of flat slab specimens with and without shear reinforcement ( (Pan & Moehle, 1989), (Luo & Durrani, 1995), (Hueste, et al., 2007), (ACI Committee 318, 2014), (Ramos, et al., 2017)). All specimens had approximately the same GSR around 55%, except for C-SSR5c in which a higher GSR was applied (Table 1).
After the application of the gravity load, horizontal cyclic displacements are applied at the upper end of the column, following the protocol depicted in Fig. 4. The total height of the column is 2000 mm, therefore the horizontal drift ratios are obtained by dividing the horizontal displacement by the column height (values for drift ratio are plotted in the right Y-axis in Fig. 4). For drift ratios smaller than 4%, the cycles for each target drift are repeated three times, in order to observe the strength and stiffness deterioration during successive cycles. Two repetitions are performed for 4% drift ratio. For higher drifts, only one cycle per target drift is completed. Target drifts are increased in steps of 0.5% until failure of the specimen.
For all specimens except C-SSR5b, the displacement history of Fig. 4 was followed until failure. For C-SSR5b, a two-phase cyclic loading history was followed. In the first phase, the full gravity load was applied and then reversed horizontal cyclic drifts were imposed until a 3.0% drift ratio (only half a cycle, for positive drifts only). Afterwards, the slab was unloaded. In the second phase, the gravity load was applied with the same GSR and the horizontal loading protocol was restarted from zero drifts until failure of the specimen. This loading history for specimen C-SSR5b simulates a scenario in which the building experiences a major earthquake event (such that 3% drifts are imposed on the slab-column connection) but the connections successfully carry the gravity loads without punching failure. The specimen is
reloaded to observe the strength and stiffness of the damaged specimen and to observe the behaviour for drifts larger than those corresponding to the major seismic event.
2.3 Materials
The mean value of the compressive strength of concrete cubes (fc,cube) was determined as the
average of the compressive strength of six cubes with side dimensions equal to 150 mm. The cylinder compressive strength (fc) was determined based on the compressive strength test of
five cylinders with diameters of 150 mm and heights of 300 mm. Five cylinders were also used to determine the tensile splitting strength of concrete (fct,sp). The concrete characteristics
determined from tests are summarized in Table 2. The tests were carried out on the same day as the respective slab. The age of the slab specimens and concrete cubes and cylinders is shown in the second column.
The yield stress of the shear reinforcement (fyw) measured by tensile tests is shown in Table
3, along with the yield stress of the longitudinal bars (fy) and the corresponding yield strain (εy).
2.4 Instrumentation
Strain gauges were installed in 15 studs of specimen C-SSR3 and in 25 studs of each of the specimens with five rows of studs, as indicated in Fig. 2-c. Four bars of the top longitudinal reinforcement were also fitted with strain gauges in two symmetric locations near the column (Fig. 1). Strain gauges were also installed in two bottom bars at locations close to the column and in the positive bending moment region (Fig. 1).
Fourteen displacement transducers were installed along the longitudinal axis of the slab and four others in the transversal direction to monitor the vertical deflections of the slab, in the locations indicated in Fig. 5.
The eight points of gravity (vertical) load application are also shown in Fig. 5. These points are connected by four spreader beams above the slab (Fig. 3). The applied gravity load is monitored throughout the test using four load cells, one for each spreader beam. The positive
Greek lowercase epsilon:
ε
bending moments at the slab borders are also monitored by load cells located at the struts of the test setup that ensure equal rotation at the slab borders.
Inclinometers are used to monitor the rotations at specimen borders and to indicate when it is necessary to slightly adjust the force in the test setup strut elements to maintain equal rotations at opposite borders. This adjustment normally leads to an increase of the positive bending moments applied. The actuator is equipped with a load cell and a displacement transducer to monitor and record the horizontal force and displacement during the application of horizontal drifts.
3 Test results and discussion
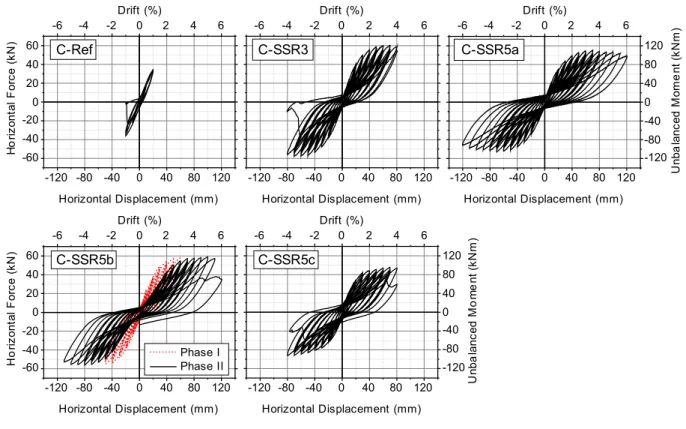
3.1 C-Ref
The application of the gravity load was associated with the appearance of flexural cracks in both negative (approximately 0.2 mm wide) and positive (about 0.1 mm wide) bending moment regions. Cracks developed further, and their width gradually increased during the application of horizontal drifts. New flexural cracks became visible at 0.5% drift ratio at distances further away from the column’s face. Narrow radial cracks were visible, originating from the corners of the column. At the first two 1.0% drift cycles, the cracks developed further, and their width gradually increased. By the end of the second cycle of 1.0% drifts, signs of the initiation of a punching failure were present. Relative shear displacement of concrete cover was observed at distances 100 mm to 200 mm from the faces of the column and the radial cracks increased in number and width, reaching up to 0.3 mm wide at the sides of the specimen and wider closer to the column. A brittle punching failure occurred in the third cycle at 1% drift ratio.
Saw-cut of specimen C-Ref (Fig. 6 - a) reveals a typical punching failure, with a diagonal crack inclined at approximately 40°-45° from the horizontal and originating from the bottom face of the slab around the column. It was observed that the vertical relative displacement between the failure cone and the rest of the slab was larger than the relative displacement in the other
specimens (see Fig. 6 - a). This is explained by the smaller failure cone compared to the other specimens, which engages fewer longitudinal bars and the limitation of cracks within the shear reinforced zone due to the studs. The top reinforcement bars shattered the concrete cover around the column, which resulted in rubble all over the affected area.
3.2 C-SSR3
Flexural cracks were observed in the top face of the slab near the column after the application of the full gravity load. Small radial cracks appeared in the top face of the slab in the column region for 0.5% drift ratio. The cracks continued to develop further for larger drifts. At 2.0% drift ratio, minor flexural cracks started to appear at positive bending moment regions, whereas the cracks on the top face were opened considerably. At 3% drift ratio, a tangential crack appeared at approximately 50-60 mm away from the column face and the connection reached its maximum unbalanced moment capacity. At 3.5% drift, more radial cracks propagated; however, the hysteretic behaviour remained stable without significant strength degradation. Stable behaviour was also observed in the first cycle of 4.0% drift ratio, but a sudden punching failure occurred during the second cycle, leading to an immediate reduction of the horizontal load.
The saw-cut of the specimen (Fig. 6 - a) reveals that punching occurred outside the shear reinforced zone. Spalling of concrete cover was observed in the lower part of the slab and the inclined cracks initiated exactly at the lower part of the studs of the outer shear reinforcement perimeter. Above the top reinforcement, the angle to the horizontal was decreased and the failure region was extended up to a radius ranging approximately between 650 mm to 750 mm from the axis of the column, due to concrete cover spalling.
From the saw-cut it can also be observed that almost vertical bending cracks were developed near the column face. The area bounded by shear studs was not excessively cracked, and damage was more pronounced between the column region and the first stud and outside the third and last stud. A relatively outstretched and slightly non-symmetrical crack is observed from the saw-cut. The inclination of the crack from the horizon is 35° – 41°.
3.3 C-SSR5a
Flexural cracks were observed in the upper face of the slab near the column after the application of the full gravity load. Flexural cracks aligned transversally to the slab developed starting from 0.5% drift ratio and gradually increased throughout the test. Cracking was increased at a slow pace with the increase of horizontal drifts. Most of the damage was concentrated in vicinity of the column face. The specimen reached a horizontal drift ratio of 6.0% with a gradual degradation of the horizontal load and without visible punching failure. The test ended after completing a full cycle at 6.0% drift due to limitations of the test setup. Signs of the initiation of a punching failure are visible in the saw-cut (Fig. 6 - a). However, as described above, a brittle punching failure did not occur. Besides the cracks visible from the top face, interior cracks with various angles to the horizontal can be seen in the saw-cut. One of the cracks passed almost horizontally through the bottom concrete cover of the shear reinforcement. Another smaller, barely visible, crack propagated from the bottom part of the first shear stud and stretched diagonally to the top surface, passing through the shear studs of the second perimeter up to near the top part of the studs of the third perimeter. Finally, two larger cracks found their way through the region bounded by the column and the first shear stud. One of the cracks was almost vertical, the other was at an angle of about 75°.
3.4 C-SSR5b
Small negative and positive bending moment cracks were observed during the application of the gravity load. For the first horizontal cycles, new cracks developed, and the openings of the existing cracks further increased. At 1.0% drift, there were three visible cracks on each side of the column, on the top face, and small radial cracks. Cracking continued to extend, starting from 1.5% drift, where radial cracks became visible and the crack next to the face of the column opened considerably. After the completion of the first 3.0% drift, the slab was cracked along the entire length (in positive and negative bending moment regions). Damage was observed in the bottom face of the slab near the column but there were no signs indicating the initiation of a punching failure. This marked the end of the first phase.
No major developments were observed at up to 3.0% drifts when the loading protocol was restarted from zero in the second cyclic loading phase. Before restarting the horizontal loading protocol, cracking was already extensive. The crack widths measured at the border of the specimen were 0.7 mm on the top face near the column region and relatively small at the positive bending moment region. Only few new cracks were observed and widening of existing cracks was gradual and slow up to 3.0% drifts. At around 1.5% drift ratio, the cracks of the negative and positive bending moment regions could be seen to meet. At 2.5%, the radial cracks developed significantly. When seen from the sides of the specimen, they reached the mid-thickness of the slab. Maximum crack openings became larger than 1.0 mm. Once the specimen reached the drift at which the test was stopped in the previous phase (i.e., 3.0%), damage started to increase at a higher rate. At 3.0% the crack widths on the top face were around 1.4 mm, with a distinct wide crack about 120 mm from the face of the column on the west side, that reached an opening of 2.5 mm. Cracking continued to develop all over the specimen. At 3.5 - 4.5%, the bottom part of the slab was severely damaged. The bottom part of the column punched through the slab a few millimetres and continued to punch progressively with the increase of the drifts, until a one-sided punching failure occurred on the north side of the specimen, outside the shear reinforced zone. The specimen had successfully sustained a complete 5.5% drift cycle but reached the 6.0% drift level only after it punched mid-way (at around 90 mm horizontal displacement).
Specimen C-SSR5b was not forced to complete the full cycle after the one-sided punching failure, therefore a single sided failure can be observed in the saw-cut of Fig. 6 - a. However, this offers some insight regarding the situation just prior to punching failure. The saw-cut reveals that prior to the development of the inclined crack marking the punching failure, there were already significant cracks passing from the bottom part of the slab near the column to the first row of studs, and other cracks with varying inclination and passing through the studs of the second and third row at angles from 80° to 20°. Generally symmetrical cracks were observed on the punched side, but with a slightly smaller width and length. The crack was inclined at circa 25° from the horizontal.
3.5 C-SSR5c
The effects of the increased gravity load in C-SSR5c were visually detectable in comparison to the other specimens. At the end of the application of the full gravity load, flexural cracks in negative and positive bending moment regions were present, as well as radial cracks. The negative bending moment cracks were larger than the other types, reaching values up to 0.2 mm at the sides of the specimen and being larger (but not measured) near the column. The cracks were spaced at around 150 – 200 mm. Small new radial cracks started to develop at 0.5% drifts. At the sides of the specimen, the negative moment cracks reached two thirds of the height of slab. At 1.0% drift, positive moment cracks extended up to about 500 mm from the northern and southern border. The width of the radial cracks reached 0.2 mm, whereas the width of the crack near the column’s perimeter on the top face reached 0.6 mm. With increased drifts, cracks continued to develop in number and width. At 1.5% drift, visible damage appeared near the column perimeter at the bottom face. At 2.0%, cracks developed along the entire specimen, that is the negative and positive regions were all cracked. Negative moment cracks remained wider than the other types throughout the entire test. At 3.0% drifts, the damage extended further. The crack widths reached 1.6 mm and were further opened to 2.0 mm before failure. The upper and lower parts of the slab were severely damaged at 4.0 % drift and signs of the initiation of a punching failure were present. After the successful completion of a 4.0% drift cycle, a one-sided punching failure occurred on the northern side when the specimen was reaching the positive 4.0% drift cycle. The specimen was then forced to complete the cycle and the punching failure developed on the other side as well when attempting to reach the -4.0% drift ratio.
The saw cut of specimen C-SSR5c (Fig. 6 - a) revealed a relatively steep angle of the inclined crack, and a significant variation in the angle towards the horizontal along the thickness of the slab. In this specimen, the vertical cracks near the column face reached the bottom face of the slab. The crack pattern between the studs was similar to that observed in the other specimens, although the region between the second and the third row of studs was not
affected by visible cracks. However, a crack that has started to propagate from the bottom head of the fourth stud and extended approximately 20 mm towards the top head of the fifth stud was present in this saw-cut. A similar crack was observed in specimen C-SSR5b, but not in the other specimen with 5 rows of studs.
An additional saw-cut in the transversal direction of specimen C-SSR5c was performed to get a clearer view about the type of failure for this specimen and the other specimens that failed outside the shear-reinforced zone. The transversal saw-cut (Fig. 6 - b) revealed that it was indeed a punching failure. It was found through the transversal cut (E-W direction) that damage inside the slab thickness is more pronounced in this direction. This is explained by the large flexural moment acting on the section.
3.6 Load – deformation responses
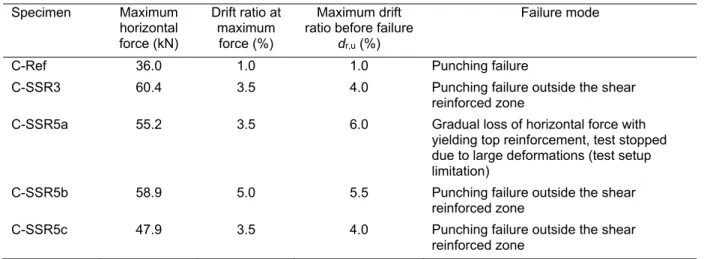
Hysteretic diagrams, showing the horizontal force – displacement (unbalanced moment – drift ratio) relationships, are given in Fig. 7. Based on the geometry and conditions of the test setup, the unbalanced moment and the drift ratios are directly obtained by respectively multiplying the horizontal force and dividing the horizontal displacement by the total height of the column. The hysteretic diagram of specimen C-Ref is very similar to that of the specimen C-50 reported in Almeida et al (Almeida, et al., 2016) and tested using the same test setup. From the figure, it is noticed that the hysteresis diagrams were stable for all specimens. The specimen that did not fail in punching (C-SSR5a, Fig. 7) suffered a gradual loss of horizontal load up to about 18.3% of the peak value. In the other specimens, the punching failure was associated with a sudden and significant (more than 20%) drop of the horizontal load. The gradual degradation of specimen C-SSR5a is considered as a failure for the purposes of this paper, since it is reasonably close to a 20% drop in the horizontal load.
All specimens, except C-Ref, reached an almost horizontal plateau in the load–deformation response at around 3.0% drift ratio, with a maximum horizontal force at around 3.5% drift due to yielding of the top reinforcement. The applied gravity load influenced the maximum
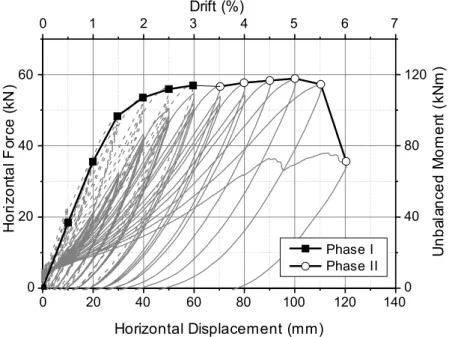
horizontal force. For instance, the enveloping curve of specimen C-SSR5c is considerably lower than the other curves, due to the higher Gravity Shear Ratio applied to this specimen. For specimen C-SSR5b, the different phases of loading did not significantly influence the enveloping load – deformation response. The maximum horizontal force (unbalanced moment) reached by specimen C-SSR5b is close to the values corresponding to the other specimens with shear reinforcement and with approximately the same GSR. The backbone curve constructed by joining the maximum horizontal forces at the first cycle in each drift ratio level of the loading protocol shows a smooth transition between the different phases of loading (Fig. 8).
A summary of the maximum horizontal force and drifts as well as the failure modes for each specimen is contained in Table 4. It is noticed that the maximum horizontal force was reached at drift ratio 3.5% for all specimens except Ref which failed at a lower drift and specimen C-SSR5b that followed a different loading history. For specimen C-C-SSR5b, the restart of the protocol after reaching 3.0% drift postponed the deformation for which the maximum horizontal force was attained, but it did not impair the ability of the specimen to reach a maximum force comparable to that of the other specimens.
To compare the energy dissipation capacity of the specimens and to observe the effect of repeated cyclic loading in the specimens, an equivalent viscous damping coefficient ξeq was
calculated for each complete cycle. The procedure outlined in (Hose & Seible, 1999) was followed, according to which:
1 2 1 2 1 4 d d eq S S E E ξ π E E (2)
where Ed1 and Ed2 are the areas within the hysteresis curve for positive and negative
displacements, whereas ES1 and ES2 are the elastic strain energies for positive and negative
displacements respectively, as described in Fig. 9.
The coefficients ξeq are plotted in Fig. 10-a for complete cycles (i.e., excluding the cycle in
which failure occurred) as a function of the drift ratio for all specimens except C-SSR5b. For
Greek lowercase Xi:
ξ
the two test phases of specimen C-SSR5b, the results are shown separately in Fig. 10-b for clarity. To increase readability, the values are shown in the figure slightly scattered around the fixed drift levels of the loading history. The size of the markers in Fig. 10 represents the cycle: the first cycle has the largest marker.
Fig. 10 shows that specimen C-SSR5c had the highest values of ξeq. It should be noted that
this specimen had higher gravity loads than the other specimens, leading to significant nonlinearity even for low horizontal drift ratios. Repetition of the cycles at a previously experienced drift ratio leads to a decrease of the ξeq, due to stiffness deterioration. For the first
cycles in each drift level, damping appears to have a minimum value at around 2.0 - 2.5% drift ratio, which corresponds to the last phases of loading before approaching a horizontal plateau in the global unbalanced moment – drift relationship. After that point, the values tend to increase, except for specimen C-SSR5c. Fig. 10 also shows that the first cycles up to 1.0% drift have a higher equivalent viscous damping coefficient due to the significant damage in the specimen and, therefore, the low elastic strain energy (Eq. (2)).
3.7 Deflections
Slab deflections at the first cycles for each drift level in the horizontal loading history are shown in Fig. 11 and Fig. 12 for the longitudinal direction (N-S), based on the measurements obtained from the displacement transducers. The figures show that the deflections of the slab increase with the growth of the horizontal drifts due to stiffness degradation caused by the cyclic unbalanced moments, even though the vertical load is kept constant. The figures also show that the test setup worked as intended, thus imposing equal deflections at slab borders (i.e. at the simulated mid-spans).
As expected, the deflections at the beginning of the reversed cycles are proportional to the gravity load acting on the slab. The figures reveal that the gravity load also significantly influences the increase of deflections during cyclic loading. For example, the deflections in specimen C-SSR5a (Fig. 11) at 6.0% drift are comparable to deflections in specimen C-SSR3 (Fig. 11) at around 4.0% drift or to deflections in specimen C-SSR5b (Fig. 12) at around 3.0%
drift. These three specimens had almost the same GSR but significantly different values of the applied gravity load Vg (Table 1) due to the differences in concrete strength. As a result, the
initial bending moments due to gravity loads are also different and the deflections are therefore different, being both higher for higher gravity loads. This means that GSR alone cannot properly describe the degradation of the slab under reversed cyclic loading, because it does not consider the fact that the bending moments in the slab can vary considerably for a fixed value of GSR depending on the concrete strength, since the slab´s flexural capacity is less sensitive to changes on concrete strength than the punching capacity. This is further discussed in Section 4.1.
The deflections for the two phases of loading of the specimen C-SSR5b are shown in the same plot in Fig. 12, in which it can be noticed that in the second phase the registered vertical deformations are higher when comparing similar stages, because after the first testing phase the slab was already heavily cracked. Starting from 3.0% drifts, the deflections were considerably large when compared to the other specimens with similar GSR.
The deflection plots also indicate that the specimens have both negative and positive bending moment regions in the longitudinal direction. Furthermore, the inflection point that marks the transition from negative to positive bending moments is not fixed throughout the test. This is clearly shown in Fig. 13, in which the location of the inflection points is shown as a function of time for specimens C-SSR5a and C-SSR5b. For the other specimens, the results were similar. At the end of the gravity loading phase, the inflection lines were located around the theoretical value: 22% of the span (Fig. 13). During the reversed cyclic loading phase, the location of the inflection line shifted back and forth, with generally higher ranges for higher drifts. The inflection line reaches the column for specimens that experience large drifts (i.e., all specimens except C-Ref). This means that there are positive bending moments near the column, and that the moments due to the horizontal actions have become larger than those from gravity loading. Compared to C-SSR5b, sign reversal occurred earlier in C-SSR5a due to the lower gravity load (Fig. 13). For the same reason, there was a smaller shift of the inflection point with the increase of horizontal drifts in specimen C-SSR5a. The position of the inflection line is shown
for both phases of the test of specimen C-SSR5b by adapting the time axis so that the horizontal drifts for both phases match. The figure shows that at the beginning of the second phase, the inflection line was closer to the column compared to the beginning of the first cyclic loading phase due to degradation.
3.8 Strains in the reinforcement
Top reinforcement strains at peak points of the loading history (Fig. 4) are shown in Fig. 14, for only one loading direction. The direction is shown with an arrow near the column in each figure. For clarity in the figure, only the results for the first excursion to the denoted drift ratio are presented. During the tests, some strain gauges stopped reading correctly due to the heavily cracked specimen, especially after yielding of reinforcing bars. For this reason, some of the graphs lack certain data points. The yield strain considered is represented by a horizontal dashed line. Many strain gauges malfunctioned during the unloading phase at the end of Phase I for specimen C-SSR5b. Therefore, the results for that specimen are presented in Fig. 14 only for Phase I.
The top reinforcement strain graphs show that the first bars to reach yielding are those that pass through the column (R1 bars). The drift ratios for which these reinforcing bars yield is related to the magnitude of the gravity load. For instance, in specimen C-SSR5c with the highest gravity load, the strain at the end of the application of the full gravity load was very close to the yield strain (Fig. 14). For specimens that sustained high drift ratios (i.e. for specimens with shear reinforcement), reinforcing bars further away from the column reached their yielding strain for higher drift ratios. In specimen C-Ref, reinforcing bars R1 and R3 yielded at 1.0% drift ratio and the bars R5 and R6 never yielded due to the premature punching failure. By 2.0% drift ratio, all the instrumented top reinforcement bars had yielded for all the specimens with shear reinforcement, except C-SSR5a, thus indicating that the ultimate negative bending moment capacity of the entire section of the specimen was reached. The postponed yielding of the longitudinal bars in specimen C-SSR5a can be explained by the relatively low value of Vg (Table 1).
The strain gauge locations for the bottom reinforcement are shown in Fig. 1. The notations used in the figure for the strain gauges near the column are BR1C and BR3C for the first and third bottom bar respectively. For the strain gauges near the borders of the specimen (i.e. near the simulated mid-span) the notations BR1B and BR3B respectively are used. Yielding of the bottom instrumented bars at the borders (i.e., at the simulated mid-span) occurred only in specimen C-SSR5c, in both instrumented reinforcing bars (BR1B and BR3B) just prior to failure of the specimen (at 4.0% drift). In every case, bottom reinforcing bars near the column reached higher strains for smaller drifts compared to the bottom bars near the borders (mid-span). In all specimens except for C-Ref, yielding strains were reached at the bottom bar passing through the column (BR1C). In specimen C-SSR5c, yielding was extended to the other instrumented bar (BR3C).
For the specimens with shear reinforcement, the strains in the instrumented studs are shown in Fig. 15 to Fig. 18. It is noticed that the studs in the second perimeter around the column have the highest strains among the studs in the longitudinal (N-S) direction for all the specimens, regardless of the total number of perimeters of shear reinforcement (i.e. 3 or 5). Studs along the E-W direction (orthogonal direction to the horizontal loading) do not follow this pattern for specimens with 5 perimeters of studs. For specimens C-SSR5a and C-SSR5b (first phase of loading), it is observed that the studs in the fifth perimeter (the farthest away from the column) have very low strains. Even for high drift ratios, the strains in these studs are less than 0.05%. The other specimen with five perimeters of studs (C-SSR5c) also has low strains in the studs of the fifth perimeter, but these strains are notably higher compared to the other two specimens.
Yielding of the studs was limited to a few studs and for relatively large drift ratios. In specimen C-SSR3, no studs yielded. However, the studs in the second perimeter were very close to yielding in the last cycle (Fig. 15). In specimen C-SSR5a, yielding started initially on the studs along the E-W (transversal) direction at around 4.5% drifts and was extended to the studs in the N-S (longitudinal) direction for drift ratio 5.5% (Fig. 16). At the last cycle (6.0%), yielding
had been reached by three consecutive studs in the N-S direction near the column along the centreline.
Similar to the strain gauges on the longitudinal reinforcement, many strain gauges on the shear studs malfunctioned during the unloading phase at the end of Phase I for specimen C-SSR5b. Therefore, the results presented in Fig. 17 are only for Phase I. In that specimen, only the first stud along the E-W direction reached yielding. However, since the specimen reached very high drift ratios (5.5%) on Phase II, it is probable that yielding occurred in other studs as well, such as those in the second perimeter along the centreline in the N-S direction, which were already at strains larger than 0.2% at 3.0% horizontal drift ratio (Phase I).
Yielding was not detected by the readings of the strain gauges in specimen C-SSR5c (Fig. 18). Due to the larger gravity load, the specimen reached a maximum drift ratio smaller than the other specimens with 5 stud layers, and for that reason shear stud yielding was not detected. This is in accordance with the results from specimen C-SSR3, which attained the same maximum drift ratio, and where yielding of the instrumented shear studs was also not observed.
3.9 Summary of failure modes
In this section, a summary of failure modes based on the observations during the test, the saw-cuts and the strain gauge measurements is provided. It is concluded that the specimen C-Ref failed in punching prior to full yielding of top reinforcement. In C-SSR3, punching failure was outside the shear reinforced zone after yielding of top reinforcement. Specimen C-SSR5a did not fail in a brittle manner, but suffered gradual loss of horizontal force, with yielding of flexural reinforcement and signs of the initiation of a punching failure between the face of the column and the first row of studs. Specimens C-SSR5b and C-SSR5c failed in punching outside the shear reinforced zone, after yielding of top reinforcement.
4 Comparison with results from the literature
4.1 Gravity load
Results from 15 tests from 6 experimental campaigns found in the literature are compared with the results of the specimens with shear reinforcement in the present study. The specimens considered are interior slab – column subassemblies with square column cross section, reinforced with shear studs and tested under a combination of gravity loads and uniaxial reversed horizontal displacements. The ultimate drift dr,u is considered to be the
maximum attained drift before a punching failure or before a drop of the unbalanced moment below 80% of the maximum value. For each specimen, GSR is calculated as described for the specimens in the present study (see Section 2.2). The ratio between the applied gravity load
Vg and the load Vflex for which flexural failure of the specimen occurs is named Gravity Flexure
Ratio (GFR) herein. Vflex is calculated as the slab’s reaction on the column when the total
gravity load has a value such that a plastic flexural mechanism is formed. For each specimen,
Vflex is estimated using simplified yield line mechanisms depending on the corresponding test
setup conditions. Fig. 19 shows the relationship between the ultimate drifts and GSR and GFR separately. A linear trendline and the corresponding R-squared statistics are used to describe the relationships.
Fig. 19 indicates that there is a trend of decreasing the ultimate drift ratio with the increase of GSR. A similar trend can be observed for the GFR. This is an indicator that both factors should be considered in a model to predict the ultimate drift.
Three of the specimens presented in this paper (C-SSR3, C-SSR5a and C-SSR5b) have similar GSR, but different GFR, resulting in different ultimate drift ratios, proving the ultimate drift ratio is not only a function of GSR. Due to differences in the concrete strength of the specimens (see Table 2), the predicted punching shear resistance is significantly different. Therefore, the applied gravity load varies considerably between the specimens when GSR is kept constant. On the other hand, the flexural strength is less depended on the concrete strength, and the flexural resistance of the specimens is therefore not very different. Hence, a
combination of the influences from both GSR and GFR would be more appropriate for the description of the observed behaviour of the specimens presented in this study.
4.2 Combined influence of gravity load and the extent of shear
reinforcement
In the design of shear reinforced flat slabs for punching in EC2 (CEN, 2004), it is required to check the shear resistance in at least three perimeters around the column, located: a) at the face of the column V0,col; b) at a distance 2d away from the face of the column, V0c,s and c)
outside the shear reinforced zone V0,out. For the four specimens with shear reinforcement
described in this paper, the resistances in the three considered perimeters are summarized in Table 5, which shows that the outer perimeter is the most critical one for all specimens. Indeed, except for C-SSR5a, all specimens failed outside the shear reinforced zone. However, there is no apparent relationship between V0,out and dr,u (Table 5). For example, C-SSR5a has the
lowest resistance but sustained the highest drift ratio. It should be noted that V0,out in Table 5
is calculated using the same value of uout,ef for all specimens (Fig. 2-c). However, the results
of the present experimental campaign indicate that drift capacity can be enhanced by increasing the number of perimeters of studs beyond the number of perimeters for which EC2 (CEN, 2004) does not recommend further increase of uout,ef. In Table 5, the value of Vflex is
also given for reference.
To reflect this enhancement of the drift capacity as a function of the extent of shear reinforcement and the simultaneous influence of GSR and GFR (discussed in the previous section), a unitless factor ζ is proposed, as follows:
2
, ,
0
g out ef out ef
flex out out
V u u
GSR GFR
V V u u
(3)
where uout is the nonreduced outer perimeter, obtained by enclosing the effective outer
perimeter uout,ef with straight lines if it consists of separated sections.
Greek lowercase zeta:
ζ
The relationship between ζ and the ultimate drift for the specimens with studs from the current study and from literature is given in Fig. 20. It is noticed that ζ describes reasonably well the relationship between the ultimate drift ratio and the gravity load, punching shear capacity, flexural resistance and extent of shear reinforcement for the specimens in this experimental campaign and for the specimens found in literature. Compared to the relationships presented in Fig. 19, using the factor ζ results in a slightly smaller absolute maximum difference from the linear trendline (1.2%, compared to 1.7% for GSR and 1.3% for GFR) but comparable values of R2. In Fig. 20, the four points marking the specimens of the present study have clearly
distinct values of ζ and a noticeable trend of reducing the ultimate drift with the increase of ζ. All the specimens included in Fig. 20 reached a nearly horizontal plateau in the unbalanced moment – drift enveloping curve. For this reason, the factor ζ is not checked for flat slabs that fail in punching prior to developing the full unbalanced moment transfer capacity. It should also be noted that most of the GFR values (Fig. 19) correspond to slabs that are over-dimensioned for flexure under gravity loading and the validity of the trend described in Fig. 20 is not checked for ζ > 0.35. Also, a lower limit of the ratio uout,ef/uout beyond which the drift
capacity is no longer enhanced cannot be determined with the currently available experimental data.
Finally, it should be noted that Fig. 19 and Fig. 20 were derived based on relatively thin specimens (including the specimens of the presented experimental campaign). Research has shown that size effects can play an important role in punching shear capacity of flat slabs. For this reason and for the reasons discussed above, more experimental research on shear reinforced flat slabs under reversed horizontal cyclic is necessary to validate whether the proposed factor ζ relates to the ultimate drift capacity of flat slab – column connections outside the presented limitations.
5 Conclusions
Horizontal cyclic loading tests of five RC flat slab specimens were described in this paper. Four of the specimens were reinforced with studs serving as punching shear reinforcement. The tests showed that stud shear reinforcement is effective in enhancing the drift capacity of flat slab – column connections subjected to cyclic loading. Drift ratios ranging from 4% to 6% were experienced by the specimens with shear reinforcement, whereas the reference specimen (with no shear reinforcement) failed at only 1% drift.
In one of the specimens, a two-phase-loading protocol was followed to investigate the behaviour of the flat slab with studs after experiencing a major earthquake event. It was observed that, reloading of the specimen up to the endpoint of the first phase was characterized by a significantly degraded stiffness. However, the ultimate drift capacity of the specimen was not significantly impaired. The specimen reached high drift ratios, with a behaviour comparable to that of the other specimens for drifts larger than those experienced in the first phase.
The relationship between the GSR and the ultimate drift has been acknowledged in the literature. However, it was shown that a better explanation of the ultimate drifts for the specimens presented in this paper can be made by taking into consideration also the flexural strength and the extent of shear reinforcement. A unitless factor incorporating the abovementioned factors is proposed and it is shown to be in good agreement with the results from cyclic loading tests found in the literature.
Acknowledgements
The first author benefited from a scholarship under the Grant Agreement 2014-0848/001-001-Erasmus Mundus Action 2-Partnerships.
References
ACI Committee 318, 2014. Building Code Requirements for Structural Concrete (ACI 318-14)
and Commentary on Building Code Requirements for Structural Concrete (ACI 318R-14).
Farmington Hills, MI, USA: American Concrete Institute.
Almeida, A. F. O., Inácio, M. M., Lúcio, V. J. & Pinho Ramos, A., 2016. Punching behaviour of RC flat slabs under reversed horizontal cyclic loading. Engineering Structures, 117(June), p. 204–219.
Broms, C. E., 2007. Flat Plates in Seismic Areas: Comparison of Shear Reinforcement Systems. ACI Structural Journal, 104(6, November-December), pp. 712-721.
Brown, S. J., 2003. Seismic Response of Slab Column Connections. PhD Thesis.. Calgary, Alberta, Canada: University of Calgary.
Cao, H., 1993. Seismic Design of Slab-Column Connections. Master thesis.. Calgary, Alberta, Canada: University of Calgary.
CEN, 2004. EN 1992-1-1. Eurocode 2: Design of concrete structures – Part 1–1: general rules
and rules for buildings. s.l.:CEN.
Cheng, M.-Y., Parra-Montesinos, G. J. & Shield, C. K., 2010. Shear Strength and Drift Capacity of Fiber-Reinforced Concrete Slab-Column Connections Subjected to Biaxial Displacements. ASCE Journal of Structural Engineering, 136(9), pp. 1078-1088.
Fédération Internationale du Béton (fib), 2013. fib Model Code for Concrete Structures 2010. s.l.:Ernst & Sohn.
Ferreira, M. P., Melo, G. S., Regan, P. E. & Vollum, R. L., 2014. Punching of Reinforced Concrete Flat Slabs with Double-Headed Shear Reinforcement. ACI Structural Journal, 111(2), pp. 363-374.
Ghali, A. & Youakim, S. A., 2005. Headed Studs in Concrete: State of the Art. ACI Structural
Journal, 102(5), pp. 657-667.
Hegger, J., Sherif, A. . G., Kueres, D. & Siburg, C., 2017. Efficiency of Various Punching Shear Reinforcement Systems for Flat Slabs. ACI Structural Journal, 114(3), pp. 631-642.
Hose, Y. D. & Seible, F., 1999. Performance Evaluation Database for Concrete Bridge
Components and Systems under Simulated Seismic Loads. PEER 1999/11, Berkeley,
California, USA: Pacific Earthquake Engineering Research Center. College of Engineering. University of California.
Hueste, M. B. D., Browning, J., Lepage, A. & Wallace, J. W., 2007. Seismic Design Criteria for Slab-Column Connections. ACI Structural Journal, 104(4, July-August), pp. 448-458.
Kang, T. H.-K. & Wallace, J. W., 2008. Seismic Performance of Reinforced Concrete Slab-Column Connections with Thin Plate Stirrups. ACI Structural Journal, 105(5, September-October), pp. 617-625.
Lips, S., Ruiz, M. F. & Muttoni, A., 2012. Experimental Investigation on Punching Strength and Deformation Capacity of Shear-Reinforced Slabs. ACI Structural Journal, 109(6), pp. 889-900.
Luo, Y. H. & Durrani, A. J., 1995. Equivalent Beam Model for Flat-Slab Buildings-Part I: Interior Connections. ACI Structural Journal, 92(1), pp. 115-124.
Matzke, E. M., Lequesne, R. D., Parra-Montesinos, G. J. & Shield, C. K., 2015. Behavior of Biaxially Loaded Slab-Column Connections with Shear Studs. ACI Structural Journal, 112(3, May-June), pp. 335-346.
Megally, S. & Ghali, A., 2000. Seismic Behavior of Edge Column-Slab Connections with Stud Shear Reinforcement. ACI Structural Journal, 97(1), pp. 53-60.
Pan, A. & Moehle, J. P., 1989. Lateral Displacement Ductility of Reinforced Concrete Flat Plates. ACI Structural Journal, 86(3, May-June), pp. 250-258.
Park, H.-G., Kim, Y.-N., Song, J.-G. & Kang, S.-M., 2012. Lattice Shear Reinforcement for Enhancement of Slab-Column Connections. Journal of Structural Engineering ASCE, 138(3, March), pp. 425-437.
Ramos, A. et al., 2017. Punching of flat slabs under reversed horizontal cyclic loading.
SP-315 ACI/fib International Symposium on Punching Shear in Structural Concrete Slabs: Honoring Neil M. Hawkins, Volume 315, pp. 253-272.
Robertson, I. N., Kawai, T., Lee, J. & Enomoto, B., 2002. Cyclic Testing of Slab-Column Connections with Shear Reinforcement. ACI Structural Journal, 99(5, Sept.-Oct.), pp. 605-613.
Tan, Y. & Teng, S., 2005. Interior Slab-Rectangular Column Connections Under Biaxial Lateral Loadings. In: SP-232 Punching Shear in Reinforced Concrete Slabs,. Farmington Hills, Michigan, USA: American Concrete Institute, pp. 147-174.
TABLES
Table 1 Description of the specimens
specimen d (mm) ρl (%) V0 (kN) Vg (kN) GSR (%) C-Ref 118.1 0.96 412.8 224.8 54.5 C-SSR3 117.9 0.96 358.7 196.4 54.7 C-SSR5a 117.5 0.96 310.3 169.2 54.5 C-SSR5b 117.1 0.97 397.9 213.9 53.8 C-SSR5c 118.1 0.96 429.0 275.0 64.1
Table 2 Concrete characteristics
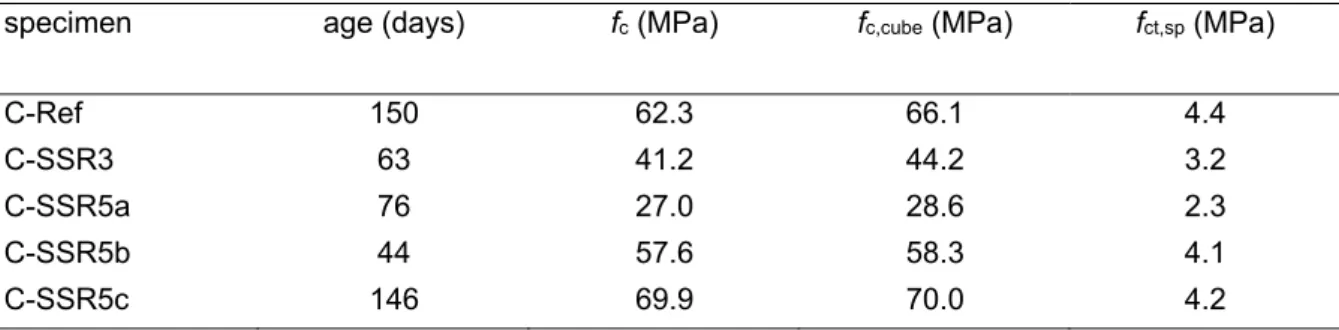
specimen age (days) fc (MPa) fc,cube (MPa) fct,sp (MPa)
C-Ref 150 62.3 66.1 4.4
C-SSR3 63 41.2 44.2 3.2
C-SSR5a 76 27.0 28.6 2.3
C-SSR5b 44 57.6 58.3 4.1
C-SSR5c 146 69.9 70.0 4.2
Table 3 Reinforcement characteristics
specimen fy (MPa) εy (%) Φ8* Φ10 Φ12 Φ10 Φ12 fyw (MPa) εy (%) C-Ref 549.5 541.9 0.27 0.27 - - C-SSR3 523.9 544.9 0.26 0.27 485.0 0.24 C-SSR5a 523.9 544.9 0.26 0.27 485.0 0.24 C-SSR5b 549.5 541.9 0.27 0.27 488.8 0.24 C-SSR5c 549.5 541.9 0.27 0.27 488.8 0.24 * shear studs
Table 4 Force, drifts and failure modes Specimen Maximum horizontal force (kN) Drift ratio at maximum force (%) Maximum drift ratio before failure
dr,u (%)
Failure mode
C-Ref 36.0 1.0 1.0 Punching failure
C-SSR3 60.4 3.5 4.0 Punching failure outside the shear reinforced zone
C-SSR5a 55.2 3.5 6.0 Gradual loss of horizontal force with yielding top reinforcement, test stopped due to large deformations (test setup limitation)
C-SSR5b 58.9 5.0 5.5 Punching failure outside the shear reinforced zone
C-SSR5c 47.9 3.5 4.0 Punching failure outside the shear reinforced zone
Table 5 Concentric flexural and EC2 punching shear resistance considering the shear reinforcement
specimen Vg (kN) Vflex (kN) V0,col (kN) V0c,s (kN) V0,out (kN) dr,u (%)
C-SSR3 196.4 446.8 1217.1 695.1 464.5 4.0
C-SSR5a 169.2 435.2 849.0 657.1 402.5 6.0
C-SSR5b 213.9 448.7 1557.3 721.1 517.0 5.5
FIGURE CAPTIONS
Fig. 1. Reinforcement details and instrumentation (dimensions in millimetres): (a) Plan view; (b) Strain gauges in top reinforcement. (c) Transversal section.
Fig. 2. Shear studs: (a) The complete set of studs for specimen C-SSR3; (b) A stud rail along the longitudinal (N-S) direction for specimens with 5 rows of studs; (c) Layout and instrumentation
Fig. 3. Test setup: (a) Schematic representation; (b) Photo of the setup and the specimen Fig. 4. Horizontal displacements history
Fig. 5. Displacement transducers and points of application of the gravity loads
Fig. 6. Saw-cuts of the specimens: (a) Longitudinal direction; (b) Two-directional saw-cut of specimen C-SSR5c (photographed at the corner of the cut specimen, distorted due to perspective)
Fig. 7. Hysteretic diagrams
Fig. 8. Transition between the two cyclic loading phases for specimen C-SSR5b, positive displacements
Fig. 9. Definition of quantities needed for the calculation of the equivalent viscous damping coefficient ξeq
Fig. 10. Equivalent viscous damping coefficient (largest marker represents the first cycle). (a) Specimens C-Ref, CSSR3, C-SSR5a and C-SSR5c. (b) Specimen C-SSR5b (-I First phase, -II Second phase).
Fig. 11. Deflections at first cycle of each drift level for specimens C-Ref, C-SSR3, C-SSR5a and C-SSR5c
Fig. 12. Deflections at first cycle of each drift level for the two phases of cyclic loading of C-SSR5b
Fig. 13. Location of the inflection point throughout the test of specimens SSR5a and C-SSR5b
Fig. 14. Top reinforcement strains at the first cycle of each drift level Fig. 15. Strains in shear reinforcement, specimen C-SSR3
Fig. 16. Strains in shear reinforcement, specimen C-SSR5a
Fig. 17. Strains in shear reinforcement, specimen C-SSR5b, first phase Fig. 18. Strains in shear reinforcement, specimen C-SSR5c
Fig. 19. Ultimate drift ratio as a function of Gravity Shear Ratio (GSR) and Gravity Flexure Ratio (GFR)
FIGURES ASSOCIATED WITH CAPTIONS
Fig. 1. Reinforcement details and instrumentation (dimensions in millimetres): (a) Plan view; (b) Strain gauges in top reinforcement. (c) Transversal section.
(a) (b)
(c)
Fig. 2. Shear studs: (a) The complete set of studs for specimen C-SSR3; (b) A stud rail along the longitudinal (N-S) direction for specimens with 5 rows of studs; (c) Layout and
(a) (b)
Fig. 3. Test setup: (a) Schematic representation; (b) Photo of the setup and the specimen
cyclic loading specimen EA>> column EA > > EI >> EI>> EI>> EA >> EI > >
* hydraulic actuator and load cell ** pinned to the column
(1) (2) (1) (2) (3) (3) EI>> (**) (*) (*) (*)
Fig. 4. Horizontal displacements history -140 -120 -100 -80 -60 -40 -20 0 20 40 60 80 100 120 140 -7.0% -6.0% -5.0% -4.0% -3.0% -2.0% -1.0% 0.0% 1.0% 2.0% 3.0% 4.0% 5.0% 6.0% 7.0% Dr ift r at io ( % ) H or iz on tal di sp la ce me nt ( m m ) Time
(a)
(b)
Fig. 6. Saw-cuts of the specimens: (a) Longitudinal direction; (b) Two-directional saw-cut of specimen C-SSR5c (photographed at the corner of the cut specimen, distorted due to
Fig. 7. Hysteretic diagrams Horizontal Displacement (mm) -120 -80 -40 0 40 80 120 -60 -40 -20 0 20 40 60 -6 -4 -2 0 2 4 6 Drift (%) H o riz on ta lF or ce (k N ) C-Ref Horizontal Displacement (mm) -120 -80 -40 0 40 80 120 -6 -4 -2 0 2 4 6 Drift (%) C-SSR3 -120 -80 -40 0 40 80 120 -6 -4 -2 0 2 4 6 -120 -80 -40 0 40 80 120 Drift (%) U nba lanc ed M om e nt (k N m ) Horizontal Displacement (mm) C-SSR5a Drift (%) -120 -80 -40 0 40 80 120 -60 -40 -20 0 20 40 60 -6 -4 -2 0 2 4 6 Phase I Phase II H o riz on ta lF or ce (k N ) Horizontal Displacement (mm) C-SSR5b () -120 -80 -40 0 40 80 120 -6 -4 -2 0 2 4 6 -120 -80 -40 0 40 80 120 Drift (%) U nba lanc ed M o m e nt kN m Horizontal Displacement (mm) C-SSR5c
Fig. 8. Transition between the two cyclic loading phases for specimen C-SSR5b, positive displacements 0 20 40 60 80 100 120 140 0 20 40 60 0 1 2 3 4 5 6 7 0 40 80 120 Phase I Phase II Drift (%) U n b al an ce d M o m e nt (kN m ) H o ri zo nt al F orc e (k N ) Horizontal Displacement (mm)
Fig. 9. Definition of quantities needed for the calculation of the equivalent viscous damping coefficient ξeq
(a)
(b)
Fig. 10. Equivalent viscous damping coefficient (largest marker represents the first cycle). (a) Specimens C-Ref, CSSR3, C-SSR5a and C-SSR5c. (b) Specimen C-SSR5b (-I First phase,
-II Second phase).
0 1 2 3 4 5 6 7 0 2 4 6 8 10 12 14 C-Ref C-SSR3 C-SSR5a C-SSR5c Eq u iv a le n tv is c ou sd a mp in g ra tio eq (% ) Drift (%) 0 1 2 3 4 5 6 7 0 2 4 6 8 10 12 14 C-SSR5b-I C-SSR5b-II Eq u iv a le n tv is c ou sd a mp in g ra tio eq (% ) Drift (%)
Fig. 11. Deflections at first cycle of each drift level for specimens C-Ref, C-SSR3, C-SSR5a and C-SSR5c S N -2.0 -1.5 -1.0 -0.5 0.0 0.5 1.0 1.5 2.0 -45 -40 -35 -30 -25 -20 -15 -10 -5 0 5 Ve rti ca lD is plac em e n t( m m ) 0.0% 0.5% 1.0% S N -2.0 -1.5 -1.0 -0.5 0.0 0.5 1.0 1.5 2.0 0.0% 0.5% 1.0% 1.5% 2.0% 2.5% 3.0% 3.5% 4.0% (m) S N -2.0 -1.5 -1.0 -0.5 0.0 0.5 1.0 1.5 2.0 -45 -40 -35 -30 -25 -20 -15 -10 -5 0 5 0.0% 0.5% 1.0% 1.5% 2.0% 2.5% 3.0% 3.5% 4.0% 4.5% 5.0% 5.5% 6.0% Ve rti ca lD is p lac em e nt( m m ) S N -2.0 -1.5 -1.0 -0.5 0.0 0.5 1.0 1.5 2.0 (m) 0.0% 0.5% 1.5% 1.0% 2.0% 2.5% 3.0% 3.5% 4.0% C-Ref C-SSR3 C-SSR5a C-SSR5c
Fig. 12. Deflections at first cycle of each drift level for the two phases of cyclic loading of C-SSR5b S N 0.0% (II) 0.5% (II) 1.0% (II) 1.5% (II) 2.0% (II) 2.5% (II) 3.0% (II) 3.5% (II) 4.0% (II) 4.5% (II) 5.0% (II) 5.5% (II) 6.0% (II) -2.0 -1.5 -1.0 -0.5 0.0 0.5 1.0 1.5 2.0 -55 -50 -45 -40 -35 -30 -25 -20 -15 -10 -5 0 5 V er tic alD is pl ac em e nt (m m ) (m) 0.0% (I) 0.5% (I) 1.0% (I) 1.5% (I) 2.0% (I) 2.5% (I) 3.0% (I)
Fig. 13. Location of the inflection point throughout the test of specimens SSR5a and C-SSR5b
Fig. 14. Top reinforcement strains at the first cycle of each drift level R1S R3S R5S R6S (m) St ra in ( % ) S N W E 0,05 -0.10 -0.05 0.00 0.05 0.10 0.15 0.20 0.25 0.30 0.35 0.40 0.45 0.50 0.55 0.600.0 0.1 0.2 0.3 0.4 0.5 0.6 0.7 0.8 0.9 0.0% -0.5% -1.0% (m) St ra in ( % ) W E S N 0,05 R1N R3N R5N R6N -0.10 -0.05 0.00 0.05 0.10 0.15 0.20 0.25 0.30 0.35 0.40 0.45 0.50 0.55 0.600.0 0.1 0.2 0.3 0.4 0.5 0.6 0.7 0.8 0.9 0.0% 0.5% 1.0% 1.5% 2.0% (m) St ra in ( % ) W E S N 0,05 R1N R3N R5N R6N -0.10 -0.05 0.00 0.05 0.10 0.15 0.20 0.25 0.30 0.35 0.40 0.45 0.50 0.55 0.600.0 0.1 0.2 0.3 0.4 0.5 0.6 0.7 0.8 0.9 4.5% 5.0% 5.5% 6.0% 0.0% 0.5% 1.0% 1.5% 2.0% 2.5% 3.0% 3.5% 4.0% -0.10 -0.05 0.00 0.05 0.10 0.15 0.20 0.25 0.30 0.35 0.40 0.45 0.50 0.55 0.600.0 0.1 0.2 0.3 0.4 0.5 0.6 0.7 0.8 0.9 0.0% 0.5% (I) 1.0% (I) 1.5% (I) 2.0% (I) 2.5% (I)
(m) St ra in ( % ) W E S N 0,05 R1N R3N R5N R6N R1S R3S R5S R6S (m) St ra in ( % ) S N W E 0,05 -0.10 -0.05 0.00 0.05 0.10 0.15 0.20 0.25 0.30 0.35 0.40 0.45 0.50 0.55 0.600.0 0.1 0.2 0.3 0.4 0.5 0.6 0.7 0.8 0.9 0.0% -0.5% -1.0% -1.5% -2.0% C-SSR5c C-SSR5a C-SSR5b C-Ref C-SSR3
Fig. 15. Strains in shear reinforcement, specimen C-SSR3 S N S N (m) S tra in ( % ) W E -0.1 0.0 0.1 0.2 0.3 0.4-0.4 -0.2 0.0 0.2 0.4 -0.1 0.0 0.1 0.2 0.3 0.4-0.4 -0.2 0.0 0.2 0.4 -0.1 0.0 0.1 0.2 0.3 0.40.0 0.2 0.4
Fig. 16. Strains in shear reinforcement, specimen C-SSR5a S N S N (m) W E S tra in ( % ) -0.1 0.0 0.1 0.2 0.3 0.4-0.50 -0.25 0.00 0.25 0.50 -4.5% -5.0% -5.5% -6.0% -0.1 0.0 0.1 0.2 0.3 0.4-0.50 -0.25 0.00 0.25 0.50 -0.1 0.0 0.1 0.2 0.3 0.40.00 0.25 0.50
Fig. 17. Strains in shear reinforcement, specimen C-SSR5b, first phase S N S N (m) W E S tra in ( % ) -0.1 0.0 0.1 0.2 0.3 0.4-0.50 -0.25 0.00 0.25 0.50
0.0% 0.5% (I) 1.0% (I) 1.5% (I) 2.0% (I) 2.5% (I) 3.0% (I)
-0.1 0.0 0.1 0.2 0.3 0.4-0.50 -0.25 0.00 0.25 0.50 -0.1 0.0 0.1 0.2 0.3 0.40.00 0.25 0.50
Fig. 18. Strains in shear reinforcement, specimen C-SSR5c S N S N (m) W E S tra in ( % ) -0.1 0.0 0.1 0.2 0.3 0.4-0.50 -0.25 0.00 0.25 0.50 -0.1 0.0 0.1 0.2 0.3 0.40.00 0.25 0.50
Fig. 19. Ultimate drift ratio as a function of Gravity Shear Ratio (GSR) and Gravity Flexure Ratio (GFR) 0.0 0.2 0.4 0.6 0.8 1.0 0 2 4 6 8 10 U lti m at e dr ift ra tio d r,u (% ) GSR -5.9GSR+8.2, R2=0.62 0.0 0.2 0.4 0.6 0.8 1.0 0 2 4 6 8 10 Ul ti ma te dr ift ra tio dr,u (%) GFR -6.5GFR+7.8, R2=0.62
Brown (2003) Cao (1993) Robertson et al. (2002) Broms (2007) Kang and Wallace (2008) Park et al. (2012) Present study Linear trendline
Fig. 20. Ultimate drift ratio as a function of the factor ζ -11.3+6.9, R2=0.61
Brown (2003) Cao (1993) Robertson et al. (2002) Broms (2007) Kang and Wallace (2008) Park et al. (2012) Present study Linear trendline
0.0 0.1 0.2 0.3 0.4 0 2 4 6 8 10 U lt im a te dr ift ra ti o d r,u (% )