NUNO MIGUEL MAGALHÃES DOURADO
R-Curve behaviour and size effect
of a quasibrittle material: Wood
THESIS
SUBMITTED TO
UNIVERSIDADE DE TRÁS-OS-MONTES
E ALTO DOURO (UTAD)
and
UNIVERSITÉ BORDEAUX I (UB1)
(under Tutorship)
By
Mr. Nuno DOURADO
TO GET THE DEGREE OF
Doctor of Philosophy
Speciality: Mechanics
____
R-Curve behaviour and size effect
of a quasibrittle material: Wood
____
Under supervision of
Mr. GÉRARD VALENTIN (Professor)
Mr. MARCELO de MOURA (Professor)
According to the
Convention de Cotutelle Internationale de Thèse
Signed on 14
thNovember 2005 by
Mr. Armando Mascarenhas Ferreira (Reitor UTAD)
Mr. Francis HARDOUIN (Président de l’UB1)
Mr. Gérard Valentin (Directeur de Thèse en France)
Mr. Marcelo de Moura (Directeur de Thèse au Portugal)
Mr. Nuno Dourado (PhD Student)
Este trabalho foi expressamente elaborado com vista à obtenção do grau de Doutor em Ciências de Engenharia,
4
Resumo
O trabalho apresentado nesta Tese de Doutoramento é constituído por uma parte experimental, uma parte numérica e uma parte analítica, com o propósito de estudar o comportamento evidenciado pelo desenvolvimento de uma curva de Resistência e o efeito de escala em estruturas de madeira pré-entalhadas, sujeitas a fractura em Modo I. Os resultados providenciados pelos ensaios mecânicos são combinados com análises numéricas realizadas por Elementos Finitos (EF), no sentido de avaliar propriedades de fractura, recorrendo a um procedimento equivalente da Teoria da Mecânica da Fractura Linear Elástica (LEFM), baseado na flexibilidade da estrutura, e a um Algoritmo Genético. A curva de Resistência (curva-R), determinada a partir dos ensaios mecânicos, evidencia o desenvolvimento da Zona de Processo de Fractura (FPZ), que ocorre na frente de fenda, durante o processo de propagação. A taxa de libertação de energia de fractura, dada pela curva-R, exibe, numa primeira fase, uma tendência crescente, convergindo continuamente para uma assímptota horizontal (patamar), à medida que o comprimento de fenda aumenta. Este patamar define a taxa crítica de libertação de energia de fractura (modo I), que constitui uma propriedade coesiva útil para reproduzir numericamente (modelação por EF) o processo de propagação da fenda. Assim, escolhida que seja a geometria da estrutura a analisar, bem como o modelo de dano a utilizar na simulação do processo de propagação da fenda, torna-se possível monitorizar o desenvolvimento da zona coesiva, equivalente à dimensão da FPZ (real), em função do comprimento de fenda equivalente. Os resultados decorrentes da modelação por EF da propagação da fenda, para além de dependerem do material simulado, revelam que a dimensão crítica da zona coesiva está associada ao início do patamar da curva-R. Esta observação permite especular quanto à exactidão na medição da taxa crítica de libertação de energia de fractura, em qualquer material quase-frágil, na medida em que a avaliação desta propriedade de fractura requer a constatação prévia de que a dimensão crítica evidenciada pela zona coesiva, permanece inalterada ao longo de um comprimento de fenda (equivalente) suficientemente extenso (estado de propagação auto-semelhante). Decorre deste ponto, a necessidade de observar atentamente a dependência da extensão da zona coesiva com a dimensão característica da estrutura, vulgo extensão do ligamento, na medida em que a modelação por EF revela a existência de uma dimensão crítica, abaixo da qual é impossível obter taxas críticas de libertação
de energia. A modelação da fenda por EF põe em evidência que a curva-R não depende da dimensão característica da estrutura, para uma dada geometria.
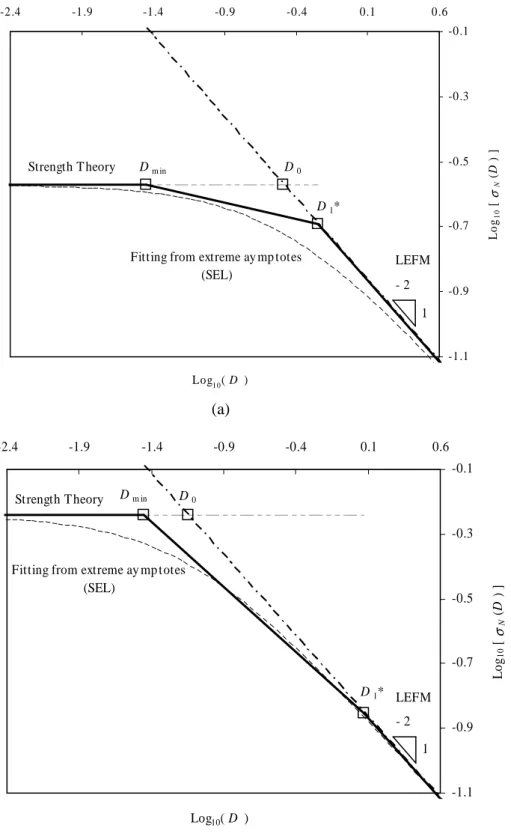
Surge a este propósito, o estudo do efeito de escala, no contexto de uma análise assimptótica, recorrendo a um procedimento analítico, que tem por base a constatação de que a curva-R é única. Discute-se se o comprimento de fenda equivalente associado à carga máxima depende ou não da dimensão característica da estrutura. Da mesma forma, analisa-se a evolução da taxa de libertação de energia associada à carga máxima, quando a dimensão da estrutura aumenta. Atendendo a que a lei de efeito de escala de Bažant (SEL), determina a evolução da resistência nominal para estruturas de dimensão intermédia, a partir do ajuste assimptótico efectuado a partir dos regimes previstos pela Teoria da Resistência de Materiais e pela LEFM, deve questionar-se se não seria mais exacto deduzir, para o regime intermédio, um regime adimensional assimptótico baseado na curva-R determinada experimentalmente.
O conjunto de questões levantadas no parágrafo anterior, respeitantes ao comportamento evidenciado pelo material, suscitou a realização de ensaios mecânicos em estruturas geometricamente semelhantes, de dimensão diferente. Este estudo de efeito de escala envolveu a realização de ensaios mecânicos em estruturas de dimensão não desprezível, pelo que se justificou o desenvolvimento de um procedimento que visasse a compensação do peso próprio.
O tratamento estatístico, envolvendo os resultados experimentais obtidos nos ensaios de fractura (Modo I), providencia a informação necessária para confirmar a existência de uma curva-R única, para uma espécie de madeira correntemente utilizada em construção civil. Assim, o efeito de escala evidenciado pela resistência nominal da estrutura, em particular aquele que cobre a gama de dimensões características intermédias, pode então possibilitar a avaliação do regime adimensional assimptótico baseado na curva-R (única) experimental. Este regime assimptótico representa a transição exacta entre os regimes previstos pela Teoria da Resistência de Materiais, e pela LEFM, quando analisado de um ponto de vista energético. A evolução da resistência nominal da estrutura, baseada em informação experimental, constituir-se-á sob a forma de um domínio (ou envelope de tendência) em função da dimensão característica da estrutura (gráfico bi-logarítmico).
6
Abstract
This Thesis concerns the mechanical testing, numerical analysis and cohesive modelling of fracture (Mode I) on the purpose to study the Resistance-curve behaviour and the size effect in wooden notched structures in its unmodified form. The mechanical testing is combined with the numerical analysis to evaluate fracture properties by means of an equivalent LEFM approach based on the structure compliance. The Resistance-curve being revealed from the experiments puts into evidence that a non-negligible damaged domain (Fracture Process Zone) is under development in the crack front during the loading process. Additionally, it is possible to investigate if the raise of the energy release rate, necessary to initiate the crack propagation, is likely to reveal an asymptotic behaviour (plateau). This being the case, among other fracture parameters issued from the Resistance-curve, the critical (asymptotic) energy release rate is determined, turning possible to use it in combination with other cohesive crack properties in the crack modelling (in Mode I). Thus, for a given geometry it is feasible to monitor the critical dimension being revealed by the Fracture Process Zone (FPZ) during the crack propagation. Furthermore, the analyses may reveal that this critical extent depend on the material used in the numerical simulation. Thus, one can speculates that the accurate evaluation of the critical energy release rate in any material is subjected to the condition that the FPZ extent stays unaffected during a sufficiently large crack extension. Another subject which merits attention concerns the dependence of the FPZ extent with the structure size being analysed in the cohesive modelling, since a lower characteristic dimension ought to outcome from the numerical study, thus permitting to define a critical ligament length valid for a given geometry. The cohesive crack modelling is also likely to provide the evidence that the Resistance-curve is not dependent of the structure size being considered in the analysis.
The foreknowledge developments just described envisage that the Resistance-curve is unique, turning consequent the analysis of the size effect on an energy based asymptotic analysis, thus making use of an analytical development procedure. Accordingly, one can argue whether the relative crack length at the peak load depends or not on the characteristic structure size. In a like manner, a similar query might be addressed concerning the trend exhibited by energy release rate at the peak load with the increase in the structure size. As the predictions provided by the Bažant’s size effect law
(SEL) are accomplished on the fitting basis of both the Strength Theory and the Linear Elastic Fracture Mechanics (LEFM) asymptotic regimes, one might wonder if the nominal strength in the intermediate size range would not be defined through an additional dimensionless asymptotic regime based on the evaluated Resistance-curve.
The above cited predictions involving the material behaviour somehow rouse the inevitable mechanical testing on geometrically similar structures of different sizes. With the required size effect study bringing about the mechanical testing of structures exhibiting non-negligible sizes, the self-weight is very likely to induce the results. This being observed, a self-weight compensation method turns crucial in the treatment of the experimental data.
The statistical handling issued by the fracture (Mode I) experiments, involving geometrically structures of different sizes, might provide the essentials to conclude for the unique Resistance-curve in a given wood species used in timber construction. The scaling of the nominal strength is then possible to perform for a set of tested characteristic sizes, spanning the predictions yield by the Strength Theory and LEFM. The accurate definition of the intermediate size regime is thus possible to achieve, sufficing that the R-curve is known for a given specimen geometry.
8
Résumé
Le travail détaillé de cette Thèse de Doctorat, est composé en partie par un travail expérimental, numérique et analytique. La dernière partie est présentée avec la proposition d’étudier le comportement qui met en évidence le développement d’une courbe de Résistance, et l’effet d’échelle, en charpentes de bois massif entaillé (Mode I de rupture). Les résultats, fournis par des essais mécaniques, sont combinés avec les analyses numériques réalisées par la Méthode des Éléments Finis (MEF), dans le but d’évaluer les propriétés mécaniques de rupture. Ceci est réalisé par une approche équivalente de la Mécanique de la Rupture Linéaire Élastique (Linear Elastic Fracture Mechanics : LEFM), basée par la flexibilité de la structure. Pour ceci, un Algorithme Génétique a été implémenté et testé. La courbe de Résistance (courbe-R), déterminée à partir des essais mécaniques expérimentaux, met en évidence le développement de la Zone de Rupture (Fracture Process Zone : FPZ), qui s’étend en fonde de fissure au cours du processus de propagation. Dans une première phase, le taux de restitution d’énergie de rupture montre une tendance croissante, progressant vers une asymptote horizontale (plateau) avec la longueur de fissure. Ce plateau détermine la valeur critique du taux de restitution d’énergie de rupture (Mode I) utilisée comme une propriété cohésive nécessaire à la modélisation numérique (MEF) d’une fissure. Ainsi, une fois la géométrie de structure à analyser a été choisie, bien que le modèle d’endommagement pour traduire le comportement du matériau, il sera possible d’estimer la taille de la zone cohésive, équivalente à la dimension de la FPZ (donc réelle), en fonction de la longueur équivalente de la fissure. Les résultats de la propagation de la fissure obtenus par modélisation MEF, au delà d’être dépendants des matériaux simulés, ils montrent que la dimension critique de la zone cohésive est associée au début du plateau de la courbe-R. Cette observation permet d’évaluer la précision de mesure de la valeur critique du taux de restitution d’énergie indépendamment du matériau considéré. Cette évaluation de la propriété de rupture nécessite la constatation, au préalable, que la dimension critique de la zone cohésive reste inaltérée le long d’une grande longueur de fissure (équivalente).
En conséquence, il devient impératif d’examiner attentivement la dépendance de l’extension de la zone cohésive avec la taille caractéristique de la structure. Par conséquence la modélisation par MEF montre l’existence d’une dimension critique en dessous de laquelle est impossible de déterminer des taux de restitution d’énergie
critiques de rupture. La modélisation de la fissure par MEF montre que la courbe-R ne dépend pas de la dimension de la structure elle même, pour une géométrie en particulier. À la suite de ces observations, il devient pertinent de réaliser l’étude d’effet d’échelle dans le contexte d’une analyse asymptotique, basée sur le faite que la
courbe-R est effectivement unique. L’importance d’évaluer si la longueur de fissure
équivalente, associée à la charge ultime, dépende de la dimension caractéristique de la structure. De même, l’analyse de l’évolution du taux de restitution d’énergie associée à la charge ultime, quand la dimension de la structure augmente, est aussi très pertinente. Il est connue que pour le régime de taille intermédiaire, la loi d’effet d’échelle de Bažant (Size Effect Law : SEL), estime la résistance nominale par ajustement asymptotique, réalisée à partir des petites tailles (Théorie de Résistance des Matériaux) et des grandes (LEFM). Par conséquent, il devient approprié de proposer un régime adimensionnel asymptotique basé sur la courbe-R unique, sur la base d’une approche analytique. Ce régime asymptotique additionnel devrait, donc, être en fonction de l’information acquise dans les données expérimentales de rupture, notamment la courbe-R.
L’ensemble de questions et suppositions antérieurement énumérés, notamment à propos du comportement exhibé par le matériau, justifient bien la réalisation des essaies mécaniques en structures géométriquement similaires de différentes dimensions. Cette étude d’effet d’échelle comporte ainsi la réalisation des essais en structures de taille importante. La conséquence inévitable, c’est donc l’influence du poids propre dans les résultats expérimentaux, surtout pour les grandes tailles de structures testées. Cette constatation justifie donc bien le développement d’une procédure qui considère l’effet du poids propre de la structure analysée (donc une correction).
Le traitement statistique réalisé sur les résultats du dépouillement expérimental, fourni l’information nécessaire pour confirmer l’existence d’une courbe-R unique, lorsque une essence de bois est utilisée comme matériau de teste. Ainsi, l’effet d’échelle sur la résistance nominale de la structure, en particulier celui qui couvre le régime de taille intermédiaire, rend possible l’évaluation du régime asymptotique adimensionnel basé dans la courbe-R expérimentale (unique). L’évolution de la résistance nominale de la structure, basée sur l’information expérimentale, est montrée sur la forme d’une enveloppe (domaine) de transition entre les petites et les grandes tailles de structure (en représentation bi-logarithmique).
10
D’abord je profite de cette occasion pour adresser mes sincères remerciements à M. Stéphane Morel, mon collègue et Ami de l’Université Bordeaux 1, de m’avoir transmis des compétences scientifiques essentiels à la réalisation de ce travail. Je le remercie de l’intéresse et disponibilité toujours manifestés pour les éclaircissements sollicités au long de cette grande aventure.
Je dois également une grande partie de mon travail à M. Marcelo de Moura, mon Directeur de Thèse au Portugal, de m’avoir transmis des aptitudes indispensables à la modélisation par Eléments Finis, une compétence que je cherchais à acquière il y a long temps, et que j’en profiterai bien dans l’avenir.
Je tiens également à remercier vivement M. Gérard Valentin, mon Directeur de Thèse en France, de m’avoir fait bénéficier de ses conseils et de ses compétences, soulignant ainsi l’intérêt qu’il porte à mes travaux. Je suis très reconnaissant d’avoir reçu de lui le sens de la rigueur expérimentale, et de l’esprit critique nécessaire à la prise de décisions au long de ce travail.
Mes remerciements vont aussi adressés à M. Patrick Castèra, Directeur du magnifique Laboratoire de Rhéologie du Bois de Bordeaux (LRBB), pour le tendre accueil toujours manifesté.
Je suis aussi très remercié à M. Pierre Morlier, de m’avoir invité et accueilli, dans le cadre de deux Stages réalisés au LRBB, en bénéficiant d’une bourse Marie Courie Fellowships, et dans une deuxième fois, comme Professeur invité par l’Université Bordeaux 1.
Je tiens également à remercier vivement mon Chef José Morais, pour m’avoir incité à débuter mon activité de recherche dans le sujet de la Mécanique de la Rupture du bois, et d’y chercher des compétences hors barrières. Je lui manifeste ma gratitude de m’avoir aidé et conseillé dans plusieurs étapes de ce long processus.
Je suis reconnaissant à M. Pedro Melo, Président du CETAV/UTAD, de m’avoir engagé des efforts pour me rembourser des frais réalisés au long de ce travail.
Je ne peux pas oublier Pierrette Wyss, de m’avoir facilité l’accès au Labo puis l’heure de fermeture du portail et dans l’Week-end. J’en profit aussi de l’occasion pour remercier les gens du LRBB, comme Jean-Luc Coureau, Christophe Lespine, Myriam Chaplain, Bernard Solbes, Philippe Taris, Jérôme Malvestio, Marc Sibaud, Jean-Louis et Françoise Rodriguez.
Dirijo-me agora à Coordenação do Departamento de Engenharias da UTAD, para manifestar o meu agradecimento e apreço pela criação das condições necessárias à realização desta Tese.
Devo uma palavra de grande agradecimento ao Sr. Professor José Luis Lousada, pelo interesse manifestado pelo meu trabalho, dando indicações preciosas quanto aos cuidados a ter na selecção e conservação do material utilizado na preparação dos provetes. Fico igualmente reconhecido ao Sr. Armindo Teixeira, pelos conhecimentos que me soube transmitir durante a árdua tarefa de maquinagem dos provetes, prestando um importante auxílio.
Fico reconhecido aos colegas e amigos que me ajudaram muito em fases cruciais da realização deste trabalho, como o Cristóvão Santos, o Abílio de Jesus, o Marcelo Oliveira, o José Xavier, o Amadeu Borges, o Engenheiro Domingos Guimarães, o Abel Rouboa, o Jorge Godinho e o José Luis Pereira.
Uma palavra de gratidão ao Sr. Engenheiro Jorge Martins, Director do Curso de Engenharia de Madeiras, pela autorização concedida para utilizar as oficinas do Instituto Politécnico de Viseu, numa fase inicial de preparação de provetes.
Estou obviamente muito reconhecido à minha Mulher, Paula Peixoto Dourado, e aos meus Filhos, Gonçalo Nuno Dourado e à Lídia Jorge Dourado, pelo apoio incansável e o carinho manifestados em todas as fases desta longa etapa da minha carreira.
Estou muito grato aos meus Pais e ao meu irmão, Telmo Dourado, pelo incentivo dado em muitos momentos deste trabalho.
Contents
Nomenclature
23Introduction
26Chapter I
Overview of the cohesive failure and main consequences
301.1 Introduction 31
1.2 Quasibrittle behaviour 31
1.3 Equivalent LEFM: Resistance-curve 35
1.4 Cohesive crack models 37
1.5 Size effect 41
Chapter II
Quasibrittle Fracture
462.1 Introduction 47
2.2 Experiments 47
2.2.1 Material and specimens 47
2.2.2 Fracture tests
482.3 Equivalent LEFM 50
2.4 Cohesive crack modelling 55
2.4.1 Interface finite element 55
2.4.2 Bilinear stress-softening model 56
2.4.3 FEM calculations 57
2.5 Formulation of the inverse problem 59
Chapter III
Size Effect in Notched Structures
653.1 Introduction 66
3.2 Derivation of the energetic Size Effect Law based on the equivalent
LEFM and the asymptotic analysis 67
3.2.1 Size effect on the relative crack length and resistance at the peak
load 69
3.2.2 Size effect on the nominal strength 74
3.2.2.1 Asymptotic regime at large sizes 74
3.2.2.2 Asymptotic regime at intermediate sizes 75
3.2.2.3 Asymptotic regime at small sizes 76
3.3 Validation procedure from numerical analysis: discussion 83
3.3.1 R-curve estimate 85
3.3.2 Relative crack length at the peak load 90
3.3.3 Size effect on the nominal strength 95
Chapter IV
Experiments on Size Effect
994.1 Introduction 100
4.2 Experiments 100
4.3 Self-weight compensation 103
4.3.3 Exact self-weight compensation method 109
4.3.3.1 Estimate of the equivalent crack length 112
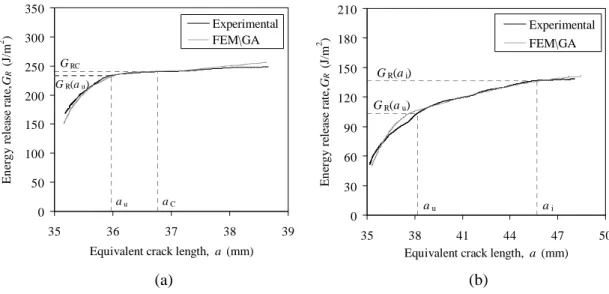
4.3.3.2 R-curve estimate 114
4.3.3.3 Cohesive crack modelling validation 118
4.4 Results of the Size Effect experiments: discussion 125
4.4.1 Variability and sampling 125
4.4.2 Estimate of the R-curves (Exact self-weight compensation) 127
Conclusions
135Appendices
Appendix A2.1
140Appendix A2.2
142Appendix A2.3
148Appendix A3.1
151Appendix A3.2
153Appendix A4.1
155Appendix A4.2
156Appendix A4.3
158Appendix A4.4
160Appendix A4.5
171References
174Annex
178List of Figures
Figure 1.1 Fracture Process Zone (FPZ) at the crack tip of a quasibrittle material and stress distribution along the crack line 32 Figure 1.2 Propagation of the main crack with its Fracture Process Zone (FPZ) 34 Figure 1.3 Typical load-displacement curve and corresponding R-curve obtained
in spruce for the SEN-TPB test in the TL system 37
Figure 1.4 Sketch of the cohesive zone behaviour: comparison of the numerical crack length with the equivalent LEFM crack length for different stages of the numerical crack propagation
40
Figure 1.5 Size effect on the nominal strength 43
Figure 2.1 Parts set up before bonding 48
Figure 2.2 Sketch of TPB test set-up 49
Figure 2.3 Typical load-displacement curves (Mode I) obtained in wood fracture 49 Figure 2.4 FE-modelling used in ABAQUS 6.5-1 compliance computations
performed using 352 isoparametric 8-node plane strain elements 51
Figure 2.5 Procedure used to assess the elastic energy release rate in wood 53 Figure 2.6 R-curves obtained in wood from P-δ curves 54 Figure 2.7 Bilinear Petersson’s softening stress-softening model used to describe
the natural phenomena occurring in the cohesive zone during wood fracture (Mode I): micro-cracking and fibre-bridging
58
Figure 2.8 Energies attributed to micro-cracking and fibre-bridging phenomena
for both sets of tested wood 60
Figure 2.9 Superposition of bilinear diagrams showing obtained mean values of achieved independent damage parameters using the proposed IP, for both wood tested species
62
Figure 2.10 Results of the IP for both wood tested species, regarding mean values of energy ascribed to phenomena of micro-cracking Gfµ and fibre-bridging
62
Figure 2.11 Bilinear Petersson’s law 63
Figure. 2.14 Results of FEA showing the evolution of the extent of the cohesive zone with the numerical crack length for both tested wood 64
Figure 3.2 Size effect on the ratio GR′ GR(α) revealing the decrease of
u
α
with the structure size for the SEN-TPB 71 Figure 3.3 Plotting of the scaling of the relative crack length at the peak load
against the structure size according to Eq. (3.8) 72 Figure 3.4 Size effect on the resistance at the peak load according to Eqs. (3.11)
and (3.12) 73
Figure 3.5 Size effect on the nominal strength 78
Figure 3.6 Comparison of the asymptotic behaviours estimated by Eq. (3.20) and the fitting of Bažant’s SEL (Eq. 1.3) for two distinct values of the exponent β which characterize the curvature of the R-curve
79
Figure 3.7 Underestimated design (more leftwards centreline) and nominal strength given by LEFM (Eq. 3.17) 82 Figure 3.8 Approximate size effect generated by fitting of the nominal strength
(Eq. 1.4) and the asymptote of LEFM (Eq. 3.17) 82 Figure 3.9 Sketch of the SEN-TPB showing the wood anatomic directions in the
front plane 83
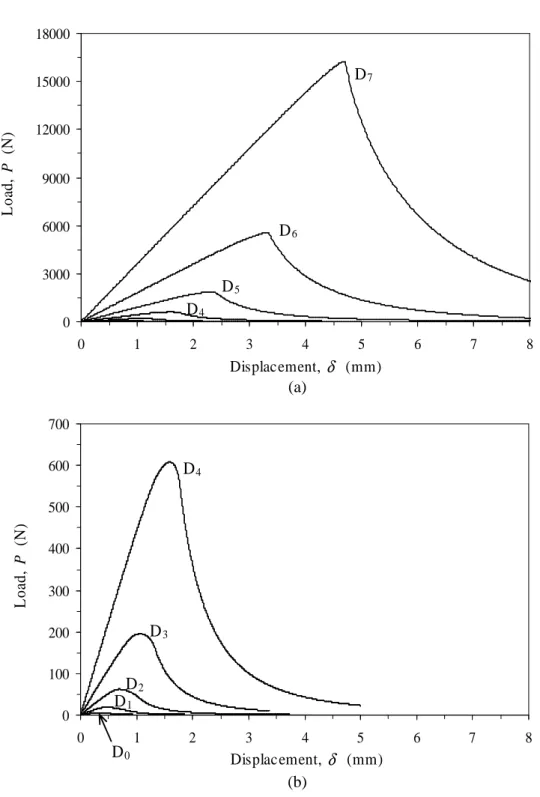
Figure 3.10 Load-deflection curves obtained in the CCM under displacement control. Curves labelling is in agreement with Table 3.1 84
Figure 3.11 Normalised R-curves (by Gf =GRc=0.1N mm) obtained in the numerical analyses
86
Figure 3.12 Influence of the specimen (SEN-TPB) size D on the normalized
extent of the cohesive zone 86
Figure 3.13 Unique R-curve revealed through the CCM 87
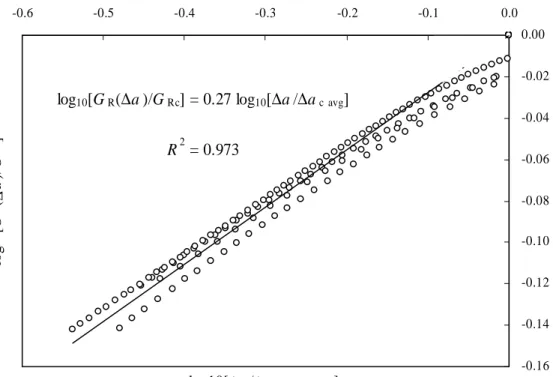
Figure 3.14 Linear regression plot performed on the rising part of the R-curves which exhibit an undoubted plateau, used to define the curvature exponent of the R-curve
89
Figure 3.15 Plotting of the normalized R-curve according to Eq. (3.1) (φ=1 and β=0.27) and the numerical results plotted in Fig. 3.11 for those series which exhibit an undoubted plateau
89
Figure 3.16 Plotting of Eq. (3.6) used to estimate
α
u*. Comparison with the plotting of Eq. (3.7) obtained from the R-curve computed for series3 D
91
Figure 3.17 Plotting of Eq. (3.6) used to estimate
α
u*. Comparison with the plotting of Eq. (3.7) obtained from the R-curve computed for series4 D
Figure 3.18 Plotting of Eq. (3.6) used to estimate
α
u*. Comparison with the plotting of Eq. (3.7) obtained from the R-curve computed for series5 D
92
Figure 3.19 Plotting of Eq. (3.6) used to estimate
α
u*. Comparison with the plotting of Eq. (3.7) obtained from the R-curve computed for series6 D
93
Figure 3.20 Plotting of Eq. (3.6) used to estimate
α
u*. Comparison with the plotting of Eq. (3.7) obtained from the R-curve computed for series7 D
93
Figure 3.21 Scaling of the relative crack length at the peak load αu as a function
of the characteristic size 95
Figure 3.22 Size effect on the resistance at the peak load according to Eqs. (3.11
and 3.12) 96
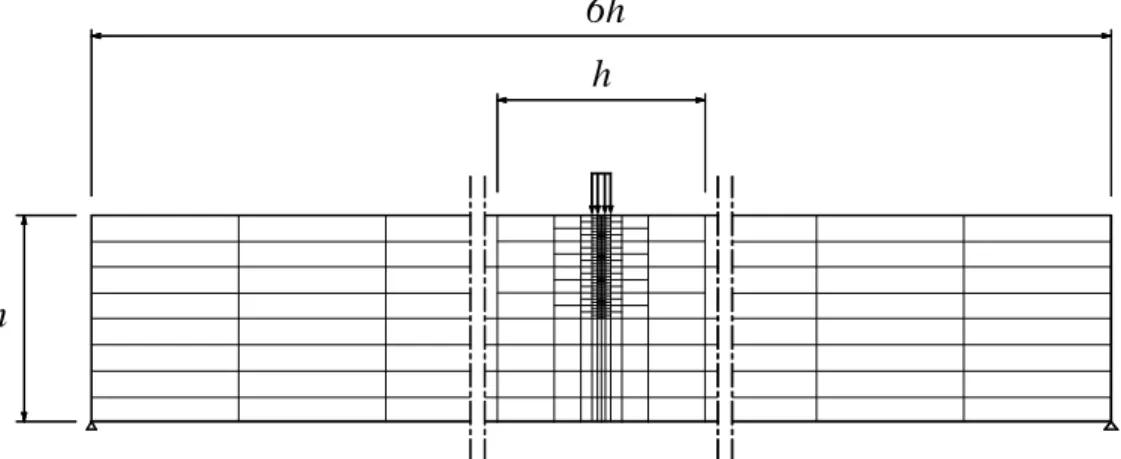
Figure 3.23 Size effect on the nominal strength (Eq. 3.17, 3.18 and 3.20) 97 Figure 4.1 SEN-TPB geometry used in the experiments showing the initial crack
length 101
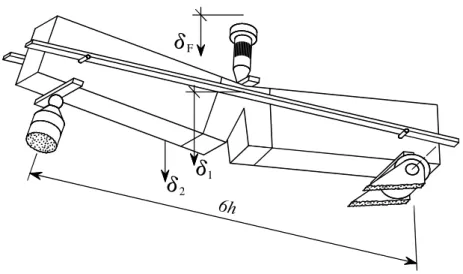
Figure 4.2 Sketch of the TPB test set-up showing the displacement
monitoring 102
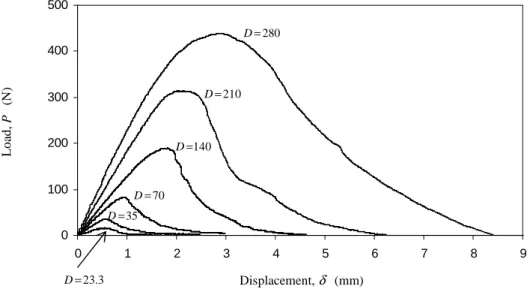
Figure 4.3 Superposition of typical load-deflection curves obtained for each
series 103
Figure 4.4 Load-displacement curve for the uncompensated TPB test 104 Figure 4.5 Schematization of the simply supported beam subjected to the
superposition of the central load P and the distributed load 105 Figure 4.6 Load–deflection curve in the elastic domain 106 Figure 4.7 Self-weight compensation of the load–deflection curve 108 Figure 4.8 Simply supported beam subjected to the superposition of the central
load and the distributed load 109
Figure 4.9 Superposition of load–displacement curves obtained in the experiments and through FE analysis in the linear elastic domain 112 Figure 4.10 Modified load–deflection curve due to the compensation of the
specimen self-weight 113
Figure 4.11 Partial strain energy associated to the external load in two consecutive points of the modified load-displacement curve 115 Figure 4.12 Schematic representation of the vertical displacement fields (absolute
Figure 4.13 Load-displacement curves obtained through FEM computations 119 Figure 4.14 Evolution of the numerical FPZ extent with the numerical crack length
for densities in the interval
[
300,700]
kg m3 120 Figure 4.15 R-curves obtained for material densities in the interval[
300,700]
kg m3 122Figure 4.16 Evolution of GP(a) and G (a)
q using material densities in the interval
[
300,700]
kg m3 123Figure 4.17 R-curves obtained for material densities in the interval
[
300,700]
kg m3 123Figure 4.18 R-curves obtained for material densities in the interval
[
300,700]
kg m3 125Figure 4.19 Unitary initial compliances obtained in the experiments showing the huge scattering of the tested material 126 Figure 4.20 Resistance-curves obtained in the experiments after application of the
Exact self-weight compensation method 128 Figure 4.21 Mean R-curves obtained in the experiments 129 Figure 4.22 Mean values of the critical energy release rate GRc obtained in the
experiments for the specimens which exhibited an undoubted plateau on the R-curve
129
Figure 4.23 Envelop estimated for the size effect on the nominal strength in wood spruce using the mean values obtained for each tested series 132
Figure 4.24 Progress of ratios used to estimate the nominal strength according to Eq. (3.17) and Eq. (3.18), showing the calculated limits for each ratio, according to the estimate performed for the structure sizes
3 . 23 210− = = D D (mm) 133
Figure A2.1.1 Axis directions in wood 141
Figure A2.1.2 Identification of wood fracture systems 141 Figure A2.2.1 Ranking of solutions in generation t showing subsets disposition 144 Figure A2.2.2 Couples resulting from Selection with the chromosomes display 145 Figure A2.2.3 Arrangement of solutions performed by Elimination 146
Figure A2.2.4 Sketch of the Inverse Problem 147
Figure A3.1.2 Dimensionless energy release rate 152 Figure A3.2.1 Symmetric FE-mesh used in ABAQUS® 6.5-1 simulations 154 Figure A4.1.1 Load-displacement curves obtained in the experiments 155 Figure
A4.3.1 Plotting of the ratio ( ) ( ) * *
α λ α
λPq PP obtained in the cohesive
crack modeling conditions referred in Section 4.3.3.3
158
Figure A4.3.2
Load-displacement curves obtained in the cohesive crack modelling after reset and corresponding compensation 159
Figure A4.4.1 Plotting of unitary compliances due to the applied external load 161 Figure A4.4.2 Plotting of unitary compliances due to the distributed load
corresponding to the specimen self-weight 162
Figure A4.4.3 Plotting of the dimensionless energy release rate function for each
series 163
Figure A4.4.4 Linear regression plot performed on the rising part of the R-curve and corresponding normalized R-curve for the data got in the experiments 165
Figure A4.4.5 Plotting of Eq. (3.6) used to estimate
α
u*. Comparison with the plotting of Eq. (3.7)obtained from the R-curve computed for specimen size D=280mm167
Figure A4.4.6 Plotting of Eq. (3.6) used to estimate
α
u*. Comparison with the plotting of Eq. (3.7)obtained from the R-curve computed for specimen size D=210mm167
Figure A4.4.7 Plotting of Eq. (3.6) used to estimate
α
u*. Comparison with the plotting of Eq. (3.7)obtained from the R-curve computed for specimen size D=140mm168
Figure A4.4.8 Plotting of Eq. (3.6) used to estimate
α
u*. Comparison with the plotting of Eq. (3.7)obtained from the R-curve computed for specimen size D=70mm168
Figure A4.4.9 Plotting of Eq. (3.6) used to estimate
α
u*. Comparison with the plotting of Eq. (3.7)obtained from the R-curve computed for specimen size D=35mm169
Figure A4.4.10
Plotting of Eq. (3.6) used to estimate
α
u*. Comparison with the plotting of Eq. (3.7)obtained from the R-curve computed for specimen size D=23.3mmFigure A4.5.2 Mean values of the ultimate load obtained in the experiments for the specimens which exhibited an undoubted plateau on the R-curve 172 Figure A4.5.3 Mean values of the relative crack length associated to the ultimate load
obtained in the experiments for the specimens which exhibited an undoubted plateau on the R-curve
172
Figure A4.5.4 Mean values of the energy release rate associated to the ultimate load obtained in the experiments for the specimens which exhibited an undoubted plateau on the R-curve
173
Figure A4.5.5 Mean values of the relative crack length associated to the critical energy release rate, obtained in the experiments for the specimens which exhibited an undoubted plateau on the R-curve
List of Tables
Table 2.1 Elastic properties of Maritime pine and Norway spruce 51 Table 2.2 Mean values obtained in TPB fracture tests for Pine wood 54
Table 2.3 Mean values obtained in TPB fracture tests for Norway spruce 54 Table 2.4 Comparison between numerical and experimental mean values
obtained for Maritime pine 60
Table 2.5 Comparison between numerical and experimental mean values
obtained for Norway spruce 60
Table 2.6 Summary of mean values obtained by the inverse problem regarding the bilinear constitutive model 61
Table 3.1 Series identification 84
Table 3.2 Resume of parameters obtained in the numerical simulation of
SEN-TPB 88
Table 4.1 Specimen sizes used in the experiments 102
Table 4.2 Resume of mean values obtained in the experiments 130
Table 4.3 Results obtained in the size effect study for the experimental data 133 Table A2.2.1 Lower and upper limits of the search domain attributed to each design
variable 142
Table A2.2.2 Resume of genetic parameters 147 Table A2.3.1 (Complete recording of Table 2.2) Resume of main values obtained in
TPB for Pine wood 148
Table A2.3.2 (Complete recording of Table 2.3) Resume of main values obtained in
TPB for Norway spruce 148
Table A2.3.3 (Complete recording of Table 2.4) Comparison between numerical and experimental mean values obtained for Maritime pine 149 Table A2.3.4 (Complete recording of Table 2.5) Comparison between numerical and
experimental mean values obtained for Norway spruce 149 Table A2.3.5 (Complete recording of Table 2.6) Summary of main values (12
specimens of each wood species) obtained in the inverse problem regarding the bilinear constitutive model
Table A3.2.1 Elastic properties of Norway spruce 154 Table A3.2.2 Petersson’s model softening properties used in the simulations 154 Table A4.3.1 Load equivalent to the specimen self-weight 158 Table A4.4.1 Elastic properties of Norway spruce (based on Guitard D, 1987) used
in the FEA for each series 162
Table A4.4.2 Parameters obtained in the size effect study for the experimental data 170 Table A1 Parameters obtained in the experiments regarding series with the
characteristic size D=280 mm 179 Table A2 Parameters obtained in the experiments regarding series with the
characteristic size D=210 mm 180 Table A3 Parameters obtained in the experiments regarding series with the
characteristic size D=140 mm 181 Table A4 Parameters obtained in the experiments regarding series with the
characteristic size D=70 mm 182 Table A5 Parameters obtained in the experiments regarding series with the
characteristic size D=35 mm 183 Table A6 Parameters obtained in the experiments regarding series with the
Nomenclature
a Equivalent crack length f
( )
w Stress softening functionc
a Critical equivalent crack length f (α) Dimensionless function
lim
a Limit value of a used in the IP Fmax Arbitrary constant
num
a Numerical crack-length g Acceleration of gravity
au Equivalent crack length at Pu g(α) Dimensionless energy rel. rate funct. a0 Traction free crack length Gd Critical damage energy dissipation rate
b Width of the structure cross section Gf Cohesive fracture energy
b Vector of design variables Gfb Fracture energy due to fibre-bridging
b Lower bound of design variables Gfµ Fracture energy due to micro-cracking
b Upper bound of design variables GP(a) Energy release rate associated to P B Empirical constant Gq(a) Energy release rate due to q
N
c Coefficient introduced for convenience GR(a) Energy release rate dn Normal stiffness at the interface GRc Critical energy release rate
ds Shear stiffness at the interface h Specimen height
D Characteristic structure dimension hFPZ Height of the FPZ
c
D Crossover size (in terms of energy) I Identity matrix
min
D Crossover size (lower bound of αu*) j Specimen label
num
D Intermediate size in crossover regime k Total number of design variables D Matrix of penalty parameters lFPZ Extent of the FPZ
Dz Domain of the state variables L Beam span 0
D Crossover structure size m Mass
* 1
D Crossover size (in terms of strength) mi Number of bits of design variable i
E Matrix of damage parameter N Number of points of the P-δ curve E Young modulus Ng Number of constraints of the IP
L
E Longitudinal modulus of wood P External applied central load
T
E Tangential modulus of wood p Precision required to determine y(b) E′ Longitudinal elastic modulus P(t) Population in generation t
*
E Effective Young modulus Pc Probability of Crossover
b
f Strength at the onset of bridging pm Probability of Mutation
u
f Arbitrary measure of material strength P q Statically equivalent load
t
Nomenclature
24
Pu Peak/ultimate load δPq Displacement due q in axis of P
q Distributed load corresp. self-weight δU Complementary energy
) (a
R Structure unloading stiffness δUq complementary energy of q S Data structure to store design variabl. δ(x,ai) Displacement field associated to ai t Generation label lcoh Extent of the cohesive zone vi Chromosome label δW Work of the external applied load
FPZ
V Critical volume of the FPZ ∆a Equivalent crack length increment w Crack opening width ∆ac Equivalent length of the FPZ
b
w Crack opening at onset of bridging ∆δPP(a0) Variation of δPP when a=a0 c
w Ultimate crack opening ∆Pexp(a0) Loading variation when a=a0
f
w Energy required during crack advance φ Arbitrary constant
o
w Damage onset relative displacement γ Brittleness number
r
w Vector of relative displacements λ(a) Numerical compliance function W(a) Elastic strain energy λcor(a) Corrected numerical compliance
*
W Complementary strain energy λexp(a) Experimental compliance
t i
x Potential solution in generation t λmod (a) Modified compliance
y(b) Objective function λqP(x,ai) Compliance field due δPq when a=ai
z Vector of the state variables λ*qP(x,ai) Best fit of in-plane λqP(x,ai)
z* Vector of prescribed state variables λqq(x,ai) Compliance field due to q (
i
a a= )
α Relative (equivalent) crack length λ*qq(x,ai) Best fit of in-plane of λqq(x,ai)
c
α Critical relative crack length λPP Compliance associated to δPP
u
α Relative crack length at Pu λ*PP(a) Best fit of in-plane FEA of λPP(a)
* u
α Single solution of αu λPq Compliance associated to δPq
β Curvature exponent of the R-curve λ*Pq(a) Best fit of in-plane FEA of λPq(a)
δ Displacement (vertical) ν Poisson ratio
δa Infinitesimal crack propagation ext. θ Relative length of the FPZ
δexp(a) Displacement recording in experim. ψ Multiplicative correction factor
δi Displacement in each specimen side σσσσ Vector of normal tractions
E
δ Elastic strain energy release σN Nominal stress
δF Displacement of load-point σ(x) Transfer normal stress
PP
Nomenclature
Notation:
CCM Cohesive Crack Modelling
COV Coefficient of Variation
EMC Equilibrium Moisture Content
ESWCM Exact self-weight compensation method
FEA Finite Element Analysis
FEM Finite Element Method
FPZ Fracture Process Zone
GA Genetic Algorithm
IP Inverse Problem
LEFM Linear Elastic Fracture Mechanics
LSSW Load equivalent to the specimen-self-weight
OS Optimisation Strategy
RH Relative Humidity
SE Size Effect
SEN-TPB Single-Edge-Notched beam loaded in Three-Point-Bending
SEL Size Effect Law
SSW Specimen self weight
26
Introduction
Fracture of quasibrittle materials, such as concrete, mortar, rocks, sea ice, dental cements, fibre composites, bone, wood, among others, is characterised by the existence of a non-negligible Fracture Process Zone (FPZ) which develops ahead of the crack-tip (Bažant ZP and Planas J, 1998). In these materials, the FPZ undergoes softening damage such as microcracking, crack-branching or crack-bridging, which may represent almost the entire nonlinear zone at the crack-tip, with normal stresses progressively declining along the FPZ domain (Bažant ZP, 2004). The experimental praxis in notched structures involving fracture reveals that the crack monitoring in these materials is very difficult to accomplish with accuracy, due to the cited fracture phenomena taking place ahead of the crack-tip. Due to the development of this FPZ, these materials typically fail only after a large crack has grown in a stable manner (Bažant ZP, 1997 c). As this softening zone attends a non-negligible dimension on the structure scale, Linear Elastic Fracture Mechanics (LEFM) cannot be directly applied, but rather Non-Linear Elastic Fracture Mechanics (NLFM). Nevertheless, an adaptation of LEFM is possible to execute, known as equivalent LEFM, which provides a useful approximation of quasibrittle fracture.
The main consequence of the FPZ development is the observation of the so-called
Resistance-curve (R-curve), in which the resistance to crack growth depends on this equivalent linear elastic crack length GR(a). The resistance to crack growth GR(a) has firstly been regarded as a fixed material property, as defended by Irwin GR (1960) and more assumedly by Kraft et al. (1961). More recently, however, it has been found that the shape of the R-curve is considerably influenced by the structure geometry (Bažant ZP and Li Y-N, 1997; Morel et al., 2003), as well as by the structure size (Bažant ZP and Planas J, 1998). This raises the issue regarding the relation which seems to exist between the energetic fracture properties, estimated from the R-curve, and the specimen geometry.
Conceptually, the most straightforward and efficient method to typify the quasibrittle failure in notched structures is the cohesive crack model (Elices M et al.,
Introduction 2002; Planas et al., 2003). According to this NLFM model the entire FPZ is gathered into the crack line being characterized on the basis of a stress-displacement law which exhibits softening. In most of the analyses which involve the cohesive crack modelling (CCM), the structural model in a whole remains elastic, turning thus possible to get the mechanical response on each side of the crack on the linear elasticity basis, with the nonlinearity being included through boundary conditions along the crack line. Among the different possible softening behaviours used to characterize this nonlinearity, the bilinear softening function is well known to describe accurately the quasibrittle failure, since it reproduces well the most important phenomena taking place under crack propagation (i.e., microcracking and crack-bridging). Regardless of the success revealed by the efficiency shown by the cohesive crack models to typify the quasibrittle failure in notched structures, the estimate of the cohesive properties with respect to a given experimental Load-Deflection response is yet a tiring task (Wang J, 2006; Dourado et al., 2008). Since this estimate provides a way to measure the development of the FPZ, as well as possible interactions with the structure boundaries, it turns that the issue deserves attention, also focused on the context of the R-curve behaviour. Therefore, the bilinear softening function (Petersson PE, 1981) has recently been used to estimate the connections between the R-curve and the cohesive crack properties in the one-to-one correspondence which seems to exist between the R-curve and the softening curve pointed out by Planas et al. (2003), using different specimen geometries (DCB, TDCB and SENB) (Lespine C 2007, Morel S et al. 2008). However, despite the efficiency of the CCM to describe the quasibrittle failure, the cohesive crack properties (as well as the R-curve properties) appear dependent on the specimen geometry.
One of the main consequences of the behaviour manifested through the R-curve is the effect of the structure size on its nominal strength. The size effect on the structural strength may be defined as the deviation, engendered by the change of structure size, of the actual load capacity of a structure from the load capacity predicted by plastic limit analysis (or any theory based on critical stresses or strains) (Bažant ZP and Planas J, 1998). In a unlike manner as previewed by the weakest link model (Weibull W, 1939) the size effect in notched structures is related to existence of the R-curve, through what it is referred as a energetic size effect rather than a statistical one (Bažant ZP, 1984; Bažant ZP, 1997 a; Bažant ZP c).
Introduction
28
Since 1984, the Bažant’s size effect law (SEL) (Bažant ZP, 1997 c) provides the alone efficient description of the size effect phenomenon in geometrically similar notched structures of different sizes D . In its most recent development, Bažant’s SEL is obtained from an asymptotic analysis performed for small and large structure sizes and leads to a size effect expected to be transitional between two corresponding asymptotic behaviours : Strength Theory (or plastic limit analysis) for small structure sizes and LEFM for large structure sizes. As a consequence, the size effect for the intermediate structure sizes is not accurately defined, since it is obtained from an asymptotic matching procedure, performed from both extreme asymptotic regimes. Since the intermediate structure sizes correspond to the range of the experimental data usually available, it turns that the issue ought to be analysed in detail. In addition, the size effect study on the intermediate size range might be supported on credible experimental data, thus allow verifying its adequacy to predict the evolution of the nominal stress in a given geometry.
After an overview of the quasibrittle failure and its main consequences in Chapter I, the second Chapter is devoted to an experimental study consisting in fracture tests in a quasibrittle material. The consequences motivated by the development of a non-negligible non-linear domain are discussed in the context of an equivalent Linear Elastic Fracture Mechanics approach, with the resistance to crack growth being evaluated as a function of the equivalent crack length (R-curve). The experimental results are then simulated from CCM and it is shown that the developed cohesive zone might interact with the structure boundaries, leading to corresponding underestimation of energetic properties. This interaction between the cohesive zone and the structure boundaries emphasizes the required minimum specimen dimension necessary to perform accurate estimate of the energetic properties and leads naturally to the introduction of the size effect phenomenon.
The third Chapter is focused in the size effect phenomenon in quasibrittle fracture. In this chapter, an evaluation of the size effect on the relative crack length at the peak load, on the corresponding resistance to crack growth, and on the nominal strength, is proposed. An analytical development procedure is presented, and an additional asymptotic regime is detailed for the intermediate size range. The predictions of this size effect model are
Introduction validated from CCM simulations performed on geometrically similar notched structures of different sizes.
The ending Chapter presents the experiments on the size effect. The R-curve is estimated through a compensation procedure which takes into account the specimen self-weight. The size effect on the nominal strength is presented revealing the intermediate size regime estimated by means of experimental data.
Chapter I
Overview of the cohesive failure and
main consequences
Chapter I
1.1 Introduction
The first Chapter of the present Thesis starts by framing the reader to the quasibrittle behaviour when a notched structure is subjected to an external load. The main consequences originated by the development of a non-negligible non-linear domain are discussed in the framework of an equivalent Linear Elastic Fracture Mechanics approach. The estimate of the resistance to crack growth is made as a function of the equivalent crack length, revealing a rising Resistance-curve, with turned out stress redistributions and stored energy release in the non-linear domain. On the other hand, cohesive crack models are referred as a very useful way to mimic damage development in materials which exhibit this non-linear domain through Finite Element Analysis. A first mention is made to the Size Effect on the nominal strength, since it comes out as the main consequence of the noticed R-curve behaviour observed in quasibrittle materials.
1.2 Quasibrittle behaviour
In notched structures, the fracture behaviour of quasibrittle materials is characterized by the existence of a large Fracture Process Zone (FPZ) where various toughening mechanisms take place such as microcracking, crack branching or crack bridging (Morel S 2008). This domain (i.e., the FPZ) is composed by a softening zone enclosed by a non-softening nonlinear zone which undergoes hardening or perfect plasticity (Fig. 1.1), with stress increase at increasing deformation, or held unchanged as the material deformation develops (Bažant ZP and Planas J 1998). As fracture in
Overview of the cohesive failure and main consequences Chapter I
32
quasibrittle materials is characterized by the existence of this large FPZ, Linear Elastic Fracture Mechanics (LEFM) can not be applied, but rather Non-Linear Fracture Mechanics. Nevertheless, an adaptation of LEFM (known as equivalent LEFM) provides a useful approximation of the quasibrittle failure, attributing the increase in the structure compliance, owing to the development of the FPZ, to the propagation of an
effective crack, i.e., a sharp traction-free crack of length a (called equivalent linear elastic crack length) which gives, according to LEFM, the same compliance as the one of the actual crack with its FPZ (Bažant ZP and Kazemi MT 1990, Bažant ZP 2002).
In quasibrittle materials the relative size of this nonlinear (i.e., softening) zone and the characteristic structure dimension D is considerably higher than in materials characterized by a very brittle behaviour, or in those materials in which a ductile behaviour is observed. Indeed, as for the very brittle behaviour, this ratio is practically neglected, while as to the materials exhibiting a ductile behaviour the ratio is not sufficiently small so that LEFM may be fully applied (mostly treated by the elasto-plastic fracture mechanics).
In most of the FPZ (Fig. 1.1) the material undergoes progressive damage with corresponding material softening, due to microcracking, void coalescence, crack-
Linear-elastic Softening
σ
Nonlinear plastic hardening FPZFigure 1.1 Fracture Process Zone (FPZ) at the crack tip of a quasibrittle material and stress distribution along the crack line. Adapted from Bažant ZP (1985).
Overview of the cohesive failure and main consequences Chapter I
bridging, frictional slips, and other analogous phenomena. In the envelope of the softening zone the nonlinear plastic hardening domain in quasibrittle materials, being negligible in volume, represents barely the transition between the elastic response and the material damaged volume. Materials as different as concrete, rock, cement mortars, sea-ice, tough fibre composites, ceramics, stiff clays, dental cements, bone and wood belong to this category (Bažant ZP 2004 ).
The denomination of quasibrittle is used to classify these materials since it is noticed that even when the plastic deformations are found irrelevant, the extent of the FPZ is large enough to have to be taken into account in the calculations, in total contrast with the genuine brittle materials in which LEFM is fully applied (Bažant ZP and Planas J 1998).
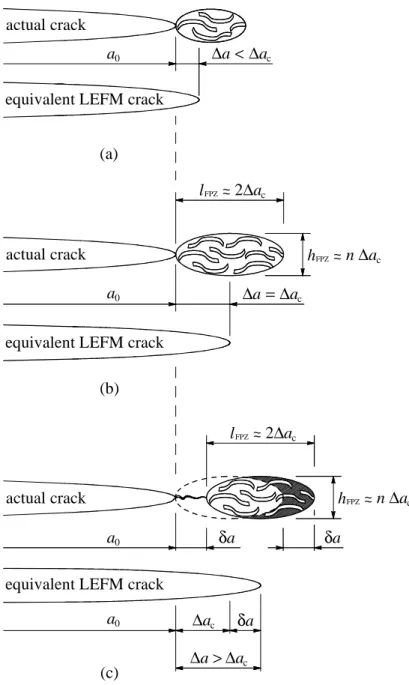
In quasibrittle failure of notched structures (in Mode I) the increase in the applied load at the early stage of the loading process leads to the development of a FPZ (Fig. 1.2 a) with the material undergoing progressive damage (with the equivalent crack length increment: ∆a< ∆ac). In sufficiently large specimens, for which the softening zone is not affected by boundary effects, as the loading process progresses the FPZ reaches a critical size (Fig. 1.2 b), for which ∆a=∆ac. This means that, at stable crack growth FPZ is compelled to move forward (Fig. 1.2 c), with non corresponding increase in size. In such a case, one sustains that crack grows in a self-similar way.
Due to their heterogeneity and to the development of a large FPZ, these quasibrittle materials usually fail only after a large crack has grown in a stable manner, contrasting with metallic materials that fail before crack reaches macroscopic dimensions. Due note should be taken to the meaning of a so called large FPZ, as it indicates that the distance between the tip of the actual crack traction-free a and the tip of the equivalent LEFM 0
crack when the FPZ is fully developed (critical size) is equal to a given characteristic length ∆ac, as shown in Fig. 1.2 (b). This leads to non-negligible macroscopic stress redistribution with a non negligible amount of energy release from the structure.
Regarding the fracture length a shown in Figs. 1.2 (b-c), two basic situations ought 0
to be distinguished: (i) a0=0, which conforms an un-notched structure, with the ultimate load P occurring at the onset of the fracture propagation, and (ii) u a0>0 not negligible in size compared to D, for which the ultimate (or peak) load P occurs after a u
Overview of the cohesive failure and main consequences Chapter I 34 h δa δa 0 a equivalent LEFM crack
(c)
a0 ∆a δa
∆a>∆ac c
equivalent LEFM crack
actual crack (b) a0 FPZ l ~~2∆ac ∆a=∆ac n ∆a ~ ~ FPZ c
equivalent LEFM crack
actual crack (a) actual crack a0 2∆a lFPZ~~ FPZ h ~~ c ∆a < ∆a c n ∆ac
Figure 1.2 Propagation of the main crack with its Fracture Process Zone (FPZ): (a) FPZ development, (b) critical size of the FPZ (i.e., fully developed) and (c) FPZ under crack propagation. Parameters: a0, initial crack length (actual traction-free crack length); ∆a=a−a0, equivalent crack length increment; δa, infinitesimal crack propagation extension; lFPZ, extent of the FPZ. Adapted from Bažant ZP and Kazemi MT (1990).
given crack propagation has been monitored. In this Thesis only the later is a subject of concern, with corresponding failure types regarded as to exhibit a strong size effect (Gettu R et al. 1990).
Overview of the cohesive failure and main consequences Chapter I
1.3 Equivalent LEFM: Resistance-curve
Fracture of quasibrittle materials can be described with success through an equivalent linear elastic approach. According to this standard, acquainted with as ‘equivalent LEFM’, the compliance increase caused by the FPZ development and by the propagation of the main crack is attributed to the propagation of an elastic equivalent crack length (Bažant ZP and Kazemi MT 1990), which produces (on the framework of LEFM) the same structure compliance as the actual crack with its FPZ. Therefore, the complementary energy W* might be used as a way to characterize the strain energy stored in the structure,
) ( 2 * f
α
b E P W ′ = (1.1)in which P is the applied load, E′ is the effective elastic modulus (E′=E for plane stress and E′=E (1−
ν
2) for plane strain; E =Young modulus andν
the Poisson’s ratio), b is the width of the structure cross section,α
the relative equivalent crack length (i.e.,α
=a D), and f (α) a dimensionless function characterising the geometry of the structure. Actually, f (α) is a function of the specimen compliance λ(α) defined as f(α
)=E′bλ
(α
) 2.According to LEFM, during crack propagation the elastic energy release rate G(α) (either under load P or displacement δ control) must equal the resistance to crack growth GR(
α
), ) ( ) ( ) ( 1 ) ( R 2 2 *α
α
α
α
α
g G D b E P W D b G = ′ = ∂ ∂ = (1.2)with the dimensionless energy release rate function g(
α
) defined as a function of the structure complianceλ
(α
) as follows g(α
)=E′b[
∂λ
(α
) ∂α
]
2.When the resistance to crack growth GR is estimated as a function of the equivalent crack length a (or in other terms, the relative crack length
α
=a D), the quasibrittle failure leads to a Resistance-curve (or R-curve as first pointed by Lawn BR 1993),which emphasizes the stress redistributions and stored energy release taking place during the crack growth before failure (Morel S 2008). Hence, as shown in Figs. 1.3 a-b for a Single-Edge-Notched Beam loaded in Three-Point-Bending (SEN-TPB), the
R-Overview of the cohesive failure and main consequences Chapter I
36
curve in wood obtained from the load-displacement curve is characterised by the existence of a rising part, for which the resistance to crack growth increases with the crack length, followed by a plateau which denotes that the influence of the toughening mechanisms is not indefinite (Morel et al. 2005). Hence, the rising portion of the R-curve (
α
<α
c in Fig. 1.3-b) might be interpreted as the energetic response of the FPZ development observed in Fig. 1.2-a (with ∆a< ∆ac) up to the attainment of the critical size of the FPZ (i.e., ∆a=∆acin Fig. 1.2-b), with a fully developed FPZ. The second part of the R-curve (α
≥α
c in Fig. 1.3-b) might correspond to the crack propagation with non-corresponding increase in volume of the FPZ (Fig. 1.2-c), with the resistance to crack growth GR becoming independent of the equivalent crack length (Fig. 1.3-b). The reported behaviour observed in the second part of the R-curve (forα
≥α
c in Fig. 1.3-b), defines an horizontal asymptote (known as the plateau of the R-curve) with the retrieved critical resistance value noted as GRc. The onset of the R-curve plateau defines the so called critical energy release rate GRc, with the corresponding abscissac
α
(Fig. 1.3-b) referred to as the critical (or characteristic) relative (equivalent) LEFM crack length. The extent ofα
c provides an approximation of the effective length of the FPZ (Morel et al. 2008), sinceα
c =α
0+θ
=a0 D+∆ac D. Accordingly, θ is designated the relative length of the FPZ and ∆ac the equivalent length of the FPZ.Though GRc is regarded as an intrinsic material property (Irwin GR 1960, and Krafft et al. 1961), experimental evidences on the R-curve however revealed that the assumption is only valid in a very narrow range of specimen geometries and structure sizes. These dependences in wood were firstly investigated by Morel S et al. (2002 a, 2002 b and 2003) and Morel S (2007).
Experiments performed with the SEN-TPB in spruce (Figs. 1.3 a-b) also revealed that the R-curve develops both in the pre and in the post peak regime (i.e., turning
Rc u
R( ) G
G
α
< ). Indeed, as shown in Fig. 1.3-b the (equivalent) relative crack lengthα
u corresponding to the peak-load P is smaller than the critical relative crack length uα
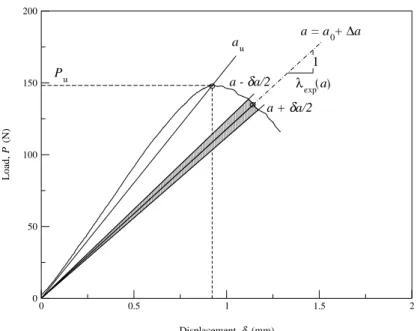
c. This behaviour is observed in specimens currently tested on the lab’s scale, except in certain geometries for which g′(α)=0 as noticed by Morel et al. (2005), as the TDCB (i.e., the Tapered Double Cantilever Beam).Overview of the cohesive failure and main consequences Chapter I 0 0.5 1 1.5 2 2.5 3 δ (mm) 0 50 100 150 200 P (N) 1 λexp(α0) Pu δu Pc δc (a) 0.5 0.6 0.7 0.8 0.9 α = a/D 0.00 0.05 0.10 0.15 0.20 G R α GRc α GR(αu) (N.mm -1 ) u c (b)
Figure 1.3 Typical (a) load-displacement curve and corresponding (b) R-curve obtained in spruce for the SEN-TPB test in the TL system (Appendix A2.1). Adapted from Morel S et al. (2005).
1.4 Cohesive crack models
Linear Elastic Fracture Mechanics (LEFM) theory takes for granted that a sharp crack tip does exist in a solid body for which stress fields may be determined. Although the elastic solutions envisage infinite stresses at the crack tip, authentic materials experience damage and yielding phenomena providing against this from actually occurring. Although linear elastic stress-relative displacement relationships are