HESSD
9, 2987–3027, 2012Potential hydrological impact of the Gibe III Dam on Lake Turkana
N. M. Velpuri and G. B. Senay
Title Page
Abstract Introduction
Conclusions References
Tables Figures
◭ ◮
◭ ◮
Back Close
Full Screen / Esc
Printer-friendly Version Interactive Discussion
Discussion
P
a
per
|
Dis
cussion
P
a
per
|
Discussion
P
a
per
|
Discussio
n
P
a
per
|
Hydrol. Earth Syst. Sci. Discuss., 9, 2987–3027, 2012 www.hydrol-earth-syst-sci-discuss.net/9/2987/2012/ doi:10.5194/hessd-9-2987-2012
© Author(s) 2012. CC Attribution 3.0 License.
Hydrology and Earth System Sciences Discussions
This discussion paper is/has been under review for the journal Hydrology and Earth System Sciences (HESS). Please refer to the corresponding final paper in HESS if available.
Assessing the potential hydrological
impact of the Gibe III Dam on Lake
Turkana water level using multi-source
satellite data
N. M. Velpuri1and G. B. Senay1,2
1
GISc Center of Excellence, South Dakota State University, Brookings, SD, USA
2
USGS Earth Resources Observation and Science (EROS) Center, Sioux Falls, SD, USA
Received: 4 February 2012 – Accepted: 3 March 2012 – Published: 8 March 2012
Correspondence to: G. B. Senay ([email protected])
HESSD
9, 2987–3027, 2012Potential hydrological impact of the Gibe III Dam on Lake Turkana
N. M. Velpuri and G. B. Senay
Title Page
Abstract Introduction
Conclusions References
Tables Figures
◭ ◮
◭ ◮
Back Close
Full Screen / Esc
Printer-friendly Version Interactive Discussion
Discussion
P
a
per
|
Dis
cussion
P
a
per
|
Discussion
P
a
per
|
Discussio
n
P
a
per
|
Abstract
Lake Turkana, the largest desert lake in the world, is fed by ungauged or poorly gauged river systems. To meet the demand of electricity in the East African region, Ethiopia is currently building the Gibe III hydroelectric dam on the Omo River, which supplies more than 80 % of the inflows to Lake Turkana. On completion, the Gibe III dam will be
5
the tallest dam in Africa with a height of 241 m. However, the nature of interactions and potential impacts of regulated inflows to Lake Turkana are not well understood due to its remote location and unavailability of reliable in-situ datasets. In this study, we used 12 years (1998–2009) of existing multi-source satellite and model-assimilated global weather data. We use calibrated multi-source satellite data-driven water balance model
10
for Lake Turkana that takes into account model routed runoff, lake/reservoir evapotran-spiration, direct rain on lakes/reservoirs and releases from the dam to compute lake water levels. The model evaluates the impact of Gibe III dam using three different approaches such as (a historical approach, a knowledge-based approach, and a non-parametric bootstrap resampling approach) to generate rainfall-runoff scenarios. All
15
the approaches provided comparable and consistent results. Model results indicated that the hydrological impact of the dam on Lake Turkana would vary with the magnitude and distribution of rainfall post-dam commencement. On average, the reservoir would take up to 8–10 months, after commencement, to reach a minimum operation level of 201 m depth of water. During the dam filling period, the lake level would drop up to
20
2 m (95 % confidence) compared to the lake level modelled without the dam. The lake level variability caused by regulated inflows after the dam commissioning were found to be within the natural variability of the lake of 4.8 m. Moreover, modelling results indicated that the hydrological impact of the Gibe III dam would depend on the initial lake level at the time of dam commencement. Areas along the Lake Turkana
shore-25
HESSD
9, 2987–3027, 2012Potential hydrological impact of the Gibe III Dam on Lake Turkana
N. M. Velpuri and G. B. Senay
Title Page
Abstract Introduction
Conclusions References
Tables Figures
◭ ◮
◭ ◮
Back Close
Full Screen / Esc
Printer-friendly Version Interactive Discussion
Discussion
P
a
per
|
Dis
cussion
P
a
per
|
Discussion
P
a
per
|
Discussio
n
P
a
per
|
on a terminal downstream lake. The results obtained from this study could also be used to evaluate alternate dam-filling scenarios and assess the potential impact of the dam on Lake Turkana under different operational strategies.
1 Introduction
River basin developmental activities such as construction of dams/reservoirs,
irriga-5
tion development, regulation of river flows, or land cover change often result in either a positive or negative impact on the hydrology of the river basin. Such activities re-quire impact assessment to be performed before the developmental plans are to be commenced. However, most of the basins in developing countries, where basin devel-opmental activities are currently being carried out, are mostly ungauged (Sivapalan,
10
2003) and data on key hydrologic variables such as rainfall, stream discharge, and evapotranspiration are unavailable, limited, or of poor quality. Thus, with limited to in-situ data, it becomes extremely difficult to carry out impact assessment studies. Challenges and issues pertaining to the hydrologic predictions in ungauged basins have been extensively discussed (Sivapalan, 2003; Seibert and Beven, 2009). Lake
15
Turkana, the largest desert lake in the world, is fed by ungauged or poorly gauged river systems. Since it is a closed-basin lake, the fluctuations are determined by the influx from rivers and by the evaporation from the lake surface. Out of three rivers (Turkwel, Keiro, and Omo) that contribute to the lake, the Omo River contributes to more than 80 % of the Lake Turkana inflows (Ricketts and Johnson, 1996). The Ethiopian
gov-20
ernment is building series of dams on the Omo River primarily to generate electricity. These dams, the Gibe I, Gibe II, and Gibe III (under construction), regulate the flow of the Omo River and its tributaries that eventually flow into Lake Turkana.
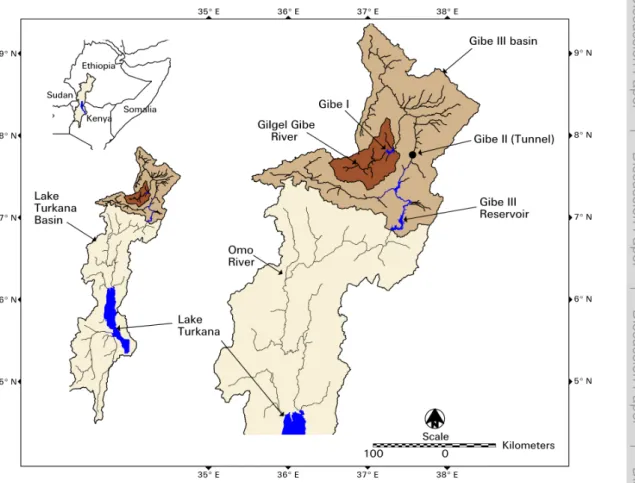
The Gibe I dam (commissioned in 2004) is the first of the three hydroelectric projects built within the Ethiopian side of the Lake Turkana basin (Fig. 1). It is built on the Gilgel
25
HESSD
9, 2987–3027, 2012Potential hydrological impact of the Gibe III Dam on Lake Turkana
N. M. Velpuri and G. B. Senay
Title Page
Abstract Introduction
Conclusions References
Tables Figures
◭ ◮
◭ ◮
Back Close
Full Screen / Esc
Printer-friendly Version Interactive Discussion
Discussion
P
a
per
|
Dis
cussion
P
a
per
|
Discussion
P
a
per
|
Discussio
n
P
a
per
|
Gibe I hydroelectric plant through a 26 km long tunnel directly into the Gibe-Omo River to hydroelectric plant located 500 m below Gibe I elevation. The resulting head is used to generate electric power. As this project does not impound any water by itself, we as-sume, it has no significant impact on the Lake Turkana water levels. The Gibe III dam is located on the Omo River about 150 km downstream of the Gibe II outlet (Fig. 1). Near
5
the dam, the area is characterized by a large plateau with a long and relatively narrow canyon through which the river flows (The Gilgel Gibe Affair, 2008). Upon completion, a 150 km long lake (a valley dammed reservoir) would be created, flooding the whole canyon from the dam upstream to the Gibe River retaining about 14.7 billion m3of water at maximum capacity. The dam is expected to be commissioned by 2014. The mean
10
annual inflows into the reservoir are estimated to be 438 m3s−1 (13 800 million m3), with seasonal inflows varying from less than a 62 m3s−1in March to over 1500 m3s−1 in August (EEPCo, 2009). The impact of the Gibe III dam on Lake Turkana is still not clearly understood. As the Turkana basin is poorly gauged, the availability of in-situ gauge data on hydrologic parameters such as rainfall, streamflow, and
evapotranspi-15
ration (ET) are very limited. However, satellite sensors provide data over large areas with consistent and repeated temporal coverage and thus offer several advantages in ungauged basins, so in this study we use a multi-source approach driven by satellite data to assess the potential hydrological impact of the Gibe III dam on Lake Turkana water levels.
20
Recently, few studies/reports on the impact of Gibe III are available (ARWG, 2009; EEPCo, 2004, 2009; Avery, 2010; Salini, 2010). However, there has not been consis-tency in the results obtained. Ethiopian Electric Power Corporation (EEPCo) performed an environmental impact assessment study of the Gibe II hydroelectric project and indi-cated that Lake Turkana will benefit from the Gibe I and Gibe II projects (EEPCo, 2004).
25
HESSD
9, 2987–3027, 2012Potential hydrological impact of the Gibe III Dam on Lake Turkana
N. M. Velpuri and G. B. Senay
Title Page
Abstract Introduction
Conclusions References
Tables Figures
◭ ◮
◭ ◮
Back Close
Full Screen / Esc
Printer-friendly Version Interactive Discussion
Discussion
P
a
per
|
Dis
cussion
P
a
per
|
Discussion
P
a
per
|
Discussio
n
P
a
per
|
the most comprehensive report on Lake Turkana and identified that the dam would cause up to a 2 m level drop in the Lake Turkana level. Furthermore, Salini (2010), the official agency building the dam, reported that initially lake water levels would drop up to 1.5 m. Some limitations of these studies are a lack of transparent and consis-tent methodology and a failure to model the impact beyond the initial period of dam
5
filling. In this study, using transparent methodology, we present the impact assessment study that uses remotely sensed data and hydrologic modeling techniques to model the impact beyond the initial period of dam filling.
Objectives of this study
The objectives of this study are (i) to demonstrate the use of a calibrated multi-source
10
satellite-driven water balance model to assess potential interactions between Lake Turkana and the Gibe III dam, (ii) to use existing satellite data (1998–2009) to model the potential impact of Gibe III dam, (iii) to study the response of Lake Turkana to regulated inflows from the dam under different operational strategies, and (iv) to model the impact of the dam on lake shoreline changes and identify vulnerable areas of change along the
15
shoreline. In this study, we used three different approaches to simulate rainfall-runoff scenarios to study the potential hydrologic interactions between the Gibe III dam and Lake Turkana water levels.
2 Study area and data used
2.1 Study area
20
The study is conducted over the Lake Turkana basin, which extends over Ethiopia in the north, Kenya in the south, and Sudan and Uganda in the west (Fig. 1). Lake Turkana is one of the lakes in the Great Rift Valley of East Africa. It has a maximum depth of nearly 110 m and an average depth of 30 m, and it extends up to 250 km long and 15– 30 km wide, with an average surface area of nearly 6750 km2. Lake Turkana is known
HESSD
9, 2987–3027, 2012Potential hydrological impact of the Gibe III Dam on Lake Turkana
N. M. Velpuri and G. B. Senay
Title Page
Abstract Introduction
Conclusions References
Tables Figures
◭ ◮
◭ ◮
Back Close
Full Screen / Esc
Printer-friendly Version Interactive Discussion
Discussion
P
a
per
|
Dis
cussion
P
a
per
|
Discussion
P
a
per
|
Discussio
n
P
a
per
|
for its inter- and intra-annual fluctuations. The climate of Lake Turkana is hot, arid, and moderately stable all year. The driest months are from October through January and rainfall occurs from April through August. The average rainfall over the lake is less than 200 mm yr−1 (Halfman and Johnson, 1988). Seasonal variations in rainfall over the Omo River catchment cause a high influx of water during July–December. Thus,
5
the lake shows minimum water levels during June–July and maximum levels during September–November. Generally, the lake level fluctuates annually with amplitude of about 1–1.5 m, but it also undergoes considerable long-term variations that exceed those of any other lake of natural origin (Butzer, 1971). Nyamweru (1989) suggested that the lake levels were about 80 m higher than the present levels when the lake was
10
connected to the Nile during the Holocene period. The modern lake has no outlet and the lake fluctuates from about 360 m to 365 m a.s.l. (above sea level). Kallqvist et al. (1988) synthesized the Lake Turkana water levels for the last 100 years and summarized that around 1895, the lake was 20 m higher than the present, followed by a general decline during the first half of the 20th century. After a minimum in the 1950s,
15
there was a rapid increase up to late 1970s. The most recent water level fluctuations captured by TOPEX/Poseidon show that the lake levels gradually increased to reach a level of 365 m a.s.l. by the end of the 20th century. The altimetry data show that lake levels by the end of 2011 were around 362.5 m a.s.l.
2.2 Data used
20
The data used in this study are summarized in Table 1. The National Oceanic and At-mospheric Administration (NOAA) Climate Prediction Center (CPC) produces satellite-based daily rainfall estimates (RFE). RFE data is available in near-real time since 1995 with a spatial resolution of 0.1 degree. Validation studies of RFE over the Ethiopian highlands using gauge data suggested that RFE can be reliably used for early
warn-25
HESSD
9, 2987–3027, 2012Potential hydrological impact of the Gibe III Dam on Lake Turkana
N. M. Velpuri and G. B. Senay
Title Page
Abstract Introduction
Conclusions References
Tables Figures
◭ ◮
◭ ◮
Back Close
Full Screen / Esc
Printer-friendly Version Interactive Discussion
Discussion
P
a
per
|
Dis
cussion
P
a
per
|
Discussion
P
a
per
|
Discussio
n
P
a
per
|
January 1998 to December 2009 are used in this study. The daily reference evapo-transpiration (ET0) data are produced at the USGS Earth Resources Observation and Science Center from 6-hourly Global Data Assimilation System (GDAS) climate pa-rameters using the standardized Penman-Monteith equation, then downscaled to 0.1◦ for this study (Senay et al., 2008). Historical average dekadal Normalized Difference
5
Vegetation Index (NDVI) datasets (1982–2006) described by Tucker et al. (2005) from the Advanced Very High Resolution Radiometer (AVHRR) are used to characterize the land surface phenology (LSP) and to estimate actual evapotranspiration (ETa) on a pixel-by-pixel basis at 0.1◦ resolution. The canopy interception parameter is estimated using the global percent tree cover product produced from Moderate Resolution
Imag-10
ing Spectroradiometer (MODIS) Vegetation Continuous Field (Hansen et al., 2003). Area weighted average interception losses are estimated for each modeling pixel based on the percentage of bare, herbaceous, and tree cover for each pixel. The Digital Soil Map of the World (FAO, 1995) is used to estimate water holding capacity (WHC) for the dominant soil type for each grid cell at 1:5 million resolution. Landsat data are used to
15
delineate the Gibe I reservoir and Lake Turkana. Digital elevation models (DEM) from Shuttle Radar Topography Mission (SRTM) 90-m Version 4.0 and Advanced Space-borne Thermal Emission and Reflection Radiometer (ASTER) global DEM (GDEM) 30 m Version 2.0 data are used to derive several hydrologic variables. Lake Turkana water level obtained from TOPEX/Poseidon (T/P), Jason-1/2, and ENVISAT altimetry
20
data was used for validation of the modelled lake levels.
3 Methods
3.1 Deriving reservoir/lake depth-surface area-volume (h-A-V) relationships
In order to model the water levels, it is important to first understand the relationships be-tweenh-A-V for each reservoir and Lake Turkana. As the SRTM DEM acquired in 2000
25
HESSD
9, 2987–3027, 2012Potential hydrological impact of the Gibe III Dam on Lake Turkana
N. M. Velpuri and G. B. Senay
Title Page
Abstract Introduction
Conclusions References
Tables Figures
◭ ◮
◭ ◮
Back Close
Full Screen / Esc
Printer-friendly Version Interactive Discussion
Discussion
P
a
per
|
Dis
cussion
P
a
per
|
Discussion
P
a
per
|
Discussio
n
P
a
per
|
it was used to generate the topographic-bathymetric (topo-bathy) data for the Gibe I reservoir. ASTER provided the high resolution pre-dam DEM data (30 m) for Gibe III, so it was used to generate the topo-bathy for the Gibe III reservoir. Since a pre-dam DEM was not available for Lake Turkana, bathymetry data obtained from Kallqvist et al. (1988) were draped on the SRTM DEM to develop seamless topo-bathy data.
Fi-5
nally,h-Arelationships were developed from the lake/reservoir topo-bathy data. Based on the water levels, a simple GIS-based model was used to extract surface areas at every 0.5 m interval of lake level. Thus, a relationships that explains the variations in
h-Awere obtained. Similarly, changes in lake volumes (V) were derived as
V =
N
X
i
[(D − LTBi) × A] (1)
10
whereDis the lake water level or depth [L], LTBi is the bottom height [L] for each pixeli
obtained from the topo-bathy data,Ais the pixel area [L2] of the topo-bathy data, andN
is the total number of pixels in the topo-bathy data representing the surface area of the reservoirs or lake at a given water level. Using Eq. (1), lake volumes at regular intervals were extracted and h-V relationships were derived for the lake and Gibe reservoirs.
15
Furthermore, SRTM elevation data were used to delineate hydrologic variables such as (a) the Lake Turkana watershed, (b) catchment areas and (c) streams and river networks.
3.2 Lake level modeling approach
In this paper we use the Lake Level Modeling (LLM) approach presented by Velpuri et
20
al. (2012). This approach uses a multi-sensor approach to monitor lake water levels by integrating digital elevation data, satellite-based rainfall estimates, modelled ET, runoff
data, and other satellite products. Lake levels modelled using this approach were found to be reasonable with<10 % errors when compared to satellite altimetry data (Velpuri et al., 2012). We introduced the Gibe I and Gibe III dams into the LLM approach and
HESSD
9, 2987–3027, 2012Potential hydrological impact of the Gibe III Dam on Lake Turkana
N. M. Velpuri and G. B. Senay
Title Page
Abstract Introduction
Conclusions References
Tables Figures
◭ ◮
◭ ◮
Back Close
Full Screen / Esc
Printer-friendly Version Interactive Discussion
Discussion
P
a
per
|
Dis
cussion
P
a
per
|
Discussion
P
a
per
|
Discussio
n
P
a
per
|
routed the runoff through dams before reaching the lake. Furthermore, operational strategies of the Gibe I and Gibe III dams are also incorporated into LLM approach.
3.2.1 Modelling runoffand ET
First, satellite rainfall and ET data are used to estimate runoff [L/T] on a pixel-by-pixel basis using the phenology-based model called VegET (Senay, 2008; Senay et al.,
5
2009). The unique aspect of this model is the use of remotely sensed land surface phenology (LSP) to parameterize the spatial and temporal dynamics of ET and runoff
on a grid-cell basis. Then VegET model estimates runoff(Qrf) for each time step based
on the principle of soil saturation excess, where soil water content in excess of the WHC of the soil is considered runoff. The modelling approaches in the VegET model
10
can be explained by Eqs. (2) and (3):
ETa = Kcp × Ks × ET0 (2)
Qrf =
h
SW(t−1) + ((1 − ILCi) ×RFEi) − ETai i
− WHC (3)
where ETais the actual ET;Kcpis the LSP-based crop coefficient;Ks is the soil water
stress coefficient (0–1) whose value depends on the state of soil water on a daily basis;
15
ET0is the global GDAS reference ET; RFE is the satellite-based rainfall estimate; and SW represents soil water content. ILCi is the interception losses coefficient, WHC is
the water holding capacity of the soil determined as the difference between the field ca-pacity and wilting point in the top one meter of soil, subscriptt represents the current modelling time step, and subscriptt−1 represents the previous time step. This
ap-20
proach produces a combined estimate of surface runoffand deep-drainage. Variables ETa, ET0, RFE, and SW all are in units [L/T]. Further description of this approach is found in Senay (2008), Senay et al. (2009), and Velpuri et al. (2012). Runoffgenerated using this approach is routed using a source-to-sink routing algorithm (Asante, 2000; Olivera et al., 2000; Velpuri et al., 2012) and total routed runoffvolume contribution for
25
HESSD
9, 2987–3027, 2012Potential hydrological impact of the Gibe III Dam on Lake Turkana
N. M. Velpuri and G. B. Senay
Title Page
Abstract Introduction
Conclusions References
Tables Figures
◭ ◮
◭ ◮
Back Close
Full Screen / Esc
Printer-friendly Version Interactive Discussion
Discussion
P
a
per
|
Dis
cussion
P
a
per
|
Discussion
P
a
per
|
Discussio
n
P
a
per
|
3.2.2 Calibration of runoffdata
In order to accurately predict the volumetric changes in reservoirs and the lake, it is essential to calibrate modelled runoff/inflow data using ground-based observation. It is common knowledge that all satellite-based rainfall estimates show bias when com-pared to ground truth data (Dinku et al., 2008). Hence through calibration process
5
we aim to perform (a) base flow and (b) bias correction for modelled runoffestimates. EEPCo (2009) published long-term (1964–2001) mean monthly Omo River flow data at the Gibe III site and at Lake Turkana. We used these data to calibrate modelled inflows for Gibe I, Gibe III, and Lake Turkana such that the calibrated data (1998–2009) would follow the general distribution of the historical data (1964–2001) for long-term trend
10
and magnitude. First, we estimated base flow from the long-term mean monthly hy-drographs using a constant discharge method (Linsley et al., 1975) for Gibe III and Turkana. By comparing long-term mean (1964–2001) streamflow data with mean monthly modelled runoff (1998–2009), monthly parameters for bias correction were obtained. Estimates of base flow and monthly coefficients for bias correction were
15
used to calibrate modelled Gibe III basin runoff data for 1998–2009. We used bias correction coefficients obtained for Gibe III basin to calibrate modelled runofffor Gibe I basin (a sub-basin of Gibe III). Base flow information for Gibe I was obtained from EEPCo (2004). Since contributions from other rivers in the Turkana basin (Turkwel and Kerio) are negligible (Carr, 1998), we calibrated the combined Omo, Turkwell, and
Ke-20
rio inflows with the long-term mean monthly inflow data for the Omo River at Turkana. For the Gibe III basin, 4 years of monthly flow data (1998–2001) were used to validate calibrated runoff. For Lake Turkana, only long-term mean monthly Omo River flow data were available, so validation could not be performed.
3.2.3 Modelling Gibe I, Gibe III, and Lake Turkana water levels
25
Total daily over-the-lake/reservoir rainfall (Qrain), ET (Qevap) and the runoffvolume
HESSD
9, 2987–3027, 2012Potential hydrological impact of the Gibe III Dam on Lake Turkana
N. M. Velpuri and G. B. Senay
Title Page
Abstract Introduction
Conclusions References
Tables Figures
◭ ◮
◭ ◮
Back Close
Full Screen / Esc
Printer-friendly Version Interactive Discussion
Discussion
P
a
per
|
Dis
cussion
P
a
per
|
Discussion
P
a
per
|
Discussio
n
P
a
per
|
estimated using a water balance principle as shown in Eqs. (4)–(7). First, daily Gibe I reservoir levels are modelled as
G1Li = G1Li−1 + G1Qrain + G1Qinf − G1Qevap − G1Qout (4)
where G1 represent Gibe I reservoir;Li [L/T] andLi−1[L/T] represent reservoir levels
for current and previous daily time steps andQrepresents different fluxes; “rain” [L/T] is
5
the direct rainfall over the reservoir; “inf” is the incoming calibrated runoffcontribution to the reservoir; “evap” [L/T] is the over-the-lake evaporation; and “out” [L/T] is the outflow from the Gibe I reservoir which will eventually flow into the Gibe III reservoir. Then, daily Gibe III reservoir levels are modelled as
G3Li = G3Li−1 + G3Qrain + G3Qinf + G1Qout − G3Qevap − G3Qout (5)
10
where G3 represents the fluxes of the variables for the Gibe III reservoir. According to EEPCo (2007), contribution of groundwater fluxes or seepage losses to and from the reservoirs are minimal. Hence, we ignore groundwater fluxes in Eqs. (4) and (5). G3Qout, the surface outflow from the Gibe III reservoirs is estimated as
G3Qout = G3Qenv + G3Qflood + G3Qpp + G3Qspill (6)
15
where G3Qenv [L/T] is the environmental flows; G3Qflood [L/T] is the artificial flood released from Gibe III; G3Qpp [L/T] is the water discharged from the Gibe III power
plant; and G3Qspill[L/T] represents spill flow or excess flow released when the Gibe III
dam is at maximum level, which will eventually flow into downstream Lake Turkana. Finally, Lake Turkana water level is estimated as
20
LTLi = LTLi−1 + LTQrain +LTQinf + G3Qout − LTQevap ± ε (7)
where LT represents the fluxes of the variables for Lake Turkana; andε[L/T] is the error term that accounts for the data and modelling errors. The estimate ofε(2 mm day−1) for Lake Turkana obtained by Velpuri et al. (2012) is used in this study. As Lake Turkana is considered closed (Ricketts and Johnson, 1996), groundwater inflows and surface
25
HESSD
9, 2987–3027, 2012Potential hydrological impact of the Gibe III Dam on Lake Turkana
N. M. Velpuri and G. B. Senay
Title Page
Abstract Introduction
Conclusions References
Tables Figures
◭ ◮
◭ ◮
Back Close
Full Screen / Esc
Printer-friendly Version Interactive Discussion
Discussion
P
a
per
|
Dis
cussion
P
a
per
|
Discussion
P
a
per
|
Discussio
n
P
a
per
|
3.3 Operational strategies of the Gibe dams
In this study, we considered the operational strategies to be followed by EEPCo to simulate the potential impact of the dams. Following are the operational strategies for the Gibe I and Gibe III dams that are implemented in the modeling framework.
a. The rated outflow of 101.5 m3s−1 and a continuous environmental flow of
5
1.3 m3s−1is released downstream of the Gibe I dam (EEPCo, 2004).
b. All time environmental flow at the rate of 25 m3s−1to be released from the Gibe III dam (EEPCo, 2009).
c. An artificial flood at the rate of 1000 m3s−1 to be released from the Gibe III for 10 days in September to maintain the natural flooding conditions in the lower
10
Omo basin (EEPCo, 2009).
d. The minimum operating level for commissioning of power generation is 854 m a.s.l. or a reservoir depth of 201 m (EEPCo, 2009).
e. The hydroelectric power plant would operate for 11 out of 24 h a day; i.e., a plant factor of 0.46 would be used to estimate the total power produced (Salini, 2010).
15
3.4 Gibe III impact assessment using satellite data
Since Gibe III is not commissioned at the time of performing this study, we used ex-isting satellite-based estimates of hydrologic variables to forecast the potential hydro-logical impact of the Gibe III dam. The relatively short length of the available satellite data (1998–2009) precludes a complete characterization of the rainfall variability in the
20
HESSD
9, 2987–3027, 2012Potential hydrological impact of the Gibe III Dam on Lake Turkana
N. M. Velpuri and G. B. Senay
Title Page
Abstract Introduction
Conclusions References
Tables Figures
◭ ◮
◭ ◮
Back Close
Full Screen / Esc
Printer-friendly Version Interactive Discussion
Discussion
P
a
per
|
Dis
cussion
P
a
per
|
Discussion
P
a
per
|
Discussio
n
P
a
per
|
Despite the short time series, we argue the calibrated runoffwould follow the general distribution in trend and magnitude of historical data (1964–2001) and rainfall variabil-ity observed in the 12 years (1998–2009) could represent much of the seasonal and annual rainfall-runoffdistribution of the basin. We used three different approaches to simulate rainfall-runoffscenarios and evaluate the potential impact of the dam on Lake
5
Turkana.
3.5 Approach I – historical approach
In this approach we assumed a simple case that the Gibe III dam was commissioned sometime in the past (January 1998). First, using the LLM approach (Velpuri et al., 2012), Lake Turkana water levels for 1998–2009 were modeled without the dam. Then,
10
the model was re-run assuming that the Gibe III Dam was commissioned on 1 Jan-uary 1998, and the volume of the inflows routed through the dams was used to model lake levels. A comparison of the volume of inflows and the lake water levels with and without the dam yielded the impact of the Gibe III dam. Furthermore, the time taken for the Gibe III reservoir to reach minimum operation level (MOL) and loss in Lake Turkana
15
water level was estimated.
3.6 Approach II – knowledge-based scenarios
Rainfall variability in the East African region has been thoroughly investigated (Kolding, 1992; Camberlin, 2001; Shongwe et al., 2009). Kolding (1992) studied the rainfall dis-tribution over Lake Turkana and summarized that severe drought occurs roughly every
20
6 years. The summer rains in this region were found to be significantly correlated to the El-Nino Southern Oscillation (ENSO), which repeats on average every 5 years (Cam-berlin, 2001). Furthermore, Shongwe et al. (2009) reported that there has been an in-crease in the number of reported hydro-meteorological disasters in the region, from an average of<3 events per year in the 1980s to∼10 events per year from 2000 to 2006,
25
HESSD
9, 2987–3027, 2012Potential hydrological impact of the Gibe III Dam on Lake Turkana
N. M. Velpuri and G. B. Senay
Title Page
Abstract Introduction
Conclusions References
Tables Figures
◭ ◮
◭ ◮
Back Close
Full Screen / Esc
Printer-friendly Version Interactive Discussion
Discussion
P
a
per
|
Dis
cussion
P
a
per
|
Discussion
P
a
per
|
Discussio
n
P
a
per
|
shows that there was a severe drought in 2000 (WFP, 2000) and below normal (BN) rainfall in 2003, 2004, 2005, and 2009. There were incidents of heavy rainfall due to the ENSO effect in 1998 (Behera, et al., 2005) and severe floods in 2006 (Moges et al., 2010), whereas above normal (AN) rainfall was observed in 2001, 2002, and 2006. Other years, 1999, 2007 and 2008, had near normal (NN) rainfall. These observed
pat-5
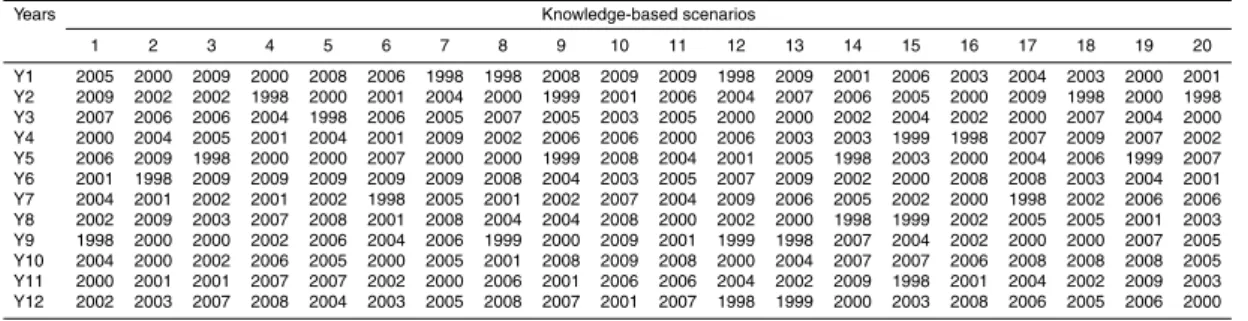
terns grossly follow the trend observed by Kolding (1992) and Camberlin (2001), with one severe drought (2000) and 2 severe rainfall years (1998 and 2006). However, other patterns of BN and AN rainfall years could be explained by the observations made by Shongwe et al. (2009). Based on the knowledge of the regional climate, 20 different scenarios of AN, NN, and BN rainfall distributions were built such that the occurrence
10
of a severe drought year (2000) or a severe flood year (2006) would not occur more than twice or, in rare cases, three times in a scenario. The choice of other years was purely based on random selection without any constraints. Table 2 shows various com-binations of years under each scenario used. Under each scenario, simulations of lake levels were modeled and compared with and without the dam. Furthermore, the time
15
taken for the Gibe III reservoir to reach MOL and subsequent loss in Lake Turkana water level was estimated.
3.7 Approach III – univariate nonparametric bootstrap resampling (NBR)
technique
In this approach, we used 12 years of data (1998–2009) to simulate time series
in-20
formation on the possible scenarios of rainfall, lake inflows, and ET data using the nonparametric bootstrap resampling (NBR) technique. The NBR technique was first introduced by Efron et al. (1993) and has been widely used for the simulation of rainfall or inflows using historical data (Rajagopalan et al., 1997; Sharma et al., 1997; Srikan-than and McMahon, 2001). We used this approach as it does not require a preselected
25
HESSD
9, 2987–3027, 2012Potential hydrological impact of the Gibe III Dam on Lake Turkana
N. M. Velpuri and G. B. Senay
Title Page
Abstract Introduction
Conclusions References
Tables Figures
◭ ◮
◭ ◮
Back Close
Full Screen / Esc
Printer-friendly Version Interactive Discussion
Discussion
P
a
per
|
Dis
cussion
P
a
per
|
Discussion
P
a
per
|
Discussio
n
P
a
per
|
study, we used a simple NBR method where the time series data of future scenarios are drawn at random from the data numerous times using the Monte Carlo approach. However, since we are using existing/historic data to predict future scenarios, the re-sampled scenarios represent plausible future scenarios under the assumption that the future would have similar statistical properties as the observed data. Furthermore,
5
since observations are randomly resampled, serial dependence is not preserved. How-ever, since we bag the daily data from the 12 different years and randomly draw a value from the set of observations for a given day, seasonality and distribution of observed rainfall are preserved. One of the main reasons to use the NBR technique is to con-struct a confidence interval attached to each estimate of modelled lake level. The NBR
10
is mathematically explained in the following steps:
– Step 1:
Let the parameter of interest (rainfall or runoffor ET variables for Gibe I, Gibe III and Turkana basins) be represented by the vector Qv,i, where the subscript v
denotes index for 12 years (v=1, 2, ... 12) andi denotes the series of daily data
15
for a year (i=1, 2, 3, ... 365). Then the X-matrix for 12 years of data can be shown as
X =
Q1,1 Q1,2 ... ... Q1,365
Q2,1 Q2,2 ... ... Q2,365
... ... ... ... ...
... ... ... ... ...
Q12,1Q12,2... ...Q12,365
. (8)
– Step 2:
For each day of the year, the bootstrap resample is drawn with replacement from
20
HESSD
9, 2987–3027, 2012Potential hydrological impact of the Gibe III Dam on Lake Turkana
N. M. Velpuri and G. B. Senay
Title Page
Abstract Introduction
Conclusions References
Tables Figures
◭ ◮
◭ ◮
Back Close
Full Screen / Esc
Printer-friendly Version Interactive Discussion
Discussion
P
a
per
|
Dis
cussion
P
a
per
|
Discussion
P
a
per
|
Discussio
n
P
a
per
|
X∗
=
Q∗1,1 Q∗1,2 ... ... Q∗1,365
Q∗
2,1 Q
∗
2,2 ... ... Q
∗
2,365
... ... ... ... ...
... ... ... ... ...
Q∗12
,1Q
∗
12,2... ...Q
∗
12,365
(9)
whereX∗ represents the resampled data matrix andQ∗
v,i is a random sample for
a day of the year equal to any of the 12 values for a particular day (a column of variables) in Eq. (8).
– Step 3:
5
Using the LLM approach and independent matrices of resampled variables Q∗v,i
generated in step 2, twelve years of lake water levels are modelled on a daily basis, by modifying Eqs. (4), (5), and (7) as
G1L∗
v,i = G1L
∗
v,i−1 + G1Q
∗
rain + G1Q
∗
inf − G1Q
∗
evap − G1Qout (10)
G3L∗
v,i = G3L
∗
v,i−1 + G3Q
∗
rain + G3Q
∗
inf + G1Qout − G3Q
∗
evap − G3Qout (11)
10
LTL∗
v,i = LTL
∗
v,i−1 + LTQ
∗
rain + LTQ
∗
inf + G3Qout − LTQ
∗
evap ± ε. (12)
– Step 4:
Large number of combinations are possible (12365) to build data for a year (a row in Eq. 9). Hence, Step 1 through 3 are repeated numerous times (B=100 000 times), such that time-series data matrix for daily variables (rainfall, runoff, and
15
ET) are used to generate a total of B independent array of lake levels as (L∗)(1),(L∗)(2)...(L∗)(B).
– Step 5:
A 95 % confidence interval for a total of B estimates of L∗
v,i is
ob-tained by sorting individual estimates of L∗v,i in increasing order such that
HESSD
9, 2987–3027, 2012Potential hydrological impact of the Gibe III Dam on Lake Turkana
N. M. Velpuri and G. B. Senay
Title Page
Abstract Introduction
Conclusions References
Tables Figures
◭ ◮
◭ ◮
Back Close
Full Screen / Esc
Printer-friendly Version Interactive Discussion
Discussion
P
a
per
|
Dis
cussion
P
a
per
|
Discussion
P
a
per
|
Discussio
n
P
a
per
|
(L∗
v,i)
(1)
≤(L∗v,i)(2) ... ≤(L∗v,i)(B). Then, the lower (LCI), median, and upper (UCI)
bootstrap percentile 95 % confidence intervals for theL∗v,iare estimated as
LCI = L∗
v,i
(U)
(13)
Median = L∗
v,i
(B/2)
(14)
UCI = L∗
v,i
(B+1−U)
(15)
5
where U=0.025B (Efron et al., 1993). For example, for a simulation that runs 100 000 times (B=100 000), U=2500 and B+1−U=97 501 for a 95 %
confi-dence interval.
3.7.1 Cross-validation of lake levels modelled using NBR technique
Velpuri et al. (2012) demonstrated the use of altimetry based lake level data for model
10
validation especially when in-situ data is unavailable. Lake levels modelled using LLM approach based on NBR variables were cross-validated using altimetry based monthly lake level data obtained from TOPEX/Poseidon (T/P), Jason-1, and ENVISAT (Cretaux and Birkett, 2006). First, we ran the model to predict lake levels under natural con-ditions (without dam) for a particular year using data from other years i.e., predicting
15
lake levels for 2006 using data from 1998–2005 and 2007–2009. Modelled lake level data were summarized on monthly basis to enable direct comparison with the satellite altimetry data. The correlation between the predicted and altimetry data is presented.
3.7.2 Impact of the Gibe III dam based on the initial lake water levels
Considering the Lake Turkana bathymetry andh-Arelationships, we hypothesize that
20
HESSD
9, 2987–3027, 2012Potential hydrological impact of the Gibe III Dam on Lake Turkana
N. M. Velpuri and G. B. Senay
Title Page
Abstract Introduction
Conclusions References
Tables Figures
◭ ◮
◭ ◮
Back Close
Full Screen / Esc
Printer-friendly Version Interactive Discussion
Discussion
P
a
per
|
Dis
cussion
P
a
per
|
Discussion
P
a
per
|
Discussio
n
P
a
per
|
of commencement of the dam. This is because, the higher the lake level, the higher the surface area, and larger volumes of inflows are required to cause a unit increase in lake level. Similarly, we argue that when the initial lake water level is low, the lake would stabilize faster with lesser volume of inflows. We test this hypothesis by modelling lake levels with different initial lake levels.
5
3.7.3 Application of NBR technique
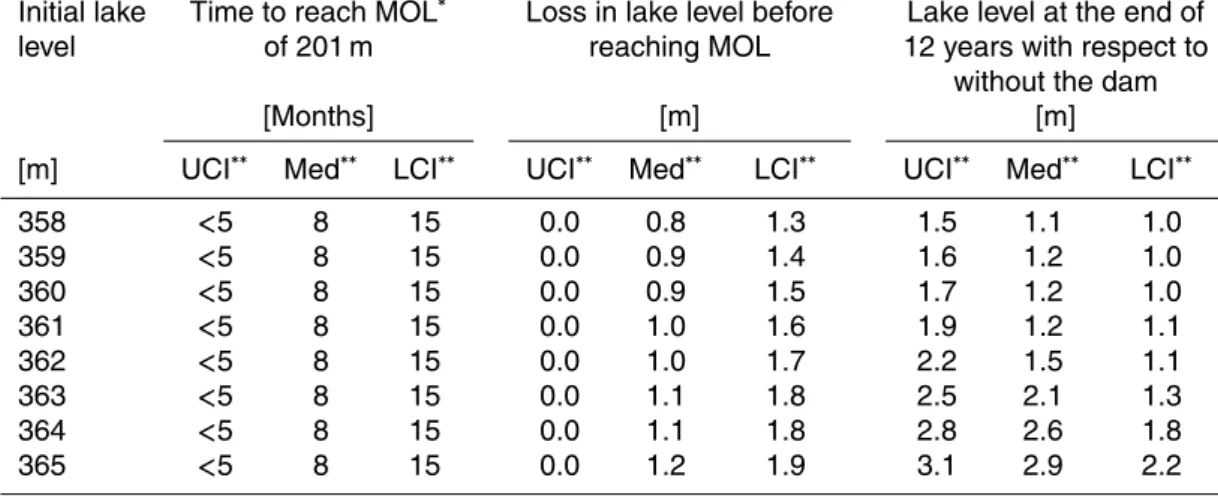
Using different scenarios of time series data produced, lake water levels for a period of 12 years from the commencement of the dam are produced using Eqs. (10)–(12) considering both with and without the dam. The impact of the dam is assessed for different initial lake levels within the range of natural fluctuations of the lake (358–
10
365 m). For each initial level, median and 95 % confidence intervals of lake levels are summarized. The time required for the reservoir to reach MOL and loss in lake level during this period is also reported for each initial lake level.
3.8 Analysis of shoreline changes using SRTM-based topo-bathymetry data
The overall impact of the Gibe III dam in terms of lake water shoreline is not
com-15
pletely understood unless the impact of frequency, timing, and duration of water level fluctuations on the lake shoreline is known. To derive lake shoreline changes, the LLM approach is run (with initial lake level of 362 m a.s.l.) using median, upper and lower 95 % confidence intervals of lake levels each representing NN, AN and BN rainfall sce-narios. Mean lake level and surface area are estimated for each month. Finally, mean
20
HESSD
9, 2987–3027, 2012Potential hydrological impact of the Gibe III Dam on Lake Turkana
N. M. Velpuri and G. B. Senay
Title Page
Abstract Introduction
Conclusions References
Tables Figures
◭ ◮
◭ ◮
Back Close
Full Screen / Esc
Printer-friendly Version Interactive Discussion
Discussion
P
a
per
|
Dis
cussion
P
a
per
|
Discussion
P
a
per
|
Discussio
n
P
a
per
|
4 Results and discussion
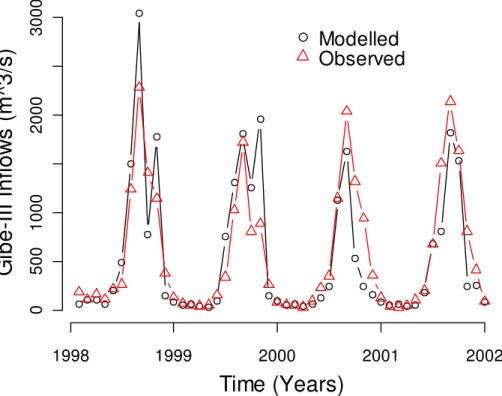
4.1 Validation of calibrated lake inflow data
Figure 2 shows the results of validation of calibrated modelled runoffusing river gauge data at the Gibe III dam site over 1998–2001. Initial comparison of modelled and observed runoffat the Gibe III site shows that modelled runoff underestimates up to
5
49 %. This could be due to the underestimation of RFE data used in this study (Dinku et al., 2008). Further runoff data modelled using the VegET approach is also found to underestimate the base flow, especially during dry season months. However, after calibration, monthly runofffor 1998–2001 shows a reasonable match with the observed data with anR2of 0.77 and an improved bias of−1.8 %.
10
4.2 Surface area and volume estimates for the Gibe reservoirs and Lake
Turkana
The surface area and volume of the Gibe I reservoir modelled using topo-bathy data was 49 km2 and 807 Mm3, respectively, at a maximum operation level of 1671 m a.s.l. against the published surface area of 51 km2 and volume of 839 Mm3
15
(EEPCo, 2004). The surface area of 209.3 km2 and total volume of 14.5 billion m3 at a maximum operation level of 894 m a.s.l. or 241 m were obtained for Gibe III using ASTER elevation data against the actual reported values of surface area (210 km2) and total volume (14.7 billion m3) as reported by EEPCo (2009). The surface area and volume obtained for Lake Turkana at 365 m a.s.l. are 7685 km2 and 233.4 billion m3,
20
respectively. These values are in close agreement with lake surface area and volume published in literature (Hopson, 1982).
4.3 Approach I – historical approach
The LLM approach was run without the Gibe III dam to derive lake levels for the period 1998–2009. The lake level for 31 December 1997 was obtained from the altimetry
HESSD
9, 2987–3027, 2012Potential hydrological impact of the Gibe III Dam on Lake Turkana
N. M. Velpuri and G. B. Senay
Title Page
Abstract Introduction
Conclusions References
Tables Figures
◭ ◮
◭ ◮
Back Close
Full Screen / Esc
Printer-friendly Version Interactive Discussion
Discussion
P
a
per
|
Dis
cussion
P
a
per
|
Discussion
P
a
per
|
Discussio
n
P
a
per
|
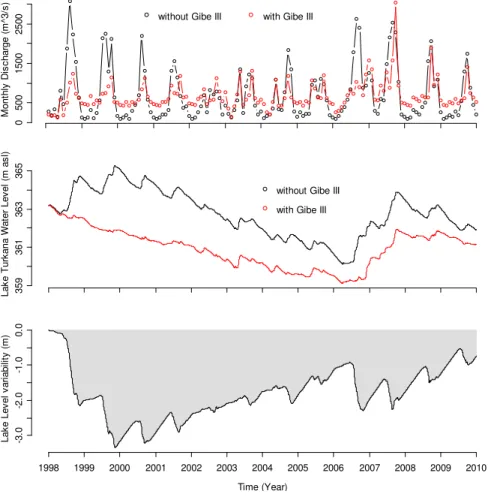
data. First, the model was run without the Gibe III dam. The average rate of inflows into the lake was found to be 650 m3s−1during 1998–2009 with wet season flow rate over 1500 m3s−1and dry season flow rate of 100–200 m3s−1(Fig. 3a). The lake level fluctuated between 360 and 365 m a.s.l. during 1998–2009. The model was then re-run by commissioning the Gibe III dam on 1 January 1998. The model results show that the
5
dam moderated inflows into the lake after the first impoundment period, with regulated peak flows and increased base flows with an average flow rate of 400–500 m3s−1 (Fig. 3a). Results indicated that the Gibe III reservoir would reach the MOL of 201 m in 8 months. During this period, the rate of inflow into Lake Turkana was found to be 58 % less than the rate without the dam. The difference between the lake levels with and
10
without the dam was 0.65 m by the time the Gibe III reservoir reached MOL (Fig. 3b). The difference between the lake levels with and without dam conditions increased to slightly over 3 m by beginning of 2000 (Fig. 3c). Then, both the lake levels gradually declined until the middle of 2006 and increased by the end of 2007. The difference by the end of 12 year simulation period was found to be<1 m.
15
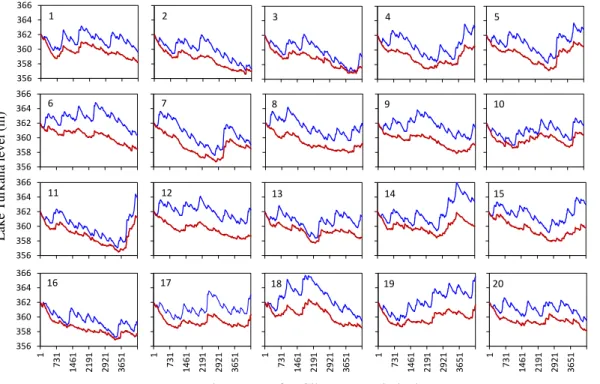
4.4 Approach II – knowledge-based scenarios
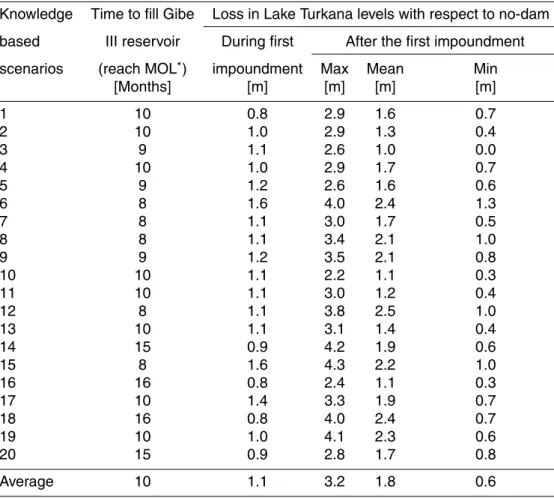
The LLM approach was run for the 20 knowledge-based scenarios (Table 2) both with and without the Gibe III dam. Results of this analysis are shown in Fig. 4 and Table 3. The Gibe III dam would reach MOL in 8 months (scenarios 6, 7, 8, 12, and 15) to up to 16 months (scenarios 16 and 18) with an average period of 10 months. The time to
20
reach MOL would depend on the amount and distribution of rainfall received after the dam commencement. During the first impoundment period, a BN rainfall year would prolong this time to more than a year. However, AN to NN rainfall year would help the dam to reach MOL in less than a year. Due to regulated inflows during the first stage of reservoir impoundment, with respect to without the dam, Lake Turkana water
25
HESSD
9, 2987–3027, 2012Potential hydrological impact of the Gibe III Dam on Lake Turkana
N. M. Velpuri and G. B. Senay
Title Page
Abstract Introduction
Conclusions References
Tables Figures
◭ ◮
◭ ◮
Back Close
Full Screen / Esc
Printer-friendly Version Interactive Discussion
Discussion
P
a
per
|
Dis
cussion
P
a
per
|
Discussion
P
a
per
|
Discussio
n
P
a
per
|
1.8 m. The dynamic ranges of fluctuations in each scenario are illustrated in Fig. 4 and Table 3.
Results also indicate that the impact of the dam would be higher in scenarios 6, 14, 15, 18, and 19, with over 4 m drops in lake levels. In all these scenarios, the highest impact occurred only over the years with AN rainfall. Scenarios 2, 3, 10, 11, and 16
5
shows the least impact with<0.5 m difference with respect to without the dam. These scenarios have more years of BN rainfall. It is interesting and counterintuitive to see a smaller impact on the lake level when there is BN rainfall, and a higher impact on the lake level when there is AN rainfall. This is because, during the dry years, the natural inflows into the lake are reduced. With the dam in place, an average inflow
10
of 400–500 m3s−1 is always guaranteed hence, the lake levels with the dam will not actually drop as much as they should drop in a dry years without the dam. However, this requires the initial condition that the dam reservoir is above MOL. On the other hand, during the wet years, the lake would always receive moderated inflows, which would be much less than the natural inflows (without the dam) and hence the relative
15
impact on the lake would be higher in wet years.
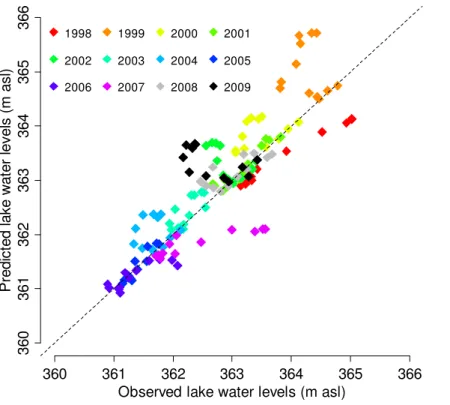
4.5 Approach III – univariate nonparametric bootstrap resampling technique
Results from cross-validation are shown in Fig. 5. Lake levels are predicted for each year using data from other years. Combined results provided anR2of 0.76. However, certain years such as 1998, 2001, 2005, 2006, 2007, and 2008 yielded high
correla-20
tion (R2>0.5), while others yielded lower correlation (R2<0.5). The years that showed distribution different from long-term distribution yielded low correlation. The results of simulated lake levels using NBR technique are shown in Fig. 6 and Table 4. Results in-dicate that the time required for the Gibe III reservoir to reach MOL is about 10 months for the median scenario. However, the upper and lower 95% confidence interval (UCI
25
HESSD
9, 2987–3027, 2012Potential hydrological impact of the Gibe III Dam on Lake Turkana
N. M. Velpuri and G. B. Senay
Title Page
Abstract Introduction
Conclusions References
Tables Figures
◭ ◮
◭ ◮
Back Close
Full Screen / Esc
Printer-friendly Version Interactive Discussion
Discussion
P
a
per
|
Dis
cussion
P
a
per
|
Discussion
P
a
per
|
Discussio
n
P
a
per
|
(with respect to without the dam) was found to range from 1.5 to 3.1 m (UCI); 1.1 to 2.9 m (median), and 1.0 to 2.2 m (UCI) depending on the initial lake level. Our results also indicate that, as the Gibe III dam would moderate the flows into the lake, peak season flows would reduce but with increased base flow. The seasonal fluctuations in lake level will be dampened from 1.5 m to<0.5 m (Fig. 6). Furthermore, based on
5
the results obtained, we accept the hypothesis that the total impact of the dam would depend on the initial Lake Turkana water level at the time of commencement of the dam. The impact at different initial lake levels was estimated by identifying the diff er-ence between the lake levels derived without the dam and with the dam at the end of simulation period. Our results indicate that the impact is lowest when the initial lake
10
level is low, and it increases as the initial lake level increases (Fig. 7).
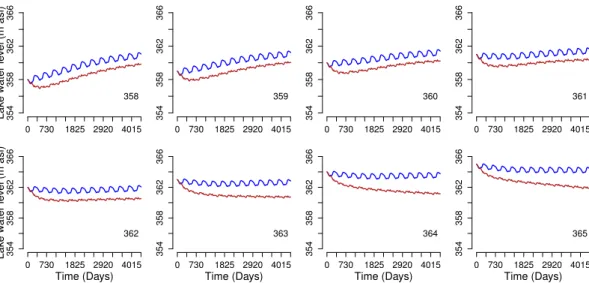
4.6 Analysis of Lake Turkana shoreline changes
The impact of changing lake level along the shoreline under three possible scenarios of rainfall is presented (Fig. 8). The dark blue areas in the figure indicate intact regions of the lake that would have water all the time during the modeling period of 12 years. Any
15
color other than dark blue indicates that the lake would have water for fewer months during the modelling period. Figure 8a indicates modelling results for the BN rainfall scenario (lower 95 % confidence interval), where the lake would shrink up to 5 m from the initial lake level of 362 m. This could cause the lake shoreline to shrink up to 1– 2 km and result in periodic wetting and drying of the shoreline in regions of Omo River
20
delta and Todenyang in the north; Ferguson’s Gulf and the Turkwell and Kerio deltas in the west; South and North Sandy bays, Allia Bay, and Koobi Fora in the west. A total of 22 % of the lake surface area (areas other than dark blue) would show wetting and drying conditions. For the NN rainfall (median) scenario, the lake would only show small fluctuations (Fig. 8b). With NN rainfall, the lake would shrink in the Omo River delta,
25
HESSD
9, 2987–3027, 2012Potential hydrological impact of the Gibe III Dam on Lake Turkana
N. M. Velpuri and G. B. Senay
Title Page
Abstract Introduction
Conclusions References
Tables Figures
◭ ◮
◭ ◮
Back Close
Full Screen / Esc
Printer-friendly Version Interactive Discussion
Discussion
P
a
per
|
Dis
cussion
P
a
per
|
Discussion
P
a
per
|
Discussio
n
P
a
per
|
interval), the lake does not show any shrinking (Fig. 8c). On the other hand, model results indicate that the lake would expand inundating the Omo River delta, Ferguson’s Gulf, the Turkwell and Kerio deltas, Allia Bay, and regions of Koobi Fora. The lake would expand up to 2–3 km along the shoreline in these areas. A total of 10 % of the area along the lake shoreline would show wetting and drying. Future research should
5
focus on the implications of decrease or increase in lake level and wetting and drying conditions along the lake shoreline on fisheries, ecology, and hydrology of the lake.
4.7 Use of multi-source satellite data for Gibe III impact assessment: opportunities and challenges
4.7.1 Use of calibrated satellite data-driven water balance model
10
Reliable in-situ data on hydrologic parameters are either limited or unavailable in most ungauged basins. Remote sensing satellites and model-assimilated global weather data sets offer consistent and reliable estimates of hydrologic variables required for water balance modelling at shorter time scales. However, satellite-based estimates of hydrologic variables often show bias when compared to ground truth data and require
15
site specific calibration or bias correction to improve model accuracies (Velpuri et al., 2012). In this study, therefore, we demonstrate the use of a calibrated water balance model driven by satellite data for the Gibe III impact assessment. We calibrated and validated the runoffdata using Omo River flow data obtained from EEPCo (2009) and cross-validated NBR approach results using satellite altimetry data.
20
4.7.2 Use of existing satellite data for the Gibe III impact assessment
The main challenge of using remote sensing data for hydrologic predictions is lack of longer time series of data from remote sensing platforms. The data little over a decade are only available from remotely sensed platforms. In this study, we use 12 years (1998–2009) of satellite-based estimates of rainfall, modelled ET, and runoff data to
HESSD
9, 2987–3027, 2012Potential hydrological impact of the Gibe III Dam on Lake Turkana
N. M. Velpuri and G. B. Senay
Title Page
Abstract Introduction
Conclusions References
Tables Figures
◭ ◮
◭ ◮
Back Close
Full Screen / Esc
Printer-friendly Version Interactive Discussion
Discussion
P
a
per
|
Dis
cussion
P
a
per
|
Discussion
P
a
per
|
Discussio
n
P
a
per
|
assess the potential hydrological impact of the Gibe III dam on the Lake Turkana wa-ter levels. However, this study is based on the assumption that the rainfall afwa-ter the commencement of the dam would follow the general distribution of the historical data (1964–2001) for magnitude and (1998-2009) for variability. Nevertheless, the actual rainfall may deviate from the observed mean distribution, so the results obtained from
5
this study should be used with caution. In spite of this, we recommend the use of ex-isting satellite data in poorly gauged basins, as they would at least help us understand the possible impacts of the upstream basin developmental activities such as dams or irrigation on downstream water resources. As more years of satellite and global data sets become available, the method will become more robust and reliable.
10
4.7.3 The use of topo-bathy data for shoreline changes
In closed-basin lakes such as Lake Turkana, changes in inflows drives changes in the lake level. The Gibe III impact assessment study would be incomplete without understanding the impact of the fluctuating lake level on the lake shoreline. The fre-quency and distribution of the wetting and drying of the Lake Turkana shoreline is
15
highly important for fisheries and ecological studies in the lake. In this study, we present an approach to use topo-bathy data produced by combining SRTM DEM and bathymetry data to (a) understand the impact of fluctuating lake level on shoreline changes, (b) identify areas vulnerable to change along the lake shoreline, and (c) iden-tify regions that are prone to periodic wetting and drying along the shoreline. However,
20
HESSD
9, 2987–3027, 2012Potential hydrological impact of the Gibe III Dam on Lake Turkana
N. M. Velpuri and G. B. Senay
Title Page
Abstract Introduction
Conclusions References
Tables Figures
◭ ◮
◭ ◮
Back Close
Full Screen / Esc
Printer-friendly Version Interactive Discussion
Discussion
P
a
per
|
Dis
cussion
P
a
per
|
Discussion
P
a
per
|
Discussio
n
P
a
per
|
5 Conclusions
The main objective of this study is to assess the interactions and potential hydrological impact of the Gibe III dam on Lake Turkana water levels using a calibrated water bal-ance model driven by satellite and model-assimilated global weather data. The impact of the Gibe III dam on the lake water levels is assessed using three different approaches
5
that use existing satellite data and various future scenarios of rainfall-runoff. First, we assessed the impact of the dam using a historical approach assuming that the dam was commissioned in the past. In the second approach, we generated future rainfall scenarios based on the knowledge of frequency and distribution of droughts and floods in the region. In the third approach, we used the NBR technique to generate different
10
rainfall-runoffscenarios and predict the impact of the Gibe III dam. All the approaches provided comparable and consistent results.
Modelling results indicate that, on average, the reservoir would take up to 8– 10 months to reach MOL of 201 m. During the initial period of dam/reservoir filling, the lake level would drop up to 2 m (95 % confidence interval). These results are
simi-15
lar to the results published by Avery (2010) and Salini (2010). When compared to the lake level modeled without the dam, the lake levels will decline on average 1.5–2 m with extremes ranging from no loss in lake levels (AN rainfall scenario) to a little more than 4 m (BN rainfall scenario). We also made an interesting finding that the impact of the Gibe III dam would depend on the initial level of Lake Turkana at the time of
com-20
mencement of the dam where the relative impact of the dam is larger at higher initial lake levels than lower initial lake levels. The variability of lake levels caused by regu-lated inflows was found to be within the natural variability of the lake of 4.8 m. In this study, we also identified areas along the Lake Turkana shoreline that are vulnerable to fluctuations in lake levels. Under the NN rainfall scenario, the lake shoreline would not
25
HESSD
9, 2987–3027, 2012Potential hydrological impact of the Gibe III Dam on Lake Turkana
N. M. Velpuri and G. B. Senay
Title Page
Abstract Introduction
Conclusions References
Tables Figures
◭ ◮
◭ ◮
Back Close
Full Screen / Esc
Printer-friendly Version Interactive Discussion
Discussion
P
a
per
|
Dis
cussion
P
a
per
|
Discussion
P
a
per
|
Discussio
n
P
a
per
|
(a) impact assessment of an upstream dam on downstream lakes/reservoirs in regions where in-situ data are limited and (b) analyzing the impact of regulated lake inflows on water level fluctuations and shoreline changes. Results obtained from this study can be used to understand the impact of different operational strategies on the hydrology of the lake. Because this study only focused on the hydrological impact, further study
5
is required to assess the potential impact of regulated Omo River flows on the ecology and fisheries of Lake Turkana and lower Omo basin.
Acknowledgements. We thank Ashbindu Singh of the Division of Early Warning and Assess-ment, United Nations Environment Program for funding field and data collection campaigns to Kenya and Ethiopia. Our thanks also goes to Mehret Debebe and Azeb Asnake of Ethiopian 10
Electric Power Corporation (EEPCo), Ethiopia for facilitating our field visit to the Gibe III dam site and providing useful technical data for this study. This work was partially supported by Applied Science Program of NASA Earth-Sun System Division contract # NNA06CH751.
References
Asante, K. O.: Approaches to continental scale river flow routing, Ph.D. dissertation, University 15
of Texas at Austin, 281, 2000.
ARWG: A Commentary on the Environmental, Socioeconomic and Human Rights Impacts of the Proposed Gibe III Dam in the Lower Omo River Basin of Southwest Ethiopia, Africa Resources Working Group, http://www.stopgibe3.org/ (last access: 7 March 2012), 2009. Avery, S. T.: Hydrological impacts of Ethiopia’s Omo basin on Kenya’s Lake Turkana water 20
levels and Fisheries, The Africa Development Bank, Tunis, 2010.
Behera, S. K., Luo, J. J., Masson, S., Delecluse, P., Gualdi, S., Navarra, A., and Yamagata, T.: Paramount impact of the Indian Ocean dipole on the east African short rains: A CGCM study, J. Climate, 18, 4514–4530, 2005.
Beyene, G. E. and Meissner, B.: Spatio-temporal analyses of correlation between NOAA satel-25
lite RFE and weather stations’ rainfall record in Ethiopia, Int. J. Appl. Earth Observ. Geoinf., 12, S69–S75, 2010.
HESSD
9, 2987–3027, 2012Potential hydrological impact of the Gibe III Dam on Lake Turkana
N. M. Velpuri and G. B. Senay
Title Page
Abstract Introduction
Conclusions References
Tables Figures
◭ ◮
◭ ◮
Back Close
Full Screen / Esc
Printer-friendly Version Interactive Discussion
Discussion
P
a
per
|
Dis
cussion
P
a
per
|
Discussion
P
a
per
|
Discussio
n
P
a
per
|
Butzer, K. W.: Recent history of an Ethiopian delta - The Omo River and the level of Lake Rudolf, Department of Geography, No. 136, University of Chicago Press, Chicago, USA, 1971.
Camberlin, P., Janicot, S., and Poccard, I.: Seasonality and atmospheric dynamics of the teleconnection between african rainfall and tropical ocean surface temperature: Atlantic vs. 5
ENSO, Int. J. Climatol., 21, 973–1005, 2001.
Carr, C. J.: Patterns of vegetation along the Omo River in the southwest Ethiopia, Plant Ecol., 135, 135-163, 1998.
Cerling, T. E.: A mass-balance approach to basin sedimentation: Constraints on the recent history of the Turkana basin, Palaeogeogr. Palaeocl., 43, 129–151, 1986.
10
Cretaux, J. and Birkett, C.: Lake studies from satellite radar altimetry, Comptes Rendus Geo-sciences, 338, 1098–1112, 2006.
Dinku, T., Chidzambwa, S., Ceccato, P., Connor, S. J., and Ropelewski, C. F.: Validation of high resolution satellite rainfall products over complex terrain, Int. J. Remote Sens., 29, 4097– 4110, 2008.
15
EEPCo: Ethiopian Electric Power Corporation, Gilgel Gibe Hydroelectric power plant Informa-tion booklet, An EEPCo PublicaInforma-tion, Addis Ababa, Ethiopia, 28 pp., 2004.
EEPCo: Ethiopian Electric Power Corporation, Gibe II Hydroelectric Project, Reservoir seep-age risk analysis, An EEPCo Publication, Addis Ababa, Ethiopia, 82 pp., 2007.
EEPCo: Gibe III Hydroelectric Project, Environmental & Social Impact Assessment, 20
CESI & Mid-Day International, 300 ENVRC002C, An EEPCo Publication, Addis Ababa, Ethiopia, 351 pp., 2009.
Efron, B. and Tibshirani, R. J.: An Introduction to the bootstrap, Chapman Hill, New York, 1993. FAO.: Digital Soil Map of the World Version 3.5 (CD-ROM), FAO, Rome, 1995.
Farr, T. G. and Kobrick, M.: Shuttle Radar Topography Mission produces a wealth of data, EOS 25
Trans. AGU, 81, 583–585, 2000.
Halfman, J. D. and Johnson, T. C.: High resolution record of cyclic climate change during the past 4 ka from Lake Turkana, Kenya, Geology, 16, 496–500, 1988.
Hansen, M. C., Defries, R., Townshend, J., Carrol, M., Dimiceli, C., and Sohlberg, A.: Global percent tree cover at a spatial resolution of 500 meters: first results of the MODIS VCF 30