Short Report
Printed in Brazil - ©2017 Sociedade Brasileira de Química0103 - 5053 $6.00+0.00
*e-mail: [email protected]
A Low-Cost Video-Based Reflectometer for Selective Detection of Cu
2+Using
Paper-Based Colorimetric Sensors
Camilo L. M. Morais, Lilian C. da Silva, Nayara A. Pinheiro, Fabrício G. Menezes and Kássio M. G. Lima*
Química Biológica e Quimiometria, Instituto de Química,
Universidade Federal do Rio Grande do Norte, 59072-970 Natal-RN, Brazil
This paper presents a low-cost reflectometer for selective detection of Cu2+. The reflectometer
is based on an emission light source using five light-emitting diodes at different wavelengths and a detector using a webcam. The samples were prepared using a filter paper-based colorimetric sensor with ascorbic acid-based quinoxaline derivative. Video analysis using gray color intensity was used to perform both copper ion screening (Cu2+, Pb2+, Cr3+, Ni2+, Fe2+, Sn2+, Mg2+, Cd2+, Ag+
and Co2+) and quantification of Cu2+ in spiked samples. In addition, a multivariate validation was
performed. The system proved to be selective to Cu2+ among the screened ions, and its quantification
was performed using partial least square regressions. Good linearity (R2 = 0.979, coefficient of
determination), low root-mean-square error of prediction (RMSEP = 5.20 × 10⁻³ mol L-1) and high
recovery (93.39-128.64%) were achieved. This method has potential to be employed for rapid and selective determination of Cu2+ in water using low-cost instrumentation.
Keywords: reflectometer, webcam, paper-based colorimetric sensor, low-cost instrumentation, Cu2+
Introduction
The design, fabrication and feasibility of portable handheld analytical instruments for detection and quantification of different classes of compounds are
reported in the literature.1 These instruments are useful and
advantageous, especially due to the low cost, simplicity
of operation, convenience of fast in situ analysis and
appropriate sensitivity and specificity to produce near real-time information used to solve specific problems which
require rapid feedback of information.2 Examples of portable
instruments based on ion trap mass,3 Raman,4 near infrared5
and mid-infrared6 spectroscopies, capillary electrophoresis7-11
and X-ray fluorescence12 represent the tendency of
instrument miniaturization for sensing applications. In case of miniature ion trap mass spectrometry, which represents a high breakthrough in portable analytical instrumentation, two approaches can be used to build this kind of instrument: the bottom-up approach in which the miniature instrument is assembled with the components built on a specific scale of interest; and the top-down approach, in which the component sizes of a macroscale instrument are reduced in an interactive way to maintain their performance. Bottom
up instruments are usually concentrated on quadrupole mass filter analyzers, microelectromechanical systems (MEMS) methods, or hybrid technology such as those utilized in the Chem-Cube/ChemPack instrument; whilst top-down instruments usually have simplified cylindrical or rectilinear ion trap geometry having reduced components, such as a small radio frequency (RF) supply and vacuum system, ensuring low size, weight, and power consumption. Examples of this type of instrument was developed by
Ouyang et al.3
Undoubtedly, light-emitting diodes (LED) represent the most commonly applicable light source in handheld
instrumentation.13 LED photometers14 possess main
characteristics of: simplicity, low cost, low power consumption and portability, which make them useful for on site measurements. Multi-LED photometers, for instance, may be sufficient for analysis or discriminatory simultaneous determinations based on multivariate
analysis.15 In the last decade, webcams,16 digital cameras17
and mobile phone cameras18 have been reported as an
which may be addressed solely or even combined between themselves in attempt to promote a broader spectrum of applications.
Although reflectance has proven to be an interesting tool for many applications, there are only few reports associated
to the detection of ionic analytes based on this technique.19-21
In fact, UV-Vis and fluorescence spectroscopy are the main techniques applied in studies involving chemosensors for
ionic analytes.22,23 In attempt to demonstrate the feasibility
of reflectometer devices presented in this work for detection and colorimetric quantification of cationic analytes, we performed a study using a disposable paper-based sensor
containing the compound N-(2-aminophenyl)-3-((1S,2S
)-1,2,3-trihydroxypropyl)quinoxaline-2-carboxamide (AAQX) adsorbed onto it. An explanation of the electronics of a homemade handheld portable reflectometer is presented, being used an inexpensive webcam detector for monitoring the chemical reaction that produces color change.
Paper devices including paper strip tests, paper-based assays and paper-based microfluidics present some advantages such as being available everywhere, low-cost,
thinness, lightweight, easy to stack, store and transport.24,25
For instance, paper-based devices have been successfully
applied in biological testing,26 environmental analysis,27 drug
detection28,29 and heavy metal detection.30 As the paper is
usually white (because it scatters light), colorimetric testing is of great potential because it provides a strong contrast with
a colored substrate.31 For colorimetric sensing, analyte flow
is directed along the paper matrix by capillary action, and the analyte then reacts with a label or an organic dye in the
test zone.32 The choice for this quinoxaline derivative was
based on previous work from our research group in which naked-eye and UV-Vis analyses showed AAQX selective
for the Cu2+ detection in methanolic solution against several
other cationic species.33 In this context, as a subsequent step,
we aimed to investigate the possibility of selective response
to Cu2+ when this compound is coated on paper. Naked-eye
and reflectance analyses were able to detect the referred analyte, with the latter being applied for quantification purpose. Finally, this paper aims at validating the video metric analysis method based on RGB frames to estimate the linearity, precision, sensitivity, bias and recovery.
Experimental
Colorimetric LED reflectometer
Microcontroller
The reflectometer was based in an Arduino UNO plate with an ATmega328 microcontroller chip. Additionally,
the Arduino plate has a working tension of 5 V, input tension between 7 and 12 V, 14 digital I/O pins, 6 digital
analogical pins, DC current per I/O pin of 40 mA, flash
memory of 32 kB, SRAM memory (or data memory) of 2 kB, EEPROM memory (or flash memory) of 1 kB, and a clock speed of 16 MHz.
Detection
The detection system was composed of a Microsoft®
L i f e C a m V X - 8 0 0 w e b c a m w i t h r e s o l u t i o n o f 640 × 480 pixels (CMOS VGA sensor technology, 59° diagonal field of view).
LED array
The samples were irradiated with five standard LEDs of 3.0 V and 20-25 mA with yellow (570-590 nm), green (500-570 nm), red (610-780 nm), white (450-780 nm) and blue (450-500 nm) color emissions. Each LED was individually actioned during a period of 3 s according to the sequence previously mentioned.
Reflectometer overview
Overall, the reflectometer was simply based on three
different systems: (i) LED radiation source, (ii) sample
holder and (iii) a detector based in a webcam. A resistor
of 6.8 kΩ was used to control the current of the radiation
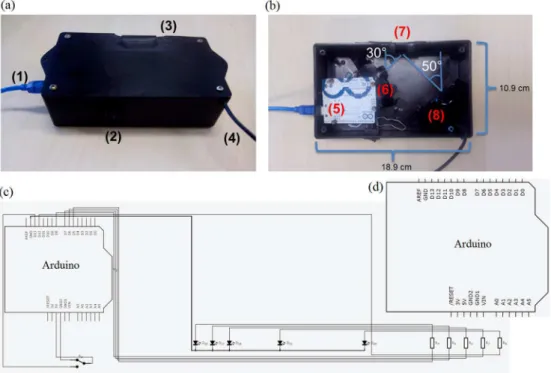
source actioned by the Arduino plate. The Arduino worked as a control system of the radiation source, where the LEDs activation sequence and elapsed time were controlled by this device. The sample holder was based on a cropped plastic container to hold the paper strip in vertical position and to expose its main part to the radiation source. It holds the paper-based sensor with size of 2.0 × 4.0 cm (see Supplementary Information (SI) section). The webcam detector was directly connected to a personal computer through a serial USB interface where video files were recorded using MyCam version 1.1 software (e2eSoft) after the LEDs were actioned. The recording time of the videos was constant and equal to 36 s. The reflectometer overview is shown in Figure 1 and the cost to build the reflectometer device is shown in Table 1.
Computational analysis
The video of each sample was processed using
MATLAB® R2012b software (MathWorks, USA) with
PLS Toolbox 7.0.3 (Eigenvector Research, Inc., USA). The videos were imported into MATLAB environment and its gray color intensity was extracted during the time
period of 36 s (161 frames). The gray color intensity (Igray)
is based on the RGB (red-green-blue) response for each
Igray = 0.30IR + 0.59IG + 0.11IB (1)
where IR, IG and IB are the red, green and blue intensities,
respectively.
This gray color intensity is related to the reflectance of the paper-based sensor, according to equation 2, where the
Kubelka-Munk function is represented by:35
(2)
where R is the reflectance at some path, k is the particle-size-dependent absorption coefficient, and s is the scattering coefficient.
The reflectance as color intensity for each frame during the analysis time was arranged into a row-vector
xi, representing the analytical signal for a sample i. These
signals were concatenated into a X {m × n} matrix and
preprocessed by auto-scaling normalization prior to further analysis using both screening and quantification approaches.
Copper screening was performed using principal component analysis (PCA). PCA scores were used as the signal indicator of the related metal. The quantitative analysis was performed using partial least square (PLS)
regressions with the preprocessed X matrix. For this, the
data were divided into calibration (70%) and prediction (30%) sets by using Kennard-Stone sample selection
algorithm.36 The model was built using cross-validation
venetian blinds. The image method was evaluated and validated according to the following figures of merit: root-mean-square error of cross validation (RMSECV) and prediction (RMSEP), linearity, precision, sensitivity, bias and recovery.
Paper-based colorimetric sensor
Synthesis of organic colorimetric sensor
The compound AAQX was synthesized according to literature and their spectroscopic data were coherent to the
proposed structure.33,37
Paper-based sensor preparation
In order to develop a rapid, low cost and simple analytical
procedure, strips of grade 1 Whatman® qualitative cellulose
Figure 1. (a) Outside view of reflectometer device: (1) power USB, (2) turn on/off switch, (3) sample holder lid and (4) video USB; (b) inside view of reflectometer device: (5) Arduino UNO plate (which is originally screwed into the reflectometer lid), (6) LED array, (7) sample holder, and (8) webcam; (c) reflectometer electronic circuit; and (d) Arduino plate from zoomed circuit.
Table 1. Cost of the components used to build the reflectometer
Component Price / US $
Plastic container 2.00
Arduino Uno 24.95
LEDsa 0.12
Resistors of 6.8 kΩa 0.19
Switch button 0.45
Webcam 21.74
Total 49.45
filter paper were used as paper-based sensors. These strips had dimensions of 2.0 × 4.0 cm with 180 µm thickness. The paper-based sensor was prepared by soaking the filter
paper strips in the solution of AAQX (2.00 × 10⁻³ mol L-1)
for 5 s. Then, the strips were immersed separately in
solutions containing pure water and 2 × 10⁻² mol L-1 of
different cations (Pb2+, Cr3+, Ni2+, Fe2+, Sn2+, Mg2+, Cd2+,
Ag+, Co2+ and Cu2+) for 5 s. Quantification of Cu2+ in
solution was performed by soaking strips of paper-based sensors in solutions of the referred cations in concentrations
ranging from 2.00 × 10⁻⁵ to 6.00 × 10⁻² mol L-1. The visual
strip test is based on a change of color when a chemical reaction between the analyte and the utilized reagent takes place. This color change is proportional to the analyte concentration.
Results and Discussion
Synthesis and copper ion screening
A synthetic quinoxaline-based compound (AAQX) was utilized as a colorimetric sensor adsorbed onto the filter paper. This compound was easily synthesized through a one
potprocedure, starting from initial oxidation of L-ascorbic
acid into dehydroascorbic acid followed by its reaction with
o-phenylenediamine.33,37
Our previous work showed that AAQX selectively
interacts with Cu2+ in methanolic solution, and this
reaction was able to be followed through naked-eye
and UV-Vis analyses.33 On the other hand, AAQX is a
polyfunctionalized molecule containing alcohol, amine, amide and quinoxaline moieties, which are able to interact with available hydroxyl groups of the cellulose fibers contained in paper via hydrogen bonds, and this fact opened a possibility for immobilizing AAQX on a paper support in attempt to develop a disposable sensor. For decades, the literature has been presenting examples in which hydrogen bonds are the main interaction in the adsorption of polyols, phenols and amines, among other chemical species to
cellulose chains,38-42 strongly suggesting that this type of
interaction is involved in the adsorption mechanism of AAQX to the paper strips. One important feature related to AAQX is its low solubility in water, which ensures that the chemosensor remains adsorbed to the paper strip after immersion in aqueous solution.
When the paper strip containing adsorbed AAQX was dipped into 10 mL of an aqueous solution of
2.00 × 10⁻³ mol L-1 Cu2+, the color of the paper immediately
changed from colorless to yellow. However, no significant changes in color were verified for the other metals in the same conditions (see Figure S2 in the SI section).
Reflectometer analysis
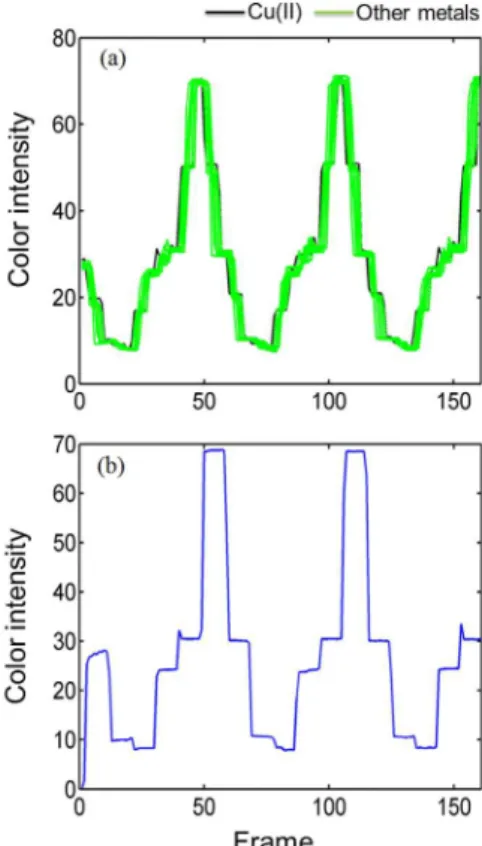
In diffuse reflectance measurements, the reflectometer reads a signal of the diffused reflected radiation. For the homemade reflectance device used in this study, the reflected radiation signal was represented by the gray color intensity acquired from a sample being irradiated with different wavelengths. The video-based reflectance signal acquired by the reflectometer was obtained from the gray color intensity of each frame in the video. The signal of
paper-based colorimetric sensor in the presence of Cu2+ and
other metal ions is very similar to each other (Figure 2a). The main observable difference is in the profile of the most intense peaks, which are slightly sharper in the presence
of Cu2+ ions (see Figure S5 in the SI section). In addition,
although the signals recorded are similar to the blank signal (Figure 2b), the signal is slightly more intense when AAQX is in the presence of metal.
The noise acquired with the LEDs off (only the webcam recording) was very small, with a magnitude to the order of
10-3 (see SI section), being negligible when compared to the
analyte signal which had a magnitude to the order of 101.
Therefore, the reflectometer device was appropriately sealed, so that external radiation sources do not significantly Figure 2. Video-based reflectance signal acquired for different metal ions (green: Pb2+, Cr3+, Ni2+, Fe2+, Sn2+, Mg2+, Cd2+, Ag+ and Co2+; black: Cu2+),
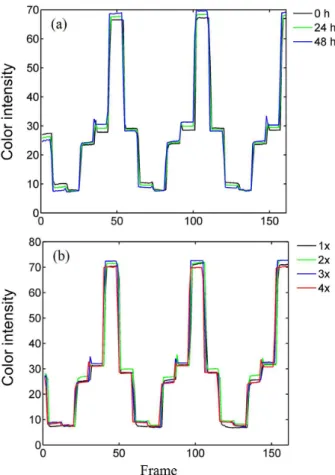
affect the recorded signal. The stability of the paper-based colorimetric sensor according to its exposure time to the environment and when it was dipped in deionized water is shown in Figure 3.
As can been seen in Figure 3a, the color signals of the paper-based colorimetric sensor have small intensity variations when measured on different days, showing an
average standard deviation of 1.32 intensity units in the whole color signal (coefficient of variation of 0.049) with 48 h of exposure time. However, the color signal tends to increase as times passes, therefore, the best procedure was to measure the sample as soon as the paper-based sensor is ready for analysis. Regarding dipping the paper-based sensor in deionized water, the color signals have some small deviations (Figure 3b). The average standard deviation in the whole color signal was equal to 2.10 intensity units (coefficient of variation of 0.072) with four immersions in water. Therefore, the sensor and the analyte seem to be well fixed to the paper and no content loss was systematically observed.
The copper screening result is shown in Figure 4. PCA
scores for the samples of Cu2+ ions (2.00 × 10⁻² mol L-1) are
differentiated from the others, presenting higher values of scores on PC 2 (25.22% of explained variance). As can be seen in Figure 4b, the score values on PC 2 were only
above 5 in presence of Cu2+, while most of the others were
negative. In fact, these results are coherent to the response of AAQX toward different cationic species in solutions
verified using UV-Vis analysis.33
Quantification of Cu2+
Initially, a univariate calibration attempt was made to
build a calibration curve for determining Cu2+ concentration
according to its reflectance signal. However, using the best
univariate curve (R2 = 0.892, coefficient of determination)
(as determined according to a homemade algorithm created
to select the best variable from the X matrix univariately
related to the concentration), the prediction error was
considered unsatisfactory (RMSEP = 1.83 × 10⁻² mol L-1).
Therefore, we preferred to use a multivariate calibration approach using partial least square (PLS) regressions Figure 3. (a) Reflectance color signal for the same sample acquired at
different time periods: 0, 24 and 48 h, and (b) reflectometer gray color signal for the same sample being 1 ×, 2 × , 3 × and 4 × dipped in water.
with the whole signal since the prediction error was
10 times smaller. Therefore, the quantification of Cu2+
in aqueous solution (2.00 × 10⁻⁵-6.00 × 10⁻² mol L-1)
was performed using PLS regression (4 latent variables, 97.98% of explained variance). The regression model was performed within the linear concentration range found for
the Cu2+ samples: 2.00 × 10⁻⁵-6.00 × 10⁻² mol L-1. Below
this concentration range, the signal is not bright enough to differentiate it from the blank sample; and above this concentration range, the signal saturates. The signals for
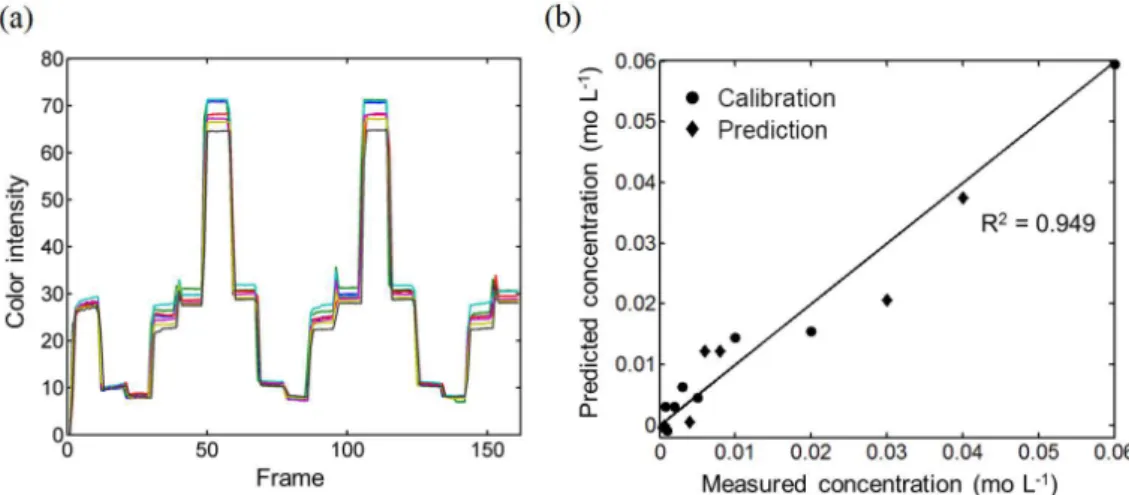
the Cu2+ samples within the linear concentration range are
shown in Figure 5. In addition, a paired t-test was performed
between the predicted and the measured concentrations and no statistical difference was observed at a confidence level of 95%. Table 2 summarizes the figures of merit (FOM) used to evaluate the quality of the PLS model.
As can be seen in Table 2, satisfactory results were observed for linear response, recovery, precision, limits of detection and quantification (LOD and LOQ, respectively) and analytical sensitivity for quantification
of Cu2+ using the PLS model. The linear range in terms of
Cu2+ concentration was higher than other values reported
in the literature,43-45 in which the proposed method was
able to measure Cu2+ concentration up to 3.81 g L-1; the
recovery was very close to previously reported values in
the literature (92.60-119.01%).43 The precision in terms of
relative standard deviation (RSD) was a little higher than
previously reported values (7.1-9.5%),43-45 which may be
caused by a lower signal-to-noise ratio of the webcam in comparison to spectrometric measurements. Also, the limit
of detection for Cu2+ was higher than other values reported
in the literature (usually in the range of mg L-1 to µg L-1).43-46 These lower values of limit of detection are achieved using more complex paper-based analytical devices, such as using metal nanoparticles or more complex manufacturing
techniques.43-46 The type of detector also improves the limit
of detection, as demonstrated using UV-Vis spectroscopy.43
On the other hand, the proposed method in this paper is very low-cost, simple and portable, presenting reliability
and feasibility to analyze Cu2+ in spiked water samples.
In addition, the video-based reflectometer can be used to analyze other metal ions by changing the type of paper sensor and the calibration curve utilized.
Figure 5. (a) Reflectance color signals for Cu2+ solutions in different concentrations (2.00 × 10⁻⁵-6.00 × 10⁻² mol L-1), and (b) experimentally measured
concentration of Cu2+vs. predicted concentration of Cu2+ by PLS model for calibration (, n = 13) and prediction (, n = 6) sets.
Table 2. Quality parameters determined for PLS model
Calibration parameter
Number of latent variables 4
Explained variance / % 97.98
Linear range / (mol L-1) 2.00 × 10⁻⁵-6.00 × 10⁻²
RMSECV / (mol L-1) 2.30 × 10⁻³
Bias at calibration / (mol L-1) 0.00
Prediction parameter
RMSEP / (mol L-1) 5.20 × 10⁻³
Bias at prediction / (mol L-1) 9.00 × 10⁻⁴
Linearity
Slope 0.979
Intercept 1.60 × 10⁻⁴
R 0.989
R2 0.979
Other FOM
Precisiona / % 11.45
Recovery / % 93.39-128.64
LOD / (mol L-1) 2.12 × 10⁻⁴
LOQ / (mol L-1) 7.11 × 10⁻⁴
Analytical sensitivity (γ) / (L mol-1) 4.13 × 10³
γ-1 / (mol L-1) 2.42 × 10⁻⁴
RMSECV: square error of cross validation; RMSEP: root-mean-square error of prediction; R: correlation coefficient; R2: coefficient of
determination; FOM: figures of merit; LOD: limit of detection; LOQ: limit of quantification. aPrecision calculated as relative standard deviation for
Conclusions
A simple homemade reflectometer based on an array
of LEDs was investigated in determining Cu2+ in aqueous
solution. In this proposal, a paper-based colorimetric sensor containing an organic chromophore (AAQX) was applied for quantitative colorimetric reflectance analysis. The obtained results clearly show that the method is relatively easy to be performed and presents good analytical results. The referred reflectometer was constructed from low price and commercially available components, such as LED, an Arduino microcontroller and a webcam. Finally, our method was able to demonstrate that this light visible-based reflectometer is quite feasible for application in the selective
detection of Cu2+, even with water coated onto the paper.
Supplementary Information
Supplementary information is available free of charge at http://jbcs.sbq.org.br as PDF file.
Acknowledgments
Camilo L. M. Morais and Lilian C. da Silva thank the Post-Graduate Program in Chemistry (PPGQ) of UFRN and CAPES. Kássio M. G. Lima thanks the CNPq (process No. 305962/2014-0).
References
1. Capitán-Vallvey, L. F.; Palma, A. J.; Anal. Chim. Acta 2011, 696, 27.
2. Overton, E. B.; Dharmasena, H. P.; Ehrmann, U.; Carney, K. R. F.; Anal. Chem. Technol. 1996, 1, 87.
3. Ouyang, Z.; Noll, R. J.; Cooks, R. G.; Anal. Chem. 2009, 81, 2421.
4. Ricci, C.; Nyadong, L.; Yang, F.; Fernandez, F. M.; Brown, C. D.; Newton, P. N.; Kazarian, S. G.; Anal. Chim. Acta 2008, 623, 178.
5. Lima, K. M. G.; Microchem. J. 2012, 103, 62.
6. Santos, P. M.; Pereira-Filho, E. R.; Rodriguez-Saona, L. E.; J. Agric. Food Chem. 2013, 61, 1205.
7. Kappes, T.; Hauser, P. C.; Anal. Commun. 1998, 35, 325. 8. Kuban, P.; Nguyen, H. T. A.; Macka, M.; Haddad, P. R.; Hauser,
P. C.; Electroanalysis 2007, 19, 2059.
9. Mai, T. D.; Pham, T. T. T.; Pham, H. V.; Sáiz, J.; Ruiz, C. G.; Hauser, P. C.; Anal. Chem.2013, 85, 2333.
10. Sáiz, J.; Duc, M. T.; Koenka, I. J.; Martín-Alberca, C.; Hauser, P. C.; García-Ruiz, C.; J. Chromatogr. A2014, 1372, 245. 11. Koenka, I. J.; Sáiz, J.; Rempel, P.; Hauser, P. C.; Anal. Chem.
2016, 88, 3761.
12. Marguí, E.; Hidalgo, M.; Queralt, I.; Van Meel, K.; Fontàs, C.; Spectrochim. Acta, Part B 2012, 67, 17.
13. Bui, D. A.; Hauser, P. C.; Anal. Chim. Acta2015, 853, 46. 14. Morais, C. L. M.; Carvalho, J. C.; Sant’Anna, C.; Eugênio, M.;
Gasparotto, L. H. S.; Lima, K. M. G.; Anal. Methods 2015, 7, 7917.
15. Fonseca, A.; Raimundo, I. M.; Anal. Chim. Acta 2007, 596, 66. 16. Lyra, W. S.; dos Santos, V. B.; Dionízio, A. G. G.; Martins,
V. L.; Almeida, L. F.; Gaião, E. N.; Diniz, P. H. G. D.; Silva, E. C.; Araújo, M. C. U.; Talanta 2009, 77, 1584.
17. Tôrres, A. R.; Lyra, W. S.; de Andrade, S. I. E.; Andrade, R. A. N.; da Silva, E. C.; Araújo, M. C. U.; Gaião, E. N.; Talanta
2011, 84, 601.
18. García, A.; Erenas, M. M.; Marinetto, E. D.; Abad, C. A.; de Orbe-Paya, I.; Palma, A. J.; Capitán-Vallvey, L. F.; Sens. Actuators, B 2011, 156, 350.
19. Yew, P. L.; Heng, L. Y.; Sens. Actuators, B 2014, 191, 719. 20. Tan, L. L.; Musa, A.; Lee, Y. H.; Sens. Actuators, B 2012, 173,
614.
21. Sundari, R.; Ahmad, M.; Heng, L. Y.; Sens. Actuators, B 2006, 113, 201.
22. Martínez-Máñez, R.; Sancenón, F.; Chem. Rev. 2003, 103, 4419. 23. Jeong, Y.; Yoon, J.; Inorg. Chim. Acta 2012, 381, 2.
24. Hu, J.; Wang, S.; Wang, L.; Li, F.; Pingguan-Murphy, B.; Lu, T. J.; Xu, F.; Biosens. Bioelectron. 2014, 54, 585.
25. Cate, D. M.; Adkins, J. A.; Mettakoonpitak, J.; Henry, C. S.; Anal. Chem. 2015, 87, 19.
26. Xia, Y.; Si, J.; Li, Z.; Biosens. Bioelectron.2016, 77, 774. 27. Meredith, N. A.; Quinn, C.; Cate, D. M.; Reilly III, T. H.;
Volckens, J.; Henry, C. S.; Analyst2016, 141, 1874.
28. Silva, T. G.; de Araujo, W. R.; Muñoz, R. A. A.; Richter, E. M.; Santana, M. H. P.; Coltro, W. K. T.; Paixão, T. R. L. C.; Anal. Chem.2016, 88, 5145.
29. Musile, G.; Wang, L.; Bottoms, J.; Tagliaro, F.; McCord, B.; Anal. Methods2015, 7, 8025.
30. Lin, Y.; Gritsenko, D.; Feng, S.; Teh, Y. C.; Lu, X.; Xu, J.; Biosens. Bioelectron. 2016, 83, 256.
31. Chen, G. H.; Chen, W. Y.; Yen, Y. C.; Wang, C. W.; Chang, H. T.; Chen, C. F.; Anal. Chem. 2014, 86, 6843.
32. Liana, D. D.; Raguse, B.; Gooding, J. J.; Chow, E.; Sensors
2012, 12, 11505.
33. da Silva, L. C.; da Costa, E. P.; Freitas, G. R. S.; de Souza, M. A. F.; Araújo, R. M.; Machado, V. G.; Menezes, F. G.; Inorg. Chem. Commun. 2016, 70, 71.
34. da Silva, L. C.; de Lima, D. F.; Silva, J. A.; de Morais, C. L. M.; Albuquerque, B. L.; Bortoluzzi, A. J.; Domingos, J. B.; Araújo, R. M.; Menezes, F. G.; Lima, K. M. G.; J. Braz. Chem. Soc.
2016, 26, 1067.
35. Christy, A. A.; Kvalheim, O. M.; Velapoldi, R. A.; Vib. Spectrosc.
1995, 9, 19.
37. Henning, C.; Liehr, K.; Girndt, M.; Ulrich, C.; Glomb, M. A.; J. Biol. Chem. 2014, 289, 28676.
38. Costa, T. S.; Rogez, H.; Pena, R. S.; LWT--Food Sci. Technol.
2015, 35, 314.
39. Wellischl, E.; Aganl, A.; Arker, E.; Sweetinq, O. J.; J. Appl. Polym. Sci.1960, 9, 331.
40. Hansen, M. R.; Young, R. H.; US pat. 6,521,0872003. 41. Liu, L.; Gao, Z.; Su, X.; Chen, X.; Jiang, L.; Yao, J.; ACS
Sustainable Chem. Eng. 2015, 3, 432.
42. Zhou, B.; Hu, X.; Zhu, J.; Wang, Z.; Wang, X.; Wang, M.; Int. J. Biol. Macromol. 2016, 91, 68.
43. Chaiyo, S.; Siangproh, W.; Apilux, A.; Chailapakul, O.; Anal. Chim. Acta 2015, 866, 75.
44. Sadollahkhani, A.; Hatamie, A.; Nur, O.; Willander, M.; Zargar, B.; Kazeminezhad, I.; ACS Appl. Mater. Interfaces
2014, 6, 17694.
45. Rattanarat, P.; Dungchai, W.; Cate, D.; Volckens, J.; Chailapakul, O.; Henry, C. S.; Anal. Chem.2014, 86, 3555.
46. Hossain, S. M. Z.; Brennan, J. D.; Anal. Chem.2011, 83, 8772.
Submitted: November 25, 2016