Key words: Nephrons; Surgery; Pathology; Radiography; Carcinoma, Renal Cell
Int Braz J Urol. 2013; 39: 189-94
__________________ Submitted for publication: July 09, 2012
__________________ Accepted after revision: January 10, 2013 Purpose: The determination of the size of a renal tumor is important for staging,
prog-nosis and selection of the appropriate surgical treatment. We investigated the difference of radiographic and pathologic size of renal tumors in a contemporary cohort of patients who underwent nephron sparing surgery and evaluated its clinical implications.
Materials and Methods: The records of 169 patients who received nephron sparing sur-gery for renal lesions suspicious for malignancy between January 2006 and December 2010 were reviewed retrospectively. Radiographic tumor size, defined as the largest dia-meter of tumor measured by CT images, and pathologic size, the largest diadia-meter of tumor measured in the surgical specimen, were compared and analyzed.
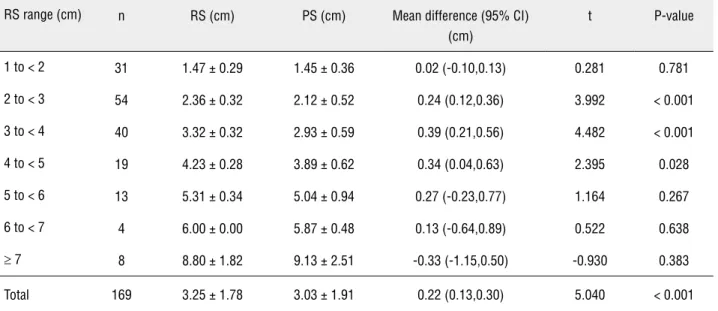
Results: Among all subjects, mean radiographic and pathologic tumor size were 3.25 ± 1.78 cm and 3.03 ± 1.91 cm, respectively (P < 0.001), with a discrepancy of just 0.22 cm. When the patients were categorized according to radiographic tumor size in the 1 cm range, the mean radiographic tumor size was significantly greater than pathologic tumor size in the following groups: 2 to 3 cm (P < 0.001), 3 to 4 cm (P < 0.001), and 4 to 5 cm (P = 0.028). When radiographic and pathologic tumor sizes were compared according to the pathologic tumor subtype, a significant difference was observed only among those with clear cell renal carcinoma (P < 0.001).
Conclusions: Renal tumor size was overestimated by radiography as compared with pa-thology. The difference was just 0.22 cm with little clinical significance, suggesting that CT provides an accurate method to estimate renal tumor size preoperatively.
INTRODUCTION
The determination of the size of a renal tu-mor is important for staging, prognosis and selec-tion of the appropriate surgical treatment. Several reports in the literature have concluded that the prognosis of renal tumor, including renal cell car-cinoma (RCC), was related to the pathologic size of the tumor (1,2). Meanwhile, the increased use of modern imaging techniques such as computed tomography (CT) has led to an increase in the in-cidental discovery of smaller renal masses. As a
result, nephron sparing surgery (NSS) has been developed and has become a standard surgical tre-atment for small renal masses. The oncologic ou-tcome is similar to that achieved with radical ne-phrectomy (RN) (3,4). The decision to perform NSS is mainly determined by the radiographic size, but not the pathologic size, of the renal mass as mea-sured by preoperative CT. Therefore, it is necessary to define the consistency between pathologic and radiographic sizes.
Several previous reports have shown a cer-tain degree of discrepancy between the
preopera-Comparison of radiographic and pathologic sizes of
renal tumors
_______________________________________________
Wei Chen, Linhui Wang, Qing Yang, Bing Liu, Yinghao Sun
Department of Urology, Changhai Hospital, Second Military Medical University, Shanghai, China
ABSTRACT
ARTICLE
INFO
tive size of renal tumors as measured by CT and the pathologic size as determined from surgical specimens (5-7). A difference in tumor size can alter patients’ status regarding tumor stage and prognosis. Also, such discrepancy may result in inadvertent exclusion of a significant number of patients from the opportunity to receive NSS. As maximum preservation of kidney function as well as adequate cancer control is important for the management of RCC, such potential discrepancy should be identified. In this study, we compared the radiographic and pathologic renal tumor si-zes of patients in our department who received open NSS or laparoscopic NSS. The main aim of our study was to determine if radiographic size is equal to pathologic size among renal tumors and, if not, whether radiography overestimates or un-derestimates tumor size and by how much.
MATERIALS AND METHODS
Upon securing approval from the institu-tional review board of our hospital, we reviewed the records of 169 patients who received open NSS or laparoscopic NSS for renal lesions suspected of malignancy from January 2006 to December 2010. Only the patients who underwent preoperative CT scans at our institution less than 4 weeks before undergoing surgery were included.
The size of renal tumors on contrast--enhanced CT scans was measured in three axes including the anterior-to-posterior, superior-to--inferior, and left-to-right axes. The radiographic size was accepted as the largest of these three dia-meters. Pathologic size was defined as the largest diameter of the tumor as determined by patholo-gic examination. In patients with multifocal renal tumors, the tumor with the largest diameter was evaluated. The measurement of tumor size by CT scan and pathologic size were performed by one radiologist and one pathologist.
The clinical informations, including each patient’s age, gender, tumor side, histologic sub-type and primary tumor classification, were recor-ded. The primary tumor classification was esta-blished according to the AJCC 7th edition of RCC TNM-staging system. In our study, patients were categorized according to radiographic tumor size
and pathological diagnoses. The mean values of radiographic and pathologic tumor size, along with differences in these sizes, were calculated for each category. The correlation between radiogra-phic and pathologic tumor size was also analyzed. All categorical variables were analyzed by either a two-tailed Fisher’s exact test or a Chi-square test, as appropriate. All continuous variables were analyzed by either a two-tailed Student’s t test or a one-way analysis of variance, as appropriate. Statistical Package for Social Sciences 17.0 sof-tware (SPSS Inc., Chicago, IL, USA) was used for statistical analysis. P values < 0.05 were conside-red statistically significant.
RESULTS
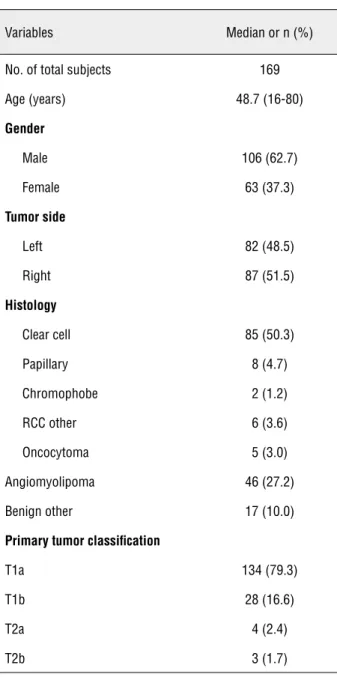
A total of 169 patients underwent NSS and were included in our study. A summary of the tient demographics is shown in Table-1. The pa-tients included 106 males and 63 females with an overall median age of 48.7 years. The majority pa-thologic subtypes were clear cell renal cell carci-noma and angiomyolipoma, accounting for 50.3% and 27.2% of all subjects, respectively. Among all the patients, there were about 134 patients with T1a clinical stage and 28 with T1b clinical sta-ge, accounting for 79.3% and 16.6%, respective-ly. Only 7 patients with T2 clinical stage received NSS. All tumors had no positive margins.
Among all subjects, mean radiographic tu-mor size and mean pathologic tutu-mor size were 3.25 ± 1.78 cm and 3.03 ± 1.91 cm, respectively (P < 0.001), which indicated that the mean radiographic tumor size was greater than the mean pathologic size (Table-2). However, the difference between ra-diographic and pathologic size was just 0.22 cm with little clinical significance. The relationship be-tween both measurements of tumor size is depicted in Figure-1 and indicates the existences of a strong correlation (r = 0.956, P < 0.001).
Table 1 - Patient Characteristics.
Variables Median or n (%)
No. of total subjects 169
Age (years) 48.7 (16-80)
Gender
Male 106 (62.7)
Female 63 (37.3)
Tumor side
Left 82 (48.5)
Right 87 (51.5)
Histology
Clear cell 85 (50.3)
Papillary 8 (4.7)
Chromophobe 2 (1.2)
RCC other 6 (3.6)
Oncocytoma 5 (3.0)
Angiomyolipoma 46 (27.2)
Benign other 17 (10.0)
Primary tumor classification
T1a 134 (79.3)
T1b 28 (16.6)
T2a 4 (2.4)
T2b 3 (1.7)
RCC, renal cell carcinoma
ranges of ≥ 2 cm and < 3 cm, ≥ 3 cm and < 4 cm,
≥ 4 cm and < 5 cm.
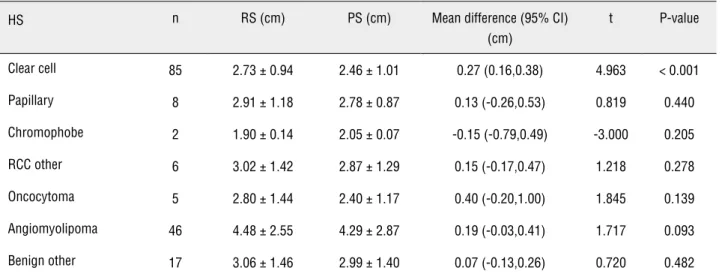
When radiographic and pathologic tumor sizes were compared according to pathologic tu-mor subtypes, a significant difference between radiographic and pathologic tumor size was ob-served only among those with clear cell RCC (P < 0.001) (Table-3). Among the 85 patients with clear cell histology, tumor size was overestimated by
0.27 cm on CT. The tumor sizes were underesti-mated only in those with chromophobic RCC but overestimated in other pathologic subtypes.
DISCUSSION
The discrepancy between radiographic and pathologic renal tumor size has been discussed in previous reports (5-8). To the best of our knowled-ge, we present the largest comparison of radiogra-phic and pathologic tumor size for patients with a renal mass treated by NSS. Consistent with some previous observations, in our study, radiographic size overestimated the pathologic size when com-paring all patients, but the overall difference be-tween radiographic and pathologic sizes was only 0.22 cm. Although it was statistically significant, we do not think this disparity represents a clini-cally significant result.
In our series, subgroup analysis showed that the discrepancy between radiographic and pathologic size increased with tumor size in the range of 0 to 4 cm. However, the discrepancy de-creased with inde-creased tumor size, when the tu-mors were larger than 4 cm. The radiographic size overestimated the pathologic size in all groups ex-cept the tumors with sizes exceeding 7 cm, but the discrepancy had little significance because only 8 patients were included in this group. The largest gap between the two measurements occurred in tumors of 3 to 4 cm in size, which was different from some previous studies (5-7). When evalua-ting the subgroups according to 1 cm intervals, Schlomer et al. (5) and Kurta et al. (6) found that the largest differences in size were in patients with tumors of 4 to 5 cm, while Lee et al. (7) considered that the largest differences occurred in patients with tumors of < 1 cm in size.
situation is different if the size of the tumor was larger than 4 cm. In the group with tumor sizes ranging from 4 to 5 cm, pathologic size was smal-ler than radiographic size. In some centers, a tu-mor size of 4 cm is still regarded as the cutoff between RN and NSS. According to our findings, a portion of patients with renal tumors slightly larger than 4 cm measured by CT, with actually pathologic size less than 4 cm, should receive NSS instead of RN. Recent studies have shown that PN
for renal tumors provides superior intermediate--term preservation of renal function compared with RN (12,13). In addition, chronic renal failure is more prevalent than previously thought among patients with a renal mass and more than 25% of all patients with a renal mass have at least Grade 3 chronic kidney disease at presentation (14). It is therefore necessary to perform NSS for renal tumors to preserve renal function. Based on our results, we suggest that the threshold of tumor size of 4 cm for NSS should been expanded to some extent, and patients with tumors slightly larger than 4 cm could be offered elective NSS with proper informed consent, which is in agree-ment with previous studies (5,7). In our study, all tumors had no positive margins. Without doubt, whether tumors were smaller than 4 cm or sli-ghtly larger than 4 cm, it is necessary to keep the margin negative. Obviously, preoperative planning for NSS for a renal lesion also requi-res consideration of its location (exophytic vs. intrarenal, central vs. peripheral, hilar vs. polar) and relation to surrounding structures (main re-nal vessels, collecting system, colon).
Histological subtype is also an impor-tant prognostic indicator for patients with renal tumors. Several studies have showed that there is correlation among tumor size, histology, and Table 2 - The mean radiologic and pathologic tumor size (in the 1-cm radiologic category and clinical stage).
RS range (cm) n RS (cm) PS (cm) Mean difference (95% CI) (cm)
t P-value
1 to < 2 31 1.47 ± 0.29 1.45 ± 0.36 0.02 (-0.10,0.13) 0.281 0.781
2 to < 3 54 2.36 ± 0.32 2.12 ± 0.52 0.24 (0.12,0.36) 3.992 < 0.001
3 to < 4 40 3.32 ± 0.32 2.93 ± 0.59 0.39 (0.21,0.56) 4.482 < 0.001
4 to < 5 19 4.23 ± 0.28 3.89 ± 0.62 0.34 (0.04,0.63) 2.395 0.028
5 to < 6 13 5.31 ± 0.34 5.04 ± 0.94 0.27 (-0.23,0.77) 1.164 0.267
6 to < 7 4 6.00± 0.00 5.87 ± 0.48 0.13 (-0.64,0.89) 0.522 0.638
≥ 7 8 8.80± 1.82 9.13 ± 2.51 -0.33 (-1.15,0.50) -0.930 0.383
Total 169 3.25 ± 1.78 3.03 ± 1.91 0.22 (0.13,0.30) 5.040 < 0.001
metastatic potential (15,16). Tumors with histo-logy other than clear cell carcinoma appear to have a favorable prognosis and to be suitable for NSS, regardless of tumor size (17). Kurta et al. (6) evaluated the difference between mean CT tumor size and mean pathological size within each histological subgroup, and they found that there were statistically significant differences in the clear cell and papillary types, but the diffe-rences were small and unlikely to be clinically significant. Lee et al. (7) found that a significant difference was observed among those with cle-ar cell RCC and papillcle-ary RCC, and pathologic tumor size was overestimated in clear cell RCC while underestimated in papillary RCC. In our series, statistically significant differences betwe-en radiographic and pathologic tumor size were observed only for clear cell tumors. The differen-ce was small (0.27 cm) with no clinical signifi-cance, which was similar to the result obtained by Kurta et al. (6).
The present study has several limitations. Firstly, our study was a retrospective, single--institution analysis of patients. A standardized, prospective study would more definitively cha-racterize the relationship between the radiogra-phic and pathologic size of renal tumors. Secon-dly, although the time from the CT examination to the operation was limited to 4 weeks, it was
not certain that the size of the renal tumor had remained the same throughout this period. Thir-dly, the parameters measured in CT scans or spe-cimens may be inaccurate, which would influence the analysis. Much of some potential errors, such as measurement errors, differences in transverse diameter orientation, would have been avoided in a prospective study, where the methods of measu-rement would have to follow a definite procedure. Finally, formalin fixation may shrink the patholo-gic specimen to some extent.
CONCLUSIONS
In summary, we found a statistically sig-nificant overestimation of renal tumor size when comparing radiographic with pathologic size. Nevertheless, the overall difference was only 0.22 cm. Among the tumors with sizes ranging from 4 to 5 cm, radiographic tumor size was sig-nificantly larger than pathologic size. This result may affect decisions to perform NSS in some patients with a radiographic tumor size slightly larger than 4 cm. In spite of slight overestima-tion of radiographic size compared with patho-logic size, and with the expansion of indication for NSS, we believe that CT scans would be ap-propriate for staging and selection of treatment approaches for renal tumors.
Table 3 - The mean radiologic and pathologic tumor sizes according to histological subtype.
HS n RS (cm) PS (cm) Mean difference (95% CI) (cm)
t P-value
Clear cell 85 2.73 ± 0.94 2.46 ± 1.01 0.27 (0.16,0.38) 4.963 < 0.001
Papillary 8 2.91 ± 1.18 2.78 ± 0.87 0.13 (-0.26,0.53) 0.819 0.440
Chromophobe 2 1.90 ± 0.14 2.05 ± 0.07 -0.15 (-0.79,0.49) -3.000 0.205
RCC other 6 3.02 ± 1.42 2.87 ± 1.29 0.15 (-0.17,0.47) 1.218 0.278
Oncocytoma 5 2.80 ± 1.44 2.40 ± 1.17 0.40 (-0.20,1.00) 1.845 0.139
Angiomyolipoma 46 4.48± 2.55 4.29 ± 2.87 0.19 (-0.03,0.41) 1.717 0.093
Benign other 17 3.06 ± 1.46 2.99 ± 1.40 0.07 (-0.13,0.26) 0.720 0.482
ACKNOWLEDGEMENTS
This study was supported by the Mu-nicipal Hospital’s Project for Emerging and Frontier Technology of Shanghai China (No. SHDC12010115).
ABBREVIATIONS
RCC = Renal Cell Carcinoma
CT = Computed Tomography
NSS = Nephron Sparing Surgery
RN = Radical Nephrectomy
CONFLICT OF INTEREST
None declared.
REFERENCES
1. Lughezzani G, Jeldres C, Isbarn H, Perrotte P, Shariat SF, Sun M, et al.: Tumor size is a determinant of the rate of stage T1 renal cell cancer synchronous metastasis. J Urol. 2009; 182: 1287-93. 2. Ku JH, Moon KC, Kwak C, Kim HH: Metachronous meta-static potential of small renal cell carcinoma: dependence on tumor size. Urology. 2009; 74: 1271-5.
3. Roos FC, Brenner W, Müller M, Schubert C, Jäger WJ, Thüroff JW, et al.: Oncologic long-term outcome of elec-tive nephron-sparing surgery versus radical nephrectomy in patients with renal cell carcinoma stage pT1b or greater in a matched-pair cohort. Urology. 2011; 77: 803-8. 4. Weight CJ, Lieser G, Larson BT, Gao T, Lane BR, Campbell
SC, et al.: Partial nephrectomy is associated with improved overall survival compared to radical nephrectomy in pa-tients with unanticipated benign renal tumours. Eur Urol. 2010; 58: 293-8.
5. Schlomer B, Figenshau RS, Yan Y, Bhayani SB: How does the radiographic size of a renal mass compare with the pathologic size? Urology. 2006; 68: 292-5.
6. Kurta JM, Thompson RH, Kundu S, Kaag M, Manion MT, Herr HW, et al.: Contemporary imaging of patients with a renal mass: does size on computed tomography equal pathological size? BJU Int. 2009; 103: 24-7.
7. Lee SE, Lee WK, Kim DS, Doo SH, Park HZ, Yoon CY, et al.: Comparison of radiographic and pathologic sizes of renal tumors. World J Urol. 2010; 28: 263-7.
8. Herr HW, Lee CT, Sharma S, Hilton S: Radiographic versus pathologic size of renal tumors: implications for partial ne-phrectomy. Urology. 2001; 58: 157-60.
9. Coffin G, Hupertan V, Taksin L, Vaessen C, Chartier-Kastler E, Bitker MO, et al.: Impact of elective versus imperative indications on oncologic outcomes after open nephron-sparing surgery for the treatment of sporadic renal cell carcinomas. Ann Surg Oncol. 2011; 18: 1151-7.
10. Roos FC, Brenner W, Jäger W, Albert C, Müller M, Thüroff JW, et al.: Perioperative morbidity and renal function in young and elderly patients undergoing elective nephron-sparing surgery or radical nephrectomy for renal tumours larger than 4 cm. BJU Int. 2011; 107: 554-61.
11. Becker F, Roos FC, Janssen M, Brenner W, Hampel C, Siemer S, et al.: Short-term functional and oncologic outcomes of nephron-sparing surgery for renal tumours ≥ 7 cm. Eur Urol. 2011; 59: 931-7.
12. Deklaj T, Lifshitz DA, Shikanov SA, Katz MH, Zorn KC, Shalhav AL: Laparoscopic radical versus laparoscopic partial nephrec-tomy for clinical T1bN0M0 renal tumors: comparison of peri-operative, pathological, and functional outcomes. J Endourol. 2010; 24: 1603-7.
13. Lane BR, Fergany AF, Weight CJ, Campbell SC: Renal func-tional outcomes after partial nephrectomy with extended ischemic intervals are better than after radical nephrectomy. J Urol. 2010; 184: 1286-90.
14. Huang WC, Levey AS, Serio AM, Snyder M, Vickers AJ, Raj GV, et al.: Chronic kidney disease after nephrectomy in pa-tients with renal cortical tumours: a retrospective cohort study. Lancet Oncol. 2006; 7: 735-40.
15. Remzi M, Ozsoy M, Klingler HC, Susani M, Waldert M, Seitz C, et al.: Are small renal tumors harmless? Analysis of his-topathological features according to tumors 4 cm or less in diameter. J Urol. 2006; 176: 896-9.
16. Skolarus TA, Serrano MF, Berger DA, Bullock TL, Yan Y, Hum-phrey PA, et al.: The distribution of histological subtypes of renal tumors by decade of life using the 2004 WHO classifica-tion. J Urol. 2008; 179: 439-43; discussion 443-4.
17. Onishi T, Oishi Y, Yanada S, Abe K, Hasegawa T, Maeda S: Prognostic implications of histological features in patients with chromophobe cell renal carcinoma. BJU Int. 2002; 90: 529-32.
_____________________
Correspondence address: