RESUMO
Objetivos: Estabelecer uma base de dados normativa numa população pediátrica portuguesa da espessura da camada de fibras nervosas da retina (CFNR), espessura macular (EM), camada de células ganglionares-plexiforme interna (CGPI) e espessura subfoveal coroideia.
Métodos: Estudo transversal em crianças dos 4 aos 17 anos. Todas as crianças foram submetidas a exame oftalmológico e Tomografia de Coerência Ótica (Cirrus Optical Coherence Tomography–OCT).
Resultados: Um total de 348 crianças (9,85±3,49 anos) foram incluídas. A espessura média da CFNR foi de 97,45±9,78μm, a distribuição esteve de acordo com a regra ISNT e apresentou uma relação positiva com a área de disco ótico (DO) (p=0,007). Ao nível dos quadrantes inferior e nasal foi verificada uma relação positiva com a área DO (p=0,001 e p=0,04, respetivamente) e equivalente esférico (ES) (p=0,008 e p=0,004, respetivamente). A EM média foi de 282,22±11.91μm. O campo central apresentou a menor espessura, seguido do anel externo e do anel interno (p<0,001). A idade, ES e género foram os preditores significativos da EM. Verificou-se uma associação negativa com a idade no anel interno superior (p=0,009). Constatou-se uma diminuição da EM externa com refrações negativas (p<0,05). Na globalidade, os rapazes apresentaram maior EM (p<0,05). A espessura média da CGPI foi de 84,97±4,78μm e da coroideia foi de 374,76±42,51μm.
Conclusão: Este estudo estabelece uma base de dados normativa obtida com SD-OCT numa população de crianças portuguesas dos 4 aos 17 anos. Estes dados podem melhorar a capacidade diagnóstica de glaucoma juvenil e patologia retiniana em idade pediátrica, bem como do seu seguimento.
ABSTRACT
Purpose: To establish normative values in a Portuguese pediatric population for retinal nerve fiber layer (RNFL), macular, macular ganglion cell-inner plexiform layer (GCIPL) and subfoveal choroidal (SFC) thicknesses.
Methods: This cross-sectional study enrolled children, 4 to 17 years old, attending the Ophthalmology Department of Hospital de Braga. All subjects underwent comprehensive ophthalmologic examination and were scanned with Cirrus Spectral-Domain Optical Coherence Tomography (SD-OCT).
Results: A total of 348 children (9.85±3.49 years) were included. Average RNFL thickness was 97.45±9.78µm and the distribution of RNFL thickness was in agreement with the ISNT rule. Average RNFL thickness showed a positive significant relationship with optic disc (OD) area (p=0.007). A significant positive relationship was also found for OD area (p=0.001 and
p=0.04, respectively) and spherical equivalent (SE) (p=0.008 and p=0.004, respectively), in the
inferior and nasal quadrants. Average macular thickness was 282.22±11.91µm. Central subfield was the thinnest region, followed by the external ring, while the internal ring was the thickest (p0.001). Age, SE and gender were the strongest predictors of macular thickness. A negative association was found between the superior external macular thickness and age (p=0.009). A lower thickness in the outer macular region was associated with higher myopic refractive error (p0.05). Boys had on average a thicker macula (p0.05). Average GCIPL thickness was 84.97±4.78 µm and average SFC thickness was 374.76±42.51 µm.
Conclusion: This study established a SD-OCT normative database for healthy Portuguese children aged 4 to 17 years old, which could improve diagnosis and management of pediatric ophthalmic disorders in children.
Key words: Child; Macula Lutea; Retina; Tomography, Optical Coherence.
INTRODUÇÃO
Optical coherence tomography (OCT) is a non-invasive optical imaging technique that provides high resolution and cross-sectional in vivo imaging of the retina, from the internal limiting membrane, passing through the retinal nerve fiber layer (RNFL), to the retinal pigmented epithelium and choroid, the optic nerve head and macula.7,31 Currently, the technology used for optical tomography is the spectral-domain OCT (SD-OCT), which grants higher resolution images, reduced vulnerability to involuntary eye movement artifacts and improved topographic delimitation of ocular structures when compared to time-domain OCT (TD-OCT).19,23,35
Ultimately, OCT has become a valuable tool for diagnosis and management of several potentially blinding eye diseases, such as glaucoma, macular hole, diabetic macular edema and epiretinal membrane.7,24 The SD-OCT can be used in many pediatric patients because it is a non-invasive, quantitative, reproducible and innocuous imaging method with a short exposure time and a high image resolution.7,40 However, for the scans to be most useful for the diagnosis and management of diseases, quantitative measures should be compared to age-matched normal controls.9,31 Normal values for children are not currently available from manufacturers, and normative studies of children for SD-OCT are scarce in the literature.2,4,8,11,14,15,22,28,40,41
The aim of this study was to determine normative values in a Caucasian Portuguese pediatric population for RNFL, macular, macular ganglion cell-inner plexiform layer (GCIPL) and subfoveal choroidal (SFC) thicknesses. Moreover, we aim to study mean thickness distribution between gender and to investigate which variables [gender, age, optic disc (OD) area and refraction] may help predict the thickness of these OCT parameters.
MATERIALS AND METHODS
Design of the study and study population
This cross-sectional study enrolled Caucasian Portuguese children, 4 to 17 years old, attending the Ophthalmology Department of the Hospital de Braga who met the following inclusion criteria: monocular best- -corrected visual acuity of at least 0 logarithm of the minimum angle of resolution (logMAR) and spherical equivalent (SE) refractive error between ± 5 diopters (D). Exclusion criteria were the following: preterm birth; history or evidence of amblyopia or strabismus; family history of glaucoma; abnormalities detected with direct ophthalmoscopy or slit lamp; history of intraocular surgery or ocular trauma; and delayed psychomotor development. This study was approved by the Ethics Committee from both Hospital de Braga and the Life and Health Sciences Research Institute. Written informed consent was obtained from the children’s parents prior to data collection.From the 1250 children observed from June 2014 to December 2017, 898 did not meet the requirements to be included in this study due to: evidence of amblyopia or strabismus (65.0%); preterm birth (12.0%); abnormalities detected with slit lamp (8.2%); delayed psychomotor development (7.9%); history of intraocular surgery or ocular trauma (4.9%); SE refractive error >5D (1.3%); and family history of glaucoma (0.7%). In the end, a total of 352 children underwent OCT. All subjects were evaluated by a pediatric ophthalmology specialist and underwent a comprehensive and systematic protocol including an orthoptic evaluation, a slit lamp biomicroscopy and non-dilated pupil fundoscopy. Best-correct monocular visual acuity was assessed with Sloan, tumbling E or Allen optotypes. Refractive error was assessed under subjective refraction measured with autorefractometer (Topcon KR – 8900). Cycloplegia was induced by applying 3 drops, 5
minutes apart, of cyclopentolate 1%, when clinically required. Information from each subject, including age, gender, personal and family medical history was collected from the clinical records.
OCT imaging
Measurements of RNFL, macular, GCIPL and SFC thicknesses were obtained by means of SD-OCT (Cirrus HD-OCT, model 4000; Carl Zeiss Meditec). Since optical and image acquisition speed in this model allow quality images to be obtained from a pupil diameter of 2.5 mm, all procedures were carried out with no pupil dilation. All procedures were performed by two investigators only (TQ and FF) and using the same device. Right eyes of all subjects were used for analysis. Three scans of each protocol were taken for each eye and the median value was registered.
The Cirrus protocol Optic Disc Cube 200×200 was used to measure the thickness of RNFL (global average thickness, thickness by quadrant and individual thickness for twelve 30º sectors) and OD area. Macular Cube 512×128 protocol was used to measure macular thickness (MT) and volume. This protocol displays the average thickness of nine sectors composed by three circles with 1, 3 and 6 mm of diameter, plus the volume cube. Both 3 and 6 mm circles are divided in four quadrants. The protocol Ganglion Cell Analysis: Macular Cube 512×128 was used to measure GCIPL thickness. An algorithm incorporated in Cirrus HD-OCT software was used to measure the GCIPL thickness within a 14.13 mm2 elliptical annulus area centered on the fovea. This algorithm delineates both RNFL and IPL outer boundaries, enabling the measurement of the GCIPL thickness from the segmented layer between these two boundaries.39 SCT was measured using HD 5 Line raster protocol. The choroid was visualized with the enhance depth imaging (EDI) system. Using Cirrus linear measurement tool, SCT thickness was measured at the fovea, perpendicularly from the outer edge of the hyper-reflective retinal pigment epithelium to the inner sclera.37
To acquire the scans, the patient’s head was aligned with the equipment, and then the patient’s pupil was manually focused on a video screen. Internal fixation was used in all cases to center the scans. Images with a signal strength ≤5, poorly centered, with motion artifacts or incomplete were excluded from the study, resulting in four
OCT scans being excluded due to lack of quality images on all protocols.
Statistical analysis
Data from OCT scans and clinical files was entered and analyzed with SPSSv23 (IBM®). Normality was verified by the Kolmogorov-Smirnov test, skewness, kurtosis and histogram analysis, and by the Z-score for variables with less than 300 subjects. Subsequent descriptive statistics were carried out to study sample characterization. An independent samples t-test was used for comparison of variables between genders. Chi-squared test was used to evaluate interdependence between genders. Measures of central tendency, dispersion and percentiles (P99, P95, P5, P1) were calculated for all variables acquired from the OCT. Repeated-measures ANOVA with Bonferroni correction was used to compare RNFL quadrants, macular regions and GCIPL regions and determine the difference between means, allowing to identify which pair averages were significantly different. A Pearson correlation coefficient was computed to assess the relationship between thickness values and the OD area. Finally, a multiple linear regression was used to allow the estimation of RNFL, macular, GCIPL and SFC thicknesses (dependent variables) according to gender, age, OD area and refraction (independent variables).
The results are show as mean ± standard deviation (SD). Statistical significance was defined as p-value ≤ 0.05 (95% confidence interval).
RESULTS
Study population characterization
A total of 348 children (201 female – 57.8%), aged on average 9.85 ± 3.49 years, were included in the final sample. The average SE was -0.48 ± 1.38 D (range from -4.63 to 4.31 D), without any statistically significant difference between genders (p=0.240, independent t-test). OD area was acquired in 124 study subjects. Mean OD area was 2.02 ± 0.38 mm2 (range from 1.39 to 3.26 mm2), without any statistically significant difference between genders (p=0.423, independent t-test).
From the 348 subjects enrolled in the study, 324 were evaluated with a RNFL thickness study, while 346 had a
MT study. After an upgrade on the acquisition software, which allowed the evaluation of new data, GCIPL thickness was assessed in 116 study subjects and SCT in 129. Note that the differences in sample size are related to the implicit differences in patient collaboration between acquisition protocols.
RFNL Thickness
RNFL thickness measurements of the right eye are summarized in Table 1. The results show significant differences between quadrants [F (3, 321) = 1788,
p0.001, 2 = 0.94; repeated-measures ANOVA]. The
mean inferior and superior quadrant thicknesses were larger than both nasal and temporal quadrant thicknesses. Tabela 1 - Means and Percentiles of RNFL thickness measurements acquired from 324 children RNFL Thickness (µm) Mean (SD) P99 P95 P5 P1 Average Thickness 97.45 (9.78) 125.50 113.00 82.25 75.50 SQ 123.89 (18.39) 175.00 152.75 98.00 76.75 IQ 127.26 (17.65) 180.00 156.00 100.00 87.00 TQ 67.93 (10.18) 95.00 85.00 52.00 47.25 NQ 70.41 (11.73) 102.00 91.00 52.00 45.25 Sector 1 113.86 (25.26) 181.75 158.00 76.00 53.00 Sector 2 94.59 (21.44) 147.50 130.00 62.25 46.75 Sector 3 61.13 (18.72) 120.75 104.50 40.00 35.25 Sector 4 64.54 (15.03) 105.50 93.00 44.00 39.00 Sector 5 99.36 (27.99) 176.00 149.00 57.25 42.75 Sector 6 131.48 (31.10) 213.25 181.75 83.25 64.25 Sector 7 137.58 (22.74) 183.75 175.00 98.50 78.50 Sector 8 86.19 (29.78) 169.50 151.75 53.00 45.75 Sector 9 55.80 (13.72) 103.50 85.50 41.00 36.00 Sector 10 73.28 (17.32) 117.50 102.75 45.00 37.25 Sector 11 122.12 (32.81) 192.50 169.00 65.25 53.25 Sector 12 129.06 (29.83) 198.25 174.00 84.00 57.25
RNFL: retinal nerve fiber layer; SD: standard deviation; P: percentile; SQ: superior quadrant; IQ: inferior quadrant; TQ: temporal quadrant; NQ: nasal quadrante.
Mean RNFL thickness differences between genders were found to be significant for the average RNFL and the inferior quadrant thicknesses [F (322) = 0.018, t=−2.188, p=0.029 and F (322) = 0.394, t=−2.587, p=0.010, respectively; independent t-test]; in both cases, RNFL thickness was greater on the female gender (Table 2).
Table 2 - Mean RNFL Thicknesses comparison between genders RNFL Thickness (µm) Mean (SD) p-value Male Female Average Thickness 96.07 (9.95) 98.47 (9.56) SQ 122.82 (17.86) 124.66 (18.78) IQ 124.32 (17.85) 129.41 (17.24) TQ 67.35 (10.07) 68.35 (10.26) NQ 69.85 (10.94) 70.81 (12.30)
RNFL: retinal nerve fiber layer; SD: standard deviation; SQ: superior quadrant; IQ: inferior quadrant; TQ: temporal quadrant; NQ: nasal quadrant
A positive correlation was observed between average RNFL thickness and OD area (r(124)=0.260; p=0.004; r2=0.068).
The multiple linear regression results for RNFL thickness are summarized in Table 3. In summary, for each increase of 1 mm2 on the OD area, the average thickness, and the inferior and nasal quadrants increase 6.4 µm, 13.9 µm and 6.2 µm, respectively. In addition, for each positive SE diopter, the inferior and nasal quadrants’ thickness increase 3 µm and 2.3 µm, respectively. Gender was considered a significant predictor for inferior quadrant thicknesses, with a mean increase of 10.5 µm in females. Age was not a significant predictor of RNFL thickness.
Table 3 - Results of Multiple Linear Regression for RNFL thicknesses RNFL Thickness (µm) IV F(4.117) B beta (β) t(117) p-value R2 AJ Average Thickness Gender 3.5000 p=0.010 3.059 0.146 1.672 0.097 0.076 Age -0.008 -0.003 -0.031 0.976 OD area 6.391 0.249 2.728 0.007 SE 0.896 0.130 1.441 0.152 SQ Gender 1.137; p=0.343 -0.194 -0.005 -0.053 0.958 0.004 Age -0.472 -0.086 -0.086 0.377 OD area 7.637 0.153 0.153 0.108 SE -0.782 -0.058 -0.058 0.534 IQ Gender 7.507; p<0.001 10.481 0.262 3.180 0.002 0.176 Age 0.332 0.061 0.697 0.487 OD area 13.894 0.284 3.292 0.001 SE 3.040 0.231 2.714 0.008 TQ Gender 1.918; p=0.112 2.540 0.129 1.438 0.153 0.029 Age -0.467 -0.175 -1.831 0.070 OD area -2.017 -0.083 -0.891 0.375 SE -1.085 -0.167 -1.807 0.073 NQ Gender 3.491; p=0.012 -0.482 -0.018 -0.207 0.836 0.076 Age 0.519 0.144 1.544 0.125 OD area 6.191 0.190 2.075 0.040 SE 2.302 0.262 2.907 0.004
--- adjusted regression model not significant (p 0.05)
RNFL: retinal nerve fiber layer; IV: independent variables; OD: optic disc; SE: spherical equivalent; SQ: superior quadrant; IQ: inferior quadrant; TQ: temporal quadrant; NQ: nasal quadrant; R2AJ: adjusted R-squared.
Macular Thickness
The measurements obtained with the Macular Cube 512×128 protocol and the respective percentiles for the right eye are listed in Table 4. Statistically significant differences were observed between the mean thickness of the central subfield (251.65 ± 20.05 µm), the internal ring (316.73 ± 14.05 µm) and the external ring (280.64 ± 12.21 µm) [F (2, 342) = 2382, p0.001, 2 = 0.933, repeated-
-measures ANOVA]. Central subfield thickness was the lowest, followed by the external ring thickness and finally the internal ring thickness. Comparison of regions from the same ring revealed that the nasal region was the thickest, followed by the superior, the inferior and the temporal region, in both internal [F (3, 342) = 492,
p0.001, 2 = 0.81; repeated-measures ANOVA] and
external rings [F (3, 338) = 1741, p0.001, 2=0.94; repeated-measures ANOVA].
Table 4 - Means and Percentiles of MT and volume measurements acquired from 346 children. MT (µm) Mean (SD) P99 P95 P5 P1 Average thickness 282.22 (11.91) 310.65 301.00 261.25 252.45 Central subfield 251.65 (20.08) 299.16 286.00 216.90 208.30 Internal ring Superior 320.46 (15.00) 357.08 345.00 294.30 282.46 Inferior 317.25 (15.43) 353.62 340.70 294.30 263.84 Temporal 308.00 (14.34) 344.08 332.00 284.30 277.92 Nasal 321.52 (15.60) 359.62 348.00 298.30 286.30 External ring Superior 284.25 (14.62) 326.55 310.75 261.25 251.90 Inferior 273.00 (13.43) 313.12 296.60 253.00 242.88 Temporal 264.40 (12.97) 298.62 286.00 244.00 236.00 Nasal 301.11 (14.19) 332.55 323.75 277.25 269.00 Volume Cube (mm3) 10.16 (0.43) 11.16 10.80 9.40 9.10
MT: macular thickness; SD: standard deviation; P: percentile.
MT comparison between genders revealed a statistically significant thicker macula in males, specifically for central subfield [F (343) = 0.091, t=4.422, p<0.01], internal ring’s inferior [F (343) = 3.203, t=3.877, p<0.01], temporal [F (343) = 2.315, t=5.133, p<0.01], and nasal regions [F (343) = 4.799, t=4.378, p<0.01] [independent t-test], as well as the external ring’s temporal region [F (343) = 4.121, t=2.516, p=0.012, independent t-test] (Table 5).
Table 5. Mean MT and volume comparison between genders.
MT (µm) Mean (SD) p-value Male Female Average thickness 283.01 (12.42) 281.63 (11.52) 0.291 Central subfield 257.08 (20.09) 247.66 (19.16) <0.001 Internal ring Superior 322.96 (16.55) 318.63 (13.49) 0.008 Inferior 320.93 (16.29) 314.54 (14.21) <0.001 Temporal 312.47 (14.83) 304.72 (13.07) <0.001 Nasal 325.70 (17.12) 318.45 (13.63) <0.001 External ring Superior 284.82 (15.59) 283.83 (13.89) 0.539 Inferior 272.22 (14.58) 273.57 (12.52) 0.360 Temporal 266.44 (13.87) 262.91 (12.09) 0.012 Nasal 301.34 (14.82) 300.94 (13.71) 0.796 Volume Cube (mm3) 10.19 (0.41) 10.14 (0.45) 0.292
MT: macular thickness; SD: standard deviation
No correlation was observed between average MT and OD area (r(123)=-0.035;p=0.697).
Table 6 shows the multiple linear regression concerning MT. Gender was found to be a statistically significant predictor of all macular thickness parameters, except for the external inferior region, as well as volume cube. Overall, according to our results, female gender is expected to present a thinner MT in these regions. Age was found to be a predictor of superior external region thickness, presenting a negative association with it (p=0.009). OD area also had an association with the mean internal ring thickness and superior, temporal and nasal regions, with a decrease of approximately 8 µm, 8 µm, 9µm and 9 µm, respectively, for every square millimeter increase in OD area (all p values <0.05). SE was associated with the mean external ring thickness, and superior and temporal regions, and with volume cube, being observed an increase of approximately 2 µm in thickness and 0.1 mm3 for volume cube for every positive D increase in SE.
Table 6 - Results of Multiple Linear Regression for MT and volume MT(µm) IV F(4.118) B beta (β) t(118) p-value R2 AJ Average Thickness Gender 2.950; p=0.023 -6.185 -0.240 -2.727 0.007 0.060 Age 0.434 0.125 1.325 0.188 OD area -1.286 -0.041 -0.443 0.659 SE 1.532 0.180 1.987 0.049 Central subfield Gender 4.252; p=0.003 -12.576 0.294 -3.402 0.001 0.096 Age 0.666 0.115 1.249 0.214 OD area -4.961 -0.095 -1.048 0.297 SE -1.427 -0.101 -1.136 0.258 Internal ring Mean Gender 5.927; p>0.001 -10.000 -0.326 -3.861 <0.001 0.139 Age 0.435 0.105 1.163 0.247 OD area -8.552 -0.227 -2.579 0.011 SE 0.090 0.009 0.102 0.919 Superior Gender 3.699; p=0.007 -8.118 -0.246 -2.820 0.006 0.081 Age 0.479 0.107 1.153 0.251 OD area -8.082 -0.200 -2.192 0.030 SE 0.368 0.034 0.376 0.707 Inferior Gender 4.603; p=0.002 -10.515 -0.301 -3.500 0.001 0.106 Age 0.535 0.113 1.234 0.220 OD area -7.778 -0.182 -2.022 0.045 SE 0.184 0.016 0.180 0.858 Temporal Gender 6.190; p<0.001 -10.781 -0.349 -4.148 <0.001 0.145 Age 0.045 0.011 0.121 0.904 OD area -9.418 -0.249 -2.830 0.005 SE -0.006 -0.001 -0.007 0.995 Nasal Gender 5.745; p<0.001 -10.587 -0.304 -3.597 <0.001 0.135 Age 0.680 0.144 1.600 0.112 OD area -8.930 -0.210 -2.369 0.019 SE -0.186 -0.016 -0.186 0.853 External ring Mean Gender 3.099; p=0.018 -5.032 -0.201 -2.287 0.024 0.064 Age -0.304 -0.090 -0.956 0.341 OD area -2.077 -0.068 -0.737 0.462 SE 1.666 0.202 2.228 0.028 Superior Gender 5.534; p<0.001 -5.468 -0.176 -2.069 0.041 0.129 Age -1.012 -0.240 -2.652 0.009 OD area -3.331 -0.087 -0.984 0.327 SE 2.307 0.225 2.569 0.011 Inferior Gender 1.206; p=0.312 -2.163 -0.082 -0.907 0.366 0.007 Age 0.033 0.009 0.096 0.924 OD area 1.591 0.049 0.521 0.603 SE 1.465 0.169 1.808 0.073 Temporal Gender 4.599; p=0.002 -7.049 -0.262 -3.051 0.003 0.106 Age -0.329 -0.091 -0.987 0.325 OD area -3.121 -0.095 -1.055 0.294 SE 2.005 0.226 2.554 0.012 Nasal Gender 1.603; p=0.178 -5.446 -0.194 -2.158 0.033 0.019 Age 0.093 0.024 0.255 0.799 OD area -3.446 -0.100 -1.067 0.288 SE 0.886 0.096 1.033 0.304 Volume Cube (mm3) Gender 2.983; p=0.022 -0.223 -0.241 -2.741 0.007 0.061 Age 0.015 0.116 1.237 0.219 OD area -0.050 -0.044 -0.480 0.632 SE 0.056 0.185 2.039 0.044
--- adjusted regression model not significant (p>0.05)
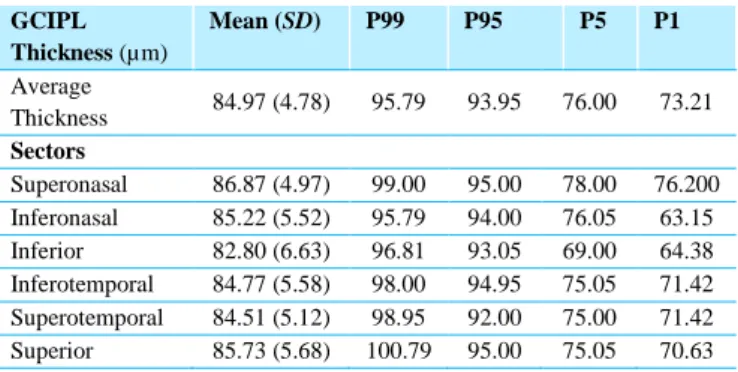
GCIPL Thickness
Overall average of GCIPL thickness and mean sectors’ GCIPL thicknesses are listed in Table 7. The inferior sector was the thinnest and the superonasal the thickest, with significant differences between the sectorial GCIPL thicknesses (p<0.001, repeated-measures ANOVA).
Table 7 - Means and Percentiles of GCIPL thickness measurements acquired from 116 children GCIPL Thickness (µm) Mean (SD) P99 P95 P5 P1 Average Thickness 84.97 (4.78) 95.79 93.95 76.00 73.21 Sectors Superonasal 86.87 (4.97) 99.00 95.00 78.00 76.200 Inferonasal 85.22 (5.52) 95.79 94.00 76.05 63.15 Inferior 82.80 (6.63) 96.81 93.05 69.00 64.38 Inferotemporal 84.77 (5.58) 98.00 94.95 75.05 71.42 Superotemporal 84.51 (5.12) 98.95 92.00 75.00 71.42 Superior 85.73 (5.68) 100.79 95.00 75.05 70.63
GCIPL: ganglion cell-inner plexiform layer; SD: standard deviation; P: Percentile
GCIPL thickness comparison between genders revealed that female gender had a statistically significant thinner superotemporal sector (p=0.028, independent t-test) (Table 8).
Table 8 - Mean GCIPL thicknesses comparison between genders GCIPL Thickness (µm) Mean (SD) p-value Male Female Average Thickness 85.24 (4.86) 84.77 (4.75) 0.599 Sectors Superonasal 86.86 (4.83) 86.87 (5.11) 0.992 Inferonasal 84.74 (6.22) 85.57 (4.98) 0.418 Inferior 82.60 (7.49) 82.96 (5.97) 0.775 Inferotemporal 85.60 (5.74) 84.17 (5.42) 0.168 Superotemporal 85.72 (5.19) 83.64 (4.93) 0.028 Superior 85.48 (5.97) 85.91 (5.50) 0.681
GCIPL: ganglion cell-inner plexiform layer; SD: standard deviation.
No correlation was found between average GCIPL thickness and OD area (r(124)=-0.005;p=0.959).
The multiple linear regression results for GCIPL thickness are summarized in Table 9. SE was a predictor of higher mean average, superonasal, inferonasal and inferior sectors’ CGIPL thicknesses (all p values <0.05). Gender also showed a significant relationship with a decrease of approximately 2.3 µm for the female gender in the superotemporal sector (p=0.02).
Table 9 - Results of Multiple Linear Regression for GCIPL Thicknesses GCIPL
Thickness (µm) IV F(4.105) B beta (β) t(105) p-value R
2 AJ Average Thickness Gender 2.201; p=0.073 -0.639 -0.067 -0.726 0.470 0.040 Age -0.068 -0.052 -0.535 0.594 OD area -0.725 -0.063 -0.652 0.516 SE 0.780 0.251 2.663 0.009 Superonasal Sector Gender 2.534; p=0.044 -0.147 -0.015 -0.160 0.873 0.051 Age -0.177 -0.132 -1.347 0.181 OD area -1.070 -0.089 -0.927 0.356 SE 0.777 0.241 2.560 0.012 Inferonasal Sector Gender 4.198; p=0.003 0.605 0.054 0.611 0.543 0.100 Age -0.052 -0.035 -0.367 0.714 OD area -0.107 -0.008 -0.085 0.932 SE 1.267 0.351 3.841 <0.001 Inferior Sector Gender 1.372; p=0.248 -0.056 -0.004 -0.046 0.963 0.013 Age 0.187 0.106 1.058 0.292 OD area 0.277 0.017 0.178 0.859 SE 0.918 0.216 2.248 0.027 Inferotemporal Sector Gender 1.617; p=0.175 -1.638 -0.145 1.563 0.121 0.021 Age -0.069 -0.045 -0.l456 0.649 OD area -0.991 -0.073 -0.748 0.456 SE 0.624 0.170 1.790 0.076
(Cont.)
GCIPL
Thickness (µm) IV F(4.105) B beta (β) t(105) p-value R
2 AJ Superotemporal Sector Gender 2.976; p=0.022 -2.234 -0.214 -2.363 0.020 0.064 Age -0.173 -0.123 -1.274 0.205 OD area -1.707 -0.136 -1.428 0.156 SE 0.523 0.155 1.664 0.099 Superior Sector Gender 1.374; p=0.247 0.240 0.021 0.226 0.822 0.013 Age -0.149 -0.097 -0.973 0.332 OD area -0.911 -0.066 -0.678 0.499 SE 0.671 0.181 1.894 0.061
--- adjusted regression model not significant (p0.05)
GCIPL: ganglion cell-inner plexiform layer; IV: independent variables; OD: optic disc; SE: spherical equivalent; R2
AJ: adjusted R-squared.
Subfoveal Choroidal Thickness
Mean SFC thickness and the respective percentiles are listed in Table 10. There were no between-group gender differences (Table 11). No correlation was found between average SCT and OD area (r(124)=-0.034;p=0.706). There was no relationship between the independent variables and SCT (F(4,118)=2.31;p=0.062).
Table 10 - Means and Percentiles of SCT measurements acquired from 129 children Average SFC
thickness (µm)
Mean (SD) P99 P95 P5 P1
374.76 (42.51) 474.70 453.50 310.00 258.60
SFC: Subfoveal choroidal; SD: standard deviation; P: percentile.
Table 11 - Mean SFC thicknesses comparison between genders
Average SFC thickness (µm) Mean (SD) p-value Male Male 370.33 (41.14) 377.75 (43.42) 0.332
SFC: Subfoveal choroidal; SD: standard deviation.
DISCUSSION
To the authors' best knowledge, there are no previous reports of normative values for all parameters included in our study, obtained with the SD-OCT, among healthy Caucasian children.
The values for RNFL thickness in the 324 children involved in our study (97.45 ± 9.78 µm) are higher than that reported in the Cirrus normative adult database study (average RNFL thickness of 92.83 ± 9.44 µm), but comparable to those previously reported in children in which Cirrus OCT was used.2-4,11,14 The present study
complements these studies, since it describes other RNFL thickness parameters, namely the thickness per each of twelve individual sectors. The distribution of RNFL thickness in this study is in agreement with the ISNT rule,26 in accordance to other studies in normal children.11,17,32 Analysis of the relationship between OD area and RNFL thickness showed a positive correlation. Eyes with larger OD areas had thicker RNFL measurements, as previously reported.6,14,33 It is not clear if eyes with large optic nerve heads show a thicker RNFL as a result of an increased amount of nerve fibers or to a shorter distance between the circular scan and the OD size edge.14 This shorter distance could lead to axons being sampled obliquely, at a different incident plane to the scan beam, which will eventually reveal a thicker value than in eyes in which the axons are further from the disc rim and are completely perpendicular to the measuring light.6 These results suggest that a greater predictive power in the evaluation of RNFL thickness might be achieved if OD area measurements are taken into account, either by measuring RNFL thickness at a fixed distance from the OD margin or by incorporating OD area measurements into the normative database.6 Conflicting data exists regarding the influence of refractive error on RNFL thickness.6,20,29 Our results revealed that RNFL is thinner in eyes with higher myopic refractive error, supporting previous studies.2,4,14 RNFL thickness values in children were not affected by age, in agreement with previous reports.1,2,4,6,10,11,14,40,41 Since it has been described that RNFL loss occurs later in life, after the age of 50,11,13 the absence of RNFL correlation with age is not surprising.
Cirrus normative adult database study reported a mean central macular thickness of 262.4 ± 14.5 µm and an average macular thickness of 281.3 ± 14.5 µm. Our results
showed an identical average macular thickness (282.22 ± 11.91 µm), but a lower central macular thickness (251.65 ± 20.08 µm) compared with adults, but identical to those reported by previous studies which used Cirrus OCT in children.2-4,14,36 Our study complements these as it investigates the relationship between OD area and MT. This study showed that the central subfield was the thinnest region, followed by the external ring, while the internal ring was the thickest, which is in accordance with most of previous reports,2,4,8,14 showing a mountain- -like configuration. Comparison of quadrants revealed a wide variation in MT among quadrants in both internal and external rings, with larger variation in the outer macula (264 to 301 µm) compared to the inner macula (308 to 321 µm). The nasal quadrant was identified as the thickest in both inner and outer regions, which is consistent with the anatomical relationship of the converging nerve fibers with the OD. These variations in thickness were proposed to be due to the distribution of nerve fibers along the superior and inferior arcuate bundles, as well as along the papillomacular bundle.2,4,16,25 Males had on average a thicker macula: average thickness, central subfield thickness, mean internal and external rings thicknesses (and most of their regions) and volume cube. These results are in alignment with reports from previous studies.2,4,14,40 According to our results, we could expect a lower thickness in the macular outer region in eyes with higher myopic refractive error, which could be consistent with the histopathological studies that reported increased retinal thinning with myopia.14,34 In opposition to our results, other studies14,42 have found an increase in macular thickness in the central field with negative refractions, which serves as a compensatory mechanism, at the expense of a thinner peripheral retina, in order to preserve the fovea. OD area showed a negative correlation with the mean internal ring thickness, internal superior, temporal and nasal region thicknesses. No references were found with respect to the relationship between OD area and MT, being required further studies to investigate this correlation. There was a significant and negative correlation between age and the outer ring’s superior region thickness. These results are consistent with previous studies reporting significant decrease in MT with age, and are also in agreement with histological studies that have demonstrated a decrease in density of photoreceptors, ganglion receptors, retinal pigmented epithelium, and optic nerve fibers with age.12,27,34
However, in contrast with our findings, some previous studies in children have revealed a significant increase in foveal thickness with age, which would be consistent with anatomical studies suggesting foveal continuous development upon the age of 5.2,4,14,41 Further longitudinal studies, with larger samples, stratified by age group, are needed to clarify this issue.
GCIPL thickness measurements may provide a better structural indicator of axon preservation or loss compared with the peripapillary RNFL scan.39 Mwanza, Oakley24 reported that the Cirrus HD-OCT algorithm could successfully segment macular GCIPL and measure its thickness with excellent reproducibility. The values obtained for the mean overall GCIPL thickness, in this study, are similar to the values reported by Totan, Güragaç39 who used a prototype ganglion cell analysis algorithm incorporated in the Cirrus HD-OCT. In contrast with the present study, most of recent studies have evaluated the ganglionar cell complex. To the authors’ best knowledge, there are no previous reports of normative values of ganglion cell thickness among Caucasian Portuguese children that were obtained with the SD-OCT. Sectorial analysis revealed that the superonasal sector was the thickest and the inferior sector was the thinnest, being in agreement with recent reports in adults.18 These results are in agreement with the normal anatomic features of retinal ganglion cells, which were shown to be most frequent in the superior and nasal regions.39 As reported in adults by Koh, Tham18 our results also showed a thinner superotemporal sector layer for females. Moreover, thinner GCIPL thickness in children was shown to be significantly associated with the female gender and negative diopters, as previously reported in adults.18 A significant association with OD area was not found and references about this topic are scarce,38 requiring further studies.
Despite its physiological and pathological importance, research of choroidal thickness has been limited due to the difficulty of visualization and measurement. However, the introduction of the EDI system in the Cirrus software enabled an accurate visualization and measurement of the choroid,15 which led to a growing interest in this area. The values obtained for the SCT are similar to those reported in other recent studies.5,21,30 Our study complements these as it includes a greater range of ages. No gender-based
differences were found, being in agreement with previous reports.5,15,21
The main limitation of the study is related to the fact that children were enrolled from an outpatient clinical setting, which could lead to a selection bias. To better represent the general pediatric population and minimize this bias, a strict list of inclusion and exclusion criteria was set. Lastly, the study sample was from a Caucasian Portuguese pediatric population; and the results may thus not generalize to populations with different demographics. In future studies, larger sample sizes and additional thickness factors, as ethnicity, could improve our knowledge on optic tomography.
This study established a normative database for RNFL, macula, GCIPL and SCT by Cirrus HD-OCT in healthy Caucasian Portuguese children ranging from 4 to 17 years old. This information could facilitate the evaluation of OCT measurements in children with optic neuropathies, glaucoma, macular and choroidal diseases. Variability regarding gender, age, SE and OD area warrants special consideration during OCT interpretation.
REFERENCES
1. Ahn H-C, Son H-W, Kim JS, Lee JH. Quantitative analysis of retinal nerve fiber layer thickness of normal children and adolescents. Korean J Ophthalmol. 2005;19(3):195-200.
2. Al-Haddad C, Barikian A, Jaroudi M, Massoud V, Tamim H. Spectral domain optical coherence tomography in children: normative data and biometric correlations. BMC Ophthalmol. 2014;14(1):53. 3. Altemir I, Pueyo V, Elía N, Polo V, Larrosa JM, Oros
D. Reproducibility of optical coherence tomography measurements in children. Am J Ophthalmol. 2013;155(1):171-6. e1.
4. Barrio‐Barrio J, Noval S, Galdós M, Ruiz‐Canela M, Bonet E, Capote M, et al. Multicenter Spanish study of spectral‐domain optical coherence tomography in normal children. Acta Ophthalmol (Copenh). 2013;91(1):e56-e63.
5. Bidaut-Garnier M, Schwartz C, Puyraveau M, Montard M, Delbosc B, Saleh M. Choroidal thickness
measurement in children using optical coherence tomography. Retina. 2014;34(4):768-74.
6. Budenz DL, Anderson DR, Varma R, Schuman J, Cantor L, Savell J, et al. Determinants of normal retinal nerve fiber layer thickness measured by Stratus OCT. Ophthalmology. 2007;114(6):1046-52.
7. Chen J, Lee L. Clinical applications and new developments of optical coherence tomography: an evidence‐based review. Clinical and Experimental Optometry. 2007;90(5):317-35.
8. Chen S, Wang B, Dong N, Ren X, Zhang T, Xiao L. Macular Measurements Using Spectral-Domain Optical Coherence Tomography in Chinese Myopic ChildrenMacular Measurements in Chinese Myopic
Children. Invest Ophthalmol Vis Sci.
2014;55(11):7410-6.
9. Costa RA, Skaf M, Melo LA, Calucci D, Cardillo JA, Castro JC, et al. Retinal assessment using optical coherence tomography. Prog Retin Eye Res. 2006;25(3):325-53.
10. El-Dairi MA, Asrani SG, Enyedi LB, Freedman SF. Optical coherence tomography in the eyes of normal children. Arch Ophthalmol. 2009;127(1):50-8.
11. Elía N, Pueyo V, Altemir I, Oros D, Pablo LE. Normal reference ranges of optical coherence tomography parameters in childhood. Br J Ophthalmol. 2012;96(5):665-70.
12. Eriksson U, Alm A. Macular thickness decreases with age in normal eyes: a study on the macular thickness map protocol in the Stratus OCT. Br J Ophthalmol. 2009;93(11):1448-52.
13. Girkin CA, McGwin G, Sinai MJ, Sekhar GC, Fingeret M, Wollstein G, et al. Variation in optic nerve and macular structure with age and race with
spectral-domain optical coherence tomography.
Ophthalmology. 2011;118(12):2403-8.
14. Gürağaç FB, Totan Y, Güler E, Tenlik A, Ertuğrul İG, editors. Normative spectral domain optical coherence tomography data in healthy turkish children. Semin Ophthalmol; 2017: Taylor & Francis.
15. He X, Jin P, Zou H, Li Q, Jin J, Lu L, et al.
CHOROIDAL THICKNESS IN HEALTHY
CHINESE CHILDREN AGED 6 to 12: The Shanghai Children Eye Study. Retina (Philadelphia, Pa). 2016. 16. Huynh SC, Wang XY, Rochtchina E, Mitchell P.
Distribution of macular thickness by optical coherence tomography: findings from a population-based study of
6-year-old children. Invest Ophthalmol Vis Sci. 2006;47(6):2351-7.
17. Kee S-Y, Lee S-Y, Lee Y-C. Thicknesses of the fovea and retinal nerve fiber layer in amblyopic and normal eyes in children. Korean J Ophthalmol. 2006;20(3):177-81.
18. Koh VT, Tham Y-C, Cheung CY, Wong W-L, Baskaran M, Saw S-M, et al. Determinants of Ganglion Cell–Inner Plexiform Layer Thickness Measured by
High-Definition Optical Coherence
TomographyDeterminants of GC-IPL Thickness. Invest Ophthalmol Vis Sci. 2012;53(9):5853-9. 19. Legarreta JE, Gregori G, Knighton RW, Punjabi OS,
Lalwani GA, Puliafito CA. Three-dimensional spectral-domain optical coherence tomography images of the retina in the presence of epiretinal membranes. Am J Ophthalmol. 2008;145(6):1023-30. e1.
20. Leung CK-S, Mohamed S, Leung KS, Cheung CY-L, Chan SL-w, Cheng DK-y, et al. Retinal nerve fiber layer measurements in myopia: an optical coherence tomography study. Invest Ophthalmol Vis Sci. 2006;47(12):5171-6.
21. Li XQ, Jeppesen P, Larsen M, Munch IC. Subfoveal Choroidal Thickness in 1323 Children Aged 11 to 12 Years and Association With Puberty: The Copenhagen Child Cohort 2000 Eye StudySubfoveal Choroidal Thickness and Puberty. Invest Ophthalmol Vis Sci. 2014;55(1):550-5.
22. Manjunath V, Taha M, Fujimoto JG, Duker JS. Choroidal thickness in normal eyes measured using Cirrus HD optical coherence tomography. Am J Ophthalmol. 2010;150(3):325-9. e1.
23. Menke MN, Knecht P, Sturm V, Dabov S, Funk J. Reproducibility of nerve fiber layer thickness measurements using 3D fourier-domain OCT. Invest Ophthalmol Vis Sci. 2008;49(12):5386-91.
24. Mwanza J-C, Oakley JD, Budenz DL, Chang RT, O'Rese JK, Feuer WJ. Macular ganglion cell–inner plexiform layer: automated detection and thickness reproducibility with spectral domain–optical coherence tomography in glaucoma. Invest Ophthalmol Vis Sci. 2011;52(11):8323-9.
25. Ooto S, Hangai M, Sakamoto A, Tomidokoro A, Araie M, Otani T, et al. Three-dimensional profile of macular retinal thickness in normal Japanese eyes. Invest Ophthalmol Vis Sci. 2010;51(1):465-73.
26. Pacheco‐Cervera J, Codoñer‐Franch P, Simó‐Jordá R, Pons‐Vázquez S, Galbis‐Estrada C, Pinazo‐Durán M. Reduced retinal nerve fibre layer thickness in children with severe obesity. Pediatr Obes. 2015;10(6):448-53. 27. Panda-Jonas S, Jonas JB, Jakobczyk-Zmija M. Retinal
photoreceptor density decreases with age. Ophthalmology. 1995;102(12):1853-9.
28. QUEIRÓS T, FREITAS C, GUIMARÃES S. Valores de Referência da Tomografia de Coerência Óptica na Idade Pediátrica. Acta Med Port. 2015;28(2).
29. Rauscher FM, Sekhon N, Feuer WJ, Budenz DL. Myopia affects retinal nerve fiber layer measurements as determined by optical coherence tomography. J Glaucoma. 2009;18(7):501.
30. Read SA, Collins MJ, Vincent SJ, Alonso-Caneiro D. Choroidal Thickness in Myopic and Nonmyopic Children Assessed With Enhanced Depth Imaging Optical Coherence TomographyChoroidal Thickness in Myopic/Nonmyopic Children. Invest Ophthalmol Vis Sci. 2013;54(12):7578-86.
31. Sakata LM, DeLeon‐Ortega J, Sakata V, Girkin CA. Optical coherence tomography of the retina and optic nerve–a review. Clin Experiment Ophthalmol. 2009;37(1):90-9.
32. Salchow DJ, Oleynikov YS, Chiang MF, Kennedy-Salchow SE, Langton K, Tsai JC, et al. Retinal nerve fiber layer thickness in normal children measured with optical coherence tomography. Ophthalmology. 2006;113(5):786-91.
33. Savini G, Zanini M, Carelli V, Sadun A, Ross-Cisneros F, Barboni P. Correlation between retinal nerve fibre layer thickness and optic nerve head size: an optical coherence tomography study. Br J Ophthalmol. 2005;89(4):489-92.
34. Song WK, Lee SC, Lee ES, Kim CY, Kim SS. Macular Thickness Variations with Gender, Age, and Axial Length in Healthy Subjects, a Spectral Domain Optical Coherence Tomography Study. Invest Ophthalmol Vis Sci. 2010:iovs. 09-4189.
35. Spaide RF, Koizumi H, Pozonni MC. Enhanced depth imaging spectral-domain optical coherence tomography. Am J Ophthalmol. 2008;146(4):496-500. 36. Tariq YM, Burlutsky G, Mitchell P. Macular
parameters and prematurity: A spectral domain coherence tomography study. Journal of American Association for Pediatric Ophthalmology and Strabismus. 2012;16(4):382-5.
37. Tenlik A, Gürağaç FB, Güler E, Dervişoğulları MS, Totan Y. Choroidal thickness measurement in healthy pediatric population using Cirrus HD optical coherence tomography. Arq Bras Oftalmol. 2015;78(1):23-6. 38. Tham Y-C, Cheung CY, Koh VT, Cheng C-Y,
Sidhartha E, Strouthidis NG, et al. Relationship between ganglion cell-inner plexiform layer and optic disc/retinal nerve fibre layer parameters in
non-glaucomatous eyes. Br J Ophthalmol.
2013;97(12):1592-7.
39. Totan Y, Güragaç FB, Güler E. Evaluation of the Retinal Ganglion Cell Layer Thickness in Healthy Turkish Children. J Glaucoma. 2015;24(5):e103-e8. 40. Turk A, Ceylan OM, Arici C, Keskin S, Erdurman C,
Durukan AH, et al. Evaluation of the nerve fiber layer and macula in the eyes of healthy children using spectral-domain optical coherence tomography. Am J Ophthalmol. 2012;153(3):552-9. e1.
41. Yanni SE, Wang J, Cheng CS, Locke KI, Wen Y, Birch DG, et al. Normative reference ranges for the retinal nerve fiber layer, macula, and retinal layer thicknesses in children. Am J Ophthalmol. 2013;155(2):354-60. e1.
42. Yau GS, Lee JW, Woo TT, Wong RL, Wong IY. Central macular thickness in children with myopia, emmetropia, and hyperopia: an optical coherence tomography study. BioMed research international. 2015;2015.
CONTACTO
Tatiana QueirósRua Cónego Luciano Afonso dos Santos, 63 4ºRgth. 4700-371, Braga, Portugal
E-mail: [email protected] No funding sources to disclosure.