BGD
12, 2257–2305, 2015CO2 exchange across
Northern Eurasia
M. A. Rawlins et al.
Title Page
Abstract Introduction
Conclusions References
Tables Figures
◭ ◮
◭ ◮
Back Close
Full Screen / Esc
Printer-friendly Version
Interactive Discussion
Discussion
P
a
per
|
Discussion
P
a
per
|
Discussion
P
a
per
|
Discussion
P
a
per
|
Biogeosciences Discuss., 12, 2257–2305, 2015 www.biogeosciences-discuss.net/12/2257/2015/ doi:10.5194/bgd-12-2257-2015
© Author(s) 2015. CC Attribution 3.0 License.
This discussion paper is/has been under review for the journal Biogeosciences (BG). Please refer to the corresponding final paper in BG if available.
Assessment of model estimates of
land–atmosphere CO
2
exchange across
Northern Eurasia
M. A. Rawlins1, A. D. McGuire2, J. K. Kimball3, P. Dass1, D. Lawrence4, E. Burke5, X. Chen6, C. Delire7, C. Koven8, A. MacDougall9, S. Peng10,15, A. Rinke11,12, K. Saito13, W. Zhang14, R. Alkama7, T. J. Bohn15, P. Ciais10, B. Decharme7, I. Gouttevin16,17, T. Hajima13, D. Ji11, G. Krinner16,
D. P. Lettenmaier18, P. Miller14, J. C. Moore11, B. Smith14, and T. Sueyoshi13 1
Climate System Research Center, Department of Geosciences, University of Massachusetts, Amherst, MA, USA
2
U.S. Geological Survey, Alaska Cooperative Fish and Wildlife Research Unit, University of Alaska, Fairbanks, Alaska, USA
3
FLBS/NTSG, Univ. of Montana, Missoula, MT, USA
4
National Center for Atmospheric Research, Boulder, CO, USA
5
Met Office Hadley Centre, FitzRoy Road, Exeter, EX1 3PB, UK
6
Department of Civil and Environmental Engineering, University of Washington, Seattle, WA, USA
7
BGD
12, 2257–2305, 2015CO2 exchange across
Northern Eurasia
M. A. Rawlins et al.
Title Page
Abstract Introduction
Conclusions References
Tables Figures
◭ ◮
◭ ◮
Back Close
Full Screen / Esc
Printer-friendly Version
Interactive Discussion
Discussion
P
a
per
|
Discussion
P
a
per
|
Discussion
P
a
per
|
Discussion
P
a
per
|
8
Lawrence Berkeley National Laboratory, Berkeley, CA, USA
9
School of Earth and Ocean Sciences, University of Victoria, Victoria, BC, Canada
10
Laboratoire des Sciences du Climat et de l’Environnement, CEA-CNRS-UVSQ, UMR8212, 91191 Gif-sur-Yvette, France
11
State Key Laboratory of Earth Surface Processes and Resource Ecology, College of Global Change and Earth System Science, Beijing Normal University, Beijing, China
12
Alfred Wegener Institute, Helmholtz Centre for Polar and Marine Research, Potsdam, Germany
13
Research Institute for Global Change, Japan Agency for Marine-Earth Science and Technology, Yokohama, Kanagawa, Japan
14
Department of Physical Geography and Ecosystem Science, Lund University, Sölvegatan 12, 223 62 Lund, Sweden
15
School of Earth and Space Exploration, Arizona State University, Tempe, AZ, USA
16
UJF–Grenoble 1/CNRS, Laboratoire de Glaciologie et Géophysique de l’Environnement (LGGE), UMR 5183, BP53, 38041 Grenoble, France
17
Irstea, UR HHLY, 5 rue de la Doua, CS 70077, 69626 Villeurbanne CEDEX, France
18
Department of Geography, University of California, Los Angeles, CA, USA
Received: 8 January 2015 – Accepted: 21 January 2015 – Published: 3 February 2015
Correspondence to: M. A. Rawlins ([email protected])
BGD
12, 2257–2305, 2015CO2 exchange across
Northern Eurasia
M. A. Rawlins et al.
Title Page
Abstract Introduction
Conclusions References
Tables Figures
◭ ◮
◭ ◮
Back Close
Full Screen / Esc
Printer-friendly Version
Interactive Discussion
Discussion
P
a
per
|
Discussion
P
a
per
|
Discussion
P
a
per
|
Discussion
P
a
per
|
Abstract
A warming climate is altering land–atmosphere exchanges of carbon, with a poten-tial for increased vegetation productivity as well as the mobilization of permafrost soil carbon stores. Here we investigate land–atmosphere carbon dioxide (CO2) dynam-ics through analysis of net ecosystem productivity (NEP) and its component fluxes of
5
gross primary productivity (GPP) and ecosystem respiration (ER) and soil carbon resi-dence time, simulated by a set of land surface models (LSMs) over a region spanning the drainage basin of northern Eurasia. The retrospective simulations were conducted over the 1960–2009 record and at 0.5◦ resolution, which is a scale common among many global carbon and climate model simulations. Model performance benchmarks
10
were drawn from comparisons against both observed CO2 fluxes derived from
site-based eddy covariance measurements as well as regional-scale GPP estimates site-based on satellite remote sensing data. The site-based comparisons show the timing of peak GPP to be well simulated. Modest overestimates in model GPP and ER are also found, which are relatively higher for two boreal forest validation sites than the two tundra sites.
15
Across the suite of model simulations, NEP increases by as little as 0.01 to as much as 0.79 g C m−2yr−2, equivalent to 3 to 340 % of the respective model means, over the analysis period. For the multimodel average the increase is 135 % of the mean from the first to last ten years of record (1960–1969 vs 2000–2009), with a weakening CO2 sink over the latter decades. Vegetation net primary productivity increased by 8 to 30 %
20
from the first to last ten years, contributing to soil carbon storage gains, while model mean residence time for soil organic carbon decreased by 10 % (−5 to −16 %). This suggests that inputs to the soil carbon pool exceeded losses, resulting in a net gain amid a decrease in residence time. Our analysis points to improvements in model ele-ments controlling vegetation productivity and soil respiration as being needed for
reduc-25
BGD
12, 2257–2305, 2015CO2 exchange across
Northern Eurasia
M. A. Rawlins et al.
Title Page
Abstract Introduction
Conclusions References
Tables Figures
◭ ◮
◭ ◮
Back Close
Full Screen / Esc
Printer-friendly Version
Interactive Discussion
Discussion
P
a
per
|
Discussion
P
a
per
|
Discussion
P
a
per
|
Discussion
P
a
per
|
in future model development and intercomparison studies. Resulting improvements in parameterizations and processes driving productivity and soil respiration rates will in-crease confidence in model estimates of net CO2exchange, component carbon fluxes,
and underlying drivers of change across the northern high latitudes.
1 Introduction
5
The Arctic is believed to have been a net sink of carbon during the Holocene (Pries et al., 2012). Northern boreal regions play a considerable role in the land–atmosphere exchange of CO2at high latitudes (Graven et al., 2013), and during modern times, often
referred to as the anthropocene (Crutzen, 2006), warming across the high northern latitudes has occurred at a faster rate than the rest of the globe, potentially through
10
feedbacks involving biogeochemical and biogeophysical processes (Cox et al., 2000; Serreze and Barry, 2011). Warming may increase soil microbial decomposition, placing the large permafrost carbon pool at greater risk for being mobilized and transferred to the atmosphere as greenhouse gases (GHGs), thus providing a positive feedback to global climate (Dutta et al., 2006; Vogel et al., 2009; Schuur et al., 2009). Warming may
15
also lead to longer growing seasons, contributing to increased plant productivity and ecosystem carbon sequestration (Melillo et al., 1993; Euskirchen et al., 2006). Satellite observations show broad greening trends in tundra regions (Myneni et al., 1997; Goetz et al., 2005; Zhang et al., 2008), suggesting a potential increase in the land sink of atmospheric CO2. Some areas, however, are browning (Goetz et al., 2006).
20
There exists considerable uncertainty in contemporary magnitudes and temporal trends in land–atmosphere exchanges of CO2. A recent synthesis of observations and
models by McGuire et al. (2012) suggests that tundra regions across the pan-Arctic were a sink for atmospheric CO2 and a source of CH4 from 1990–2009. However
a meta-analysis of 40 yr of CO2 flux observations from 54 studies spanning 32 sites
25
BGD
12, 2257–2305, 2015CO2 exchange across
Northern Eurasia
M. A. Rawlins et al.
Title Page
Abstract Introduction
Conclusions References
Tables Figures
◭ ◮
◭ ◮
Back Close
Full Screen / Esc
Printer-friendly Version
Interactive Discussion
Discussion
P
a
per
|
Discussion
P
a
per
|
Discussion
P
a
per
|
Discussion
P
a
per
|
rates, particularly over the last decade (Belshe et al., 2013). In an analysis of outputs from several models which have been part of recent terrestrial biosphere model in-tercomparison projects, Fisher et al. (2014) find that spatial patterns in carbon stocks and fluxes over Alaska varied widely, with some models showing a strong carbon sink, others a strong carbon source, and some showing the region as carbon neutral. It is
5
critical to understand the net carbon sink as recent studies suggest that with continued warming the Arctic may transition from a net sink of atmospheric CO2 to a net source over coming decades (Hayes et al., 2011; Koven et al., 2011; Schaefer et al., 2011; MacDougall et al., 2013; Oechel et al., 2014). In a study using a process model which included disturbances, Hayes et al. (2011) estimated a 73 % reduction in the strength
10
of the pan-Arctic land-based CO2sink over 1997–2006 vs. previous decades in the late 20th century.
Recent studies have provided new insights into model uncertainties relevant to our understanding of the land-based CO2 sink across northern Eurasia. Quegan et al. (2011) examined several independent estimates of the carbon balance of Russia
in-15
cluding two dynamic global vegetation models (DGVMs), two atmospheric inversion methods, and a landscape-ecosystem approach (LEA) incorporating observed data. They concluded that estimates of heterotrophic respiration were biased high in the two DGVMs and that the LEA appeared to give the most credible estimates of the fluxes. In an analysis of the terrestrial carbon budget of Russia using inventory-based, eddy
20
covariance, and inversion methods, Dolman et al. (2012) noted good agreement in net ecosystem exchange among these bottom-up and top-down methods, estimating an average CO2 sink across the three methods of 613.5 Tg C yr−1. Their examination of outputs from a set of DGVMs, however, showed a much lower sink of 91 Tg C yr−1. These analyses highlight the need for comprehensive assessments of numerical model
25
BGD
12, 2257–2305, 2015CO2 exchange across
Northern Eurasia
M. A. Rawlins et al.
Title Page
Abstract Introduction
Conclusions References
Tables Figures
◭ ◮
◭ ◮
Back Close
Full Screen / Esc
Printer-friendly Version
Interactive Discussion
Discussion
P
a
per
|
Discussion
P
a
per
|
Discussion
P
a
per
|
Discussion
P
a
per
|
In this study we examine model estimates of NEP and its component fluxes GPP and ER across northern Eurasia from a series of retrospective simulations for the pe-riod 1960–2009. Our analysis is unique in its synthesis of a large suite of sophisticated land-surface models, available site-level data, and a remote-sensing product. Study goals are two-fold. First, using the available in-situ data derived from tower-based
mea-5
surements and the remote-sensing GPP product we seek to assess model efficacy in simulating spatial and temporal variations in GPP, ER, and NEP across the region. In doing so we elucidate issues complicating evaluations of model simulations of the car-bon cycle across northern Eurasia and, by extension, other areas of the northern high latitudes. Second we estimate time changes in NEP and soil organic carbon (SOC)
10
residence time and its controls as an indicator of climate sensitivity and potential vul-nerability of soil carbon stocks across the region. We focus the analysis and discussion on assessing how well the models capture the seasonal cycle and spatial patterns in GPP and ER flux rates, evaluating uncertainties in the net CO2 exchange given re-ported biases in respiration rates, and in advancing understanding of the cycling of
15
CO2between the land and atmosphere over recent decades.
2 Methods
2.1 Study region
The spatial domain is the arctic drainage basin of northern Eurasia which comprises all land areas draining to the Arctic Ocean, a region of some 13.5 million km2(Fig. 1). The
20
basin covers roughly half of the Northern Eurasian Earth Science Partnership Initiative (NEESPI) study area, loosely defined as the region between 15◦E in the west, the Pacific Coast in the east, 40◦N in the south, and the Arctic Ocean coastal zone in the north (Groisman et al., 2009). Warming and associated environmental changes to this region are among the most pronounced globally (Groisman and Bartalev, 2007;
25
BGD
12, 2257–2305, 2015CO2 exchange across
Northern Eurasia
M. A. Rawlins et al.
Title Page
Abstract Introduction
Conclusions References
Tables Figures
◭ ◮
◭ ◮
Back Close
Full Screen / Esc
Printer-friendly Version
Interactive Discussion
Discussion
P
a
per
|
Discussion
P
a
per
|
Discussion
P
a
per
|
Discussion
P
a
per
|
latitudes, with boreal forest and taiga vegetation comprising much of the remainder of the region. Steppes and grasslands are found across a relative small area in the extreme southwest. Continuous permafrost underlies over half of the region. Sporadic and relic permafrost comprise the southwest portion of the domain. West to east, the Ob, Yenesey, Lena, and Kolyma rivers drain a large fraction of the total river discharge
5
from the northern Eurasian basin.
2.2 Modeled data
We used outputs from retrospective simulations of nine models participating in the model integration group of the Permafrost Carbon Research Coordination Network (PCRCN). All simulation outputs available at the time of this writing were included in
10
the analysis (http://www.permafrostcarbon.org, accessed 10 May 2014). The simula-tion protocol allowed for the choice of a model’s driving datasets for atmospheric CO2,
N deposition, climate, disturbance, and other forcings. Simulations were run at daily or sub-daily time steps in some models and at 0.5◦resolution over all land areas north of 45◦N latitude. The present study focuses on analysis of spatial patterns and temporal
15
changes in land–atmosphere CO2 fluxes over the period 1960–2009. Quantities
ana-lyzed are GPP, ER, and NEP, defined here as NEP=GPP−ER, where a positive value represents a net sink of CO2 into the ecosystem. ER is the sum of heterotrophic res-piration and autotrophic resres-piration as estimated by the models. In this study we follow the conceptual framework for NEP and related terms as described in Chapin III et al.
20
(2005). For the PCRCN modeling groups are providing gridded data for permafrost re-gions of the Northern Hemisphere. The nine models examined here (full model names in Table 1) are the (1) CLM version 4.5 (hereafter CLM4.5, Oleson et al., 2013); (2) CoLM (Dai et al., 2003, 2004); (3) ISBA (Decharme et al., 2011); (4) JULES (Best et al., 2011; Clark et al., 2011); (5) LPJ Guess WHyMe (hereafter LPJG, Smith et al.,
25
BGD
12, 2257–2305, 2015CO2 exchange across
Northern Eurasia
M. A. Rawlins et al.
Title Page
Abstract Introduction
Conclusions References
Tables Figures
◭ ◮
◭ ◮
Back Close
Full Screen / Esc
Printer-friendly Version
Interactive Discussion
Discussion
P
a
per
|
Discussion
P
a
per
|
Discussion
P
a
per
|
Discussion
P
a
per
|
et al., 2013). Table 2 lists the model elements most closely related to CO2source and sink dynamics. These include model land cover initialization, time series forcings, light use efficiency, and CO2 and nitrogen fertilization. The LPJG and MIROC are
consid-ered dynamic global vegetation models (DGVMs), wherein vegetation is allowed to change over the model simulation period. Among these models there exists a wide
5
range of accounting for processes related to disturbances such as fire and land use change (Table 2). While studies that examine the overall ecosystem carbon balance (i.e. the net ecosystem carbon balance, NECB) are elemental to our understanding of the carbon cycle of northern Eurasia, the present study focuses on the patterns in NEP and component fluxes GPP and ER, common in all of the models, in order to avoid the
10
uncertainties given the range of model formulations related to the full carbon balance. Outputs from several of the nine models have been examined in other recent studies. The LPJG and ORCHIDEE were used in the synthesis of data and models presented by McGuire et al. (2012). JULES, LPJG, ORCHIDEE, and CLM4.5 participated in the TRENDY MIP (Piao et al., 2013). CLM4.5, ORCHIDEE, and LPJG were three of the
15
eight models examined in the study of Dolman et al. (2012). The nine models examined here have been used to characterize the relationship between air and near-surface soil temperatures in the Northern Hemisphere permafrost region (Rinke et al., 2014).
2.3 Observation data
2.3.1 Flux tower eddy covariance data
20
Model estimates for GPP, ER, and NEP are evaluated against data from four eddy covariance flux towers located across Russia and contained in the La Thuile global FLUXNET dataset (Baldocchi, 2008). FLUXNET represents a global network of tower eddy covariance measurement sites for monitoring land–atmosphere exchanges of carbon dioxide and water vapor (http://daac.ornl.gov/FLUXNET/fluxnet.shtml). Monthly
25
BGD
12, 2257–2305, 2015CO2 exchange across
Northern Eurasia
M. A. Rawlins et al.
Title Page
Abstract Introduction
Conclusions References
Tables Figures
◭ ◮
◭ ◮
Back Close
Full Screen / Esc
Printer-friendly Version
Interactive Discussion
Discussion
P
a
per
|
Discussion
P
a
per
|
Discussion
P
a
per
|
Discussion
P
a
per
|
(COK), Nur-Hakasija (HAK), and Zotino (ZOT). The first two (CHE and COK) are lo-cated in northeast Russia in the general zone of tundra vegetation and the remaining two sites (HAK and ZOT) are located in the boreal zone in the south-central part of the region (Fig. 1). Data are available for years 2002–2004 at Chersky, Nur-Hakasija and Zotino, and 2003–2005 at Chokurdakh. General characteristics of these sites are
sum-5
marized in Table 3. In this dataset GPP and ER are derived from an empirical model driven by field-based eddy covariance measurements of net ecosystem CO2exchange (NEE) using methodologies described in Reichstein et al. (2005).
2.3.2 Satellite-based estimates of GPP
Satellite data driven estimates of annual total GPP are also obtained from the MODIS
10
(Moderate Resolution Imaging Spectroradiometer) MOD17 operational product (Run-ning et al., 2004; Zhao et al., 2005). The MOD17 product has been derived oper-ationally from the NASA EOS MODIS sensors since 2000 and provides a globally consistent and continuous estimation of vegetation productivity at 1 km resolution and 8 day intervals. MOD17 uses a light use efficiency algorithm driven by global land cover
15
classification and canopy fractional photosynthetically active radiation (FPAR) inputs from MODIS. The product also uses daily surface meteorology inputs from global re-analysis data (Zhao and Running, 2010), and land cover class specific biophysical response functions to estimate the conversion efficiency of canopy absorbed photosyn-thetically active radiation to vegetation biomass (g C MJ−1) and GPP (Running et al.,
20
2004). The MOD17 algorithms and productivity estimates have been extensively eval-uated for a range of regional and global applications, including northern, boreal and Arctic domains. We use the MOD17 Collection 5 product, which has undergone five major reprocessing improvements since 2000. The MOD17 data are used in this study as a consistent satellite-derived baseline for evaluating GPP simulations from the
de-25
BGD
12, 2257–2305, 2015CO2 exchange across
Northern Eurasia
M. A. Rawlins et al.
Title Page
Abstract Introduction
Conclusions References
Tables Figures
◭ ◮
◭ ◮
Back Close
Full Screen / Esc
Printer-friendly Version
Interactive Discussion
Discussion
P
a
per
|
Discussion
P
a
per
|
Discussion
P
a
per
|
Discussion
P
a
per
|
3 Results
3.1 Model evaluation and benchmarking
3.1.1 Site-level evaluations
Confident assessments of uncertainties in land–atmosphere CO2 fluxes is dependent
on robust comparisons of model estimates against consistent benchmarking data.
5
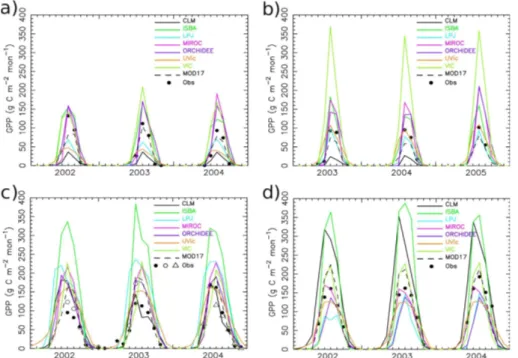
Monthly GPP from the models and MOD17 product are compared with cumulative monthly tower data by extracting the model values for the grid cell encompassing each tower site. MOD17 GPP agrees well with the tower-based estimates for Cher-sky and Chokurdakh (Fig. 2), with average errors over the three years of −2 and −11 g C m−2month−1, respectively (Table 4). The comparisons show MOD17 GPP
10
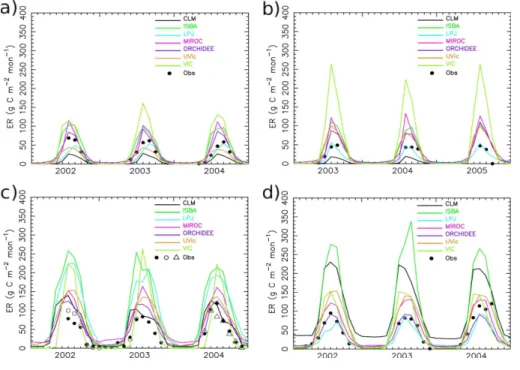
broadly agrees with the tower estimates at sites Nur-Hakasija and Zotino; average errors are 13 and 10 g C m−2month−1, respectively, for these sites with higher produc-tivity than Chersky and Chokurdakh. Averaged across all models the error in GPP is 7, 34, 34 and 13 g C m−2month−1for Chersky, Chokurdakh, Nur-Hakasija and Zotino, respectively. Mean errors for ER are 8, 35, 43 and 33 g C m−2month−1, respectively.
15
Overall the models simulate well the seasonal cycle in GPP (Fig. 2) and ER (Fig. 3), including the timing of peak CO2 drawdown. Modest overestimates are noted near growing season peak at Nur-Hakasija and Zotino. However, for all four sites significant over- and under- estimates in GPP and ER are also noted (Table 4). Overestimates in ER for Nur-Hakasija and Zotino during late summer and autumn are particularly
20
noteworthy. For the two sites in the south there is a tendency for overestimation in GPP and ER. All models overestimate both GPP and ER at HAK. Overestimates of both GPP and ER are found for all models for Nur-Hakasija. Seven of the nine models overestimate GPP and ER at Zotino, with ER overestimated by a considerable degree. An ANOVA test was carried out to determine whether model errors in ER exceed the
25
BGD
12, 2257–2305, 2015CO2 exchange across
Northern Eurasia
M. A. Rawlins et al.
Title Page
Abstract Introduction
Conclusions References
Tables Figures
◭ ◮
◭ ◮
Back Close
Full Screen / Esc
Printer-friendly Version
Interactive Discussion
Discussion
P
a
per
|
Discussion
P
a
per
|
Discussion
P
a
per
|
Discussion
P
a
per
|
compared against GPP pooled across all sites and (ii) ER and GPP errors for the two tundra sites are pooled and compared against ER and GPP errors for the two forest sites.
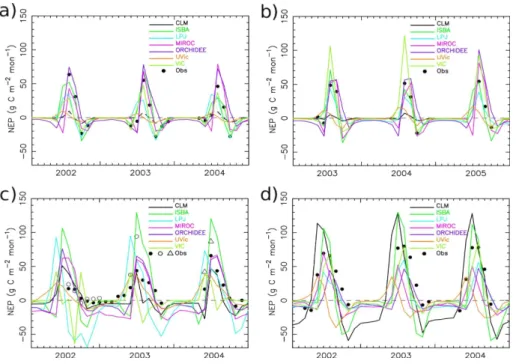
The tendency to overestimate ER leads to discrepancies in net source (negative NEP) at Nur-Hakasija and Zotino, particularly in autumn (Fig. 4). Average NEP errors
5
are−11 and−20 g C m−2month−1 for Nur-Hakasija and Zotino, respectively (Table 4). For both Chersky and Chokurdakh the models simulate well both the magnitude and timing of CO2 source activity prior to and following the dormant season. A lack of
available tower-based data during the colder months limits the robustness of our as-sessments during that time of year.
10
3.1.2 Regional-level evaluation of model GPP
Estimates from the MOD17 product provide a temporally and spatially continuous benchmark to assess model simulated GPP over the study domain. Average annual-total GPP from MOD17 over the period 2000–2009 is shown in Fig. 5. The MOD17 product clearly captures three distinct landcover zones over the region, representing:
15
(i) grasslands across the south; (ii) boreal forests in the center of the region; and (iii) tundra to the north. Highest production occurs in the western forests where mean an-nual temperatures are higher. Both the steppe and tundra areas show anan-nual GPP of less than 300 g C m−2yr−1. Areas of low productivity in high elevation areas to the north are well delineated. The spatially averaged mean across the region is
approxi-20
mately 470 g C m−2
yr−1
. In most of the models the patterns in GPP broadly represent the major biome areas captured in the MODIS landcover product (Fig. 1a). Grid-based correlations with the MOD17 GPP estimates (upper left of map panels in Fig. 5) show a wide range of agreement across the models. Spatial averages of the correlations across the domain range fromr =0.92 (ISBA) to r=0.48 (ORCHIDEE). Four of the
25
BGD
12, 2257–2305, 2015CO2 exchange across
Northern Eurasia
M. A. Rawlins et al.
Title Page
Abstract Introduction
Conclusions References
Tables Figures
◭ ◮
◭ ◮
Back Close
Full Screen / Esc
Printer-friendly Version
Interactive Discussion
Discussion
P
a
per
|
Discussion
P
a
per
|
Discussion
P
a
per
|
Discussion
P
a
per
|
lower GPP than MOD17 over tundra areas and higher productivity in the boreal zone. The east to west gradient is generally well simulated in most of the models. Figure 6 shows the distribution of GPP for all grids of each model. Regional averages from each model fall within±20 % of the MOD17 average of 468 g C m−2yr−1, with the exception of the LPJG model for which annual GPP is 40 % lower than MOD17. In general the
5
models bracket the MOD17 estimates, with several models showing a larger spread and several showing a reduced spread.
For each model the spatial pattern in ER (not shown) closely matcches the pattern in GPP, consistent with the strong dependence of autotrophic respiration and litterfall on vegetation productivity (Waring et al., 1998; Bond-Lamberty et al., 2004). Area
av-10
eraged GPP and ER are highly correlated (r=0.99, Fig. 7). That is, models which simulate low (high) GPP also simulate low (high) ER.
3.1.3 Spatial patterns and area averages
In this study net ecosystem productivity (NEP) represents the net exchange of CO2
between the land surface and the atmosphere. The NEP residual CO2 flux is defined
15
here as the difference between GPP and ER. We did not include other emission compo-nents of land–atmosphere CO2 exchange (Hayes and Turner, 2012) because several
of the models are limited in their representation of disturbance processes important for carbon cycling in boreal forest regions (e.g. fire and forest harvest). The multimodel mean NEP is approximately 20 g C m−2yr−1or 270 Tg C yr−1over the simulation period.
20
Among the models NEP varies from 4 (UVic) to 48 (JULES) g C m−2yr−1, a range that is double the multimodel mean. The mean NEP is highest over the south central part of the region and lowest in the tundra to the north (Fig. 8). Only 0.3 % of the region is a net annual source of CO2, notably two small areas in Scandinavia. Tundra areas are a net sink of approximately 15 g C m−2yr−1based on the multimodel mean NEP. As
25
BGD
12, 2257–2305, 2015CO2 exchange across
Northern Eurasia
M. A. Rawlins et al.
Title Page
Abstract Introduction
Conclusions References
Tables Figures
◭ ◮
◭ ◮
Back Close
Full Screen / Esc
Printer-friendly Version
Interactive Discussion
Discussion
P
a
per
|
Discussion
P
a
per
|
Discussion
P
a
per
|
Discussion
P
a
per
|
3.2 Temporal changes over period 1960–2009
Figure 9 shows the time series of regionally averaged annual NEP each year over the period 1960–2009 for each model. Across the model group annual NEP is positive in most but not all years. Several models show a net source of CO2 in some years, primarily during the earlier decades of the period. Among the models NEP increases
5
by 0.01 to 0.79 g C m−2yr−2, (5 to 40 g C m−2 total over the period) based on a lin-ear least squares (LLS) regression (Table 5). Seven of the models (CLM4.5, CoLM, ISBA, JULES, LPJG, MIROC, ORCHIDEE) show statistically significant trends at the
p <0.01. Taking averages over the first decade (1960–1969) and last decade (2000– 2009) we estimate that the NEP change ranges from 10 to 400 % of the first decade
10
mean, with a nine model average of 135 %. For each model the GPP trend magni-tude exceeds the ER trend magnimagni-tude (Table 5), hence the increase in NEP over time. The increases from the first to last decade of the simulations range from 9–35 % of the early decade average for GPP and 8–30 % for ER. Total cumulative NEP over the 50 yr period and averaged across all models is approximately 12 (range 3–20) Pg C
15
(Fig. 10). Averaged across the models, NEP exhibits an increase during mainly the earliest decades that tends to weaken over the latter decades (Fig. 11). The uncer-tainty range for the multimodel mean suggests that the region has been a net sink for CO2 over the simulation period. Interestingly the uncertainty range reflects relatively better model agreement in annual NEP (lower variance) during the years 1960–1965
20
and in the low NEP years 1978 and 1996. Amid this increase there is evidence of a “deceleration” in NEP. The deceleration is apparent when examining trend magnitude and significance across all time intervals (minimum 20 yr interval) over the simulation period (Fig. 12). Here several models (ISBA, LPJG, ORCHIDEE) exhibit weaker linear trends over time and all models show a lack of significant positive trends for time
in-25
BGD
12, 2257–2305, 2015CO2 exchange across
Northern Eurasia
M. A. Rawlins et al.
Title Page
Abstract Introduction
Conclusions References
Tables Figures
◭ ◮
◭ ◮
Back Close
Full Screen / Esc
Printer-friendly Version
Interactive Discussion
Discussion
P
a
per
|
Discussion
P
a
per
|
Discussion
P
a
per
|
Discussion
P
a
per
|
trend is significant for 20 of 42 (48 %) possible time periods beginning in 1975 or later, whereas 72 of 107 (67 %) are significant for periods starting in 1960–1962.
3.3 Residence time
Annual estimates of residence time are calculated for each model and at each grid cell over the period 1960–2009 using model soil carbon storage and the rate of
hete-5
orotrophic respiration (Rh). Among the models residence time (long-term climatological mean) varies from 40 (CoLM) to 400 yr (CLM4.5), and largely by model soil carbon amount. Over the period examined all of the models simulate a statistically significant (p <0.01) decrease in the regionally-averaged residence time. Across the models the decrease from first to last decade of the study period ranges from−5 to−16 % of each
10
model’s mean. The decline occurs amid an increase in SOC storage over time. All mod-els with the exception of CoLM simulate a statistically significant increase in soil carbon and all exhibit an increase inRh. The increases in carbon storage range from 0.2 to 3.6 % while the increases inRhrange from 7 to 22 %. Likewise the models simulate an increase in the the rate of net primary production (NPP) of 8 to 30 %. Across the model
15
group the change in residence time is highly correlated (r=0.99) with change inRh. In essence higher rates inRhand NPP indicate a decrease in soil carbon residence time, with increased soil carbon storage resulting from enhanced vegetation productivity and litterfall inputs.
The spatial pattern in residence time changes suggests that controlling influences
20
are leading to both decreases and increases over different parts of the region. The largest decreases are found across north-central Russia and the eastern third of the domain (Fig. 13). The decreases in residence time are statistically significant (p <0.01) for just over 46 % of the grid cells (inset, Fig. 13). The residence time decrease exceeds −20 % over approximately 16 % of the region. An increase in residence time is noted for
25
BGD
12, 2257–2305, 2015CO2 exchange across
Northern Eurasia
M. A. Rawlins et al.
Title Page
Abstract Introduction
Conclusions References
Tables Figures
◭ ◮
◭ ◮
Back Close
Full Screen / Esc
Printer-friendly Version
Interactive Discussion
Discussion
P
a
per
|
Discussion
P
a
per
|
Discussion
P
a
per
|
Discussion
P
a
per
|
4 Discussion
4.1 Uncertainties in tower-based measurements
The potential for alterations to the terrestrial sink of atmospheric CO2across the high northern latitudes motivates our examination of model estimates of land–atmosphere exchanges of CO2 across the arctic drainage basin of northern Eurasia. Validation
5
of model estimates through comparisons to measured flux tower data is challenged by several factors. The limited extent of available measurements from a sparse re-gional tower network (only four sites and twelve site-years) makes it difficult to validate the model estimates and, in turn, identify model processes which require refinement. There are also inherent uncertainties in GPP and ER data derived from net ecosystem
10
exchange (NEE) measurements at the eddy covariance tower sites. ER is generally assumed to equal NEE during nighttime hours (Lasslop et al., 2010). An empirical relationship is derived to estimate ER during that time and it is extrapolated into the daylight hours. GPP is then generally calculated as the difference between NEE and ER (accounting for appropriate signs). Since there is generally daylight for
photosyn-15
thesis during the middle of the summer, ER could potentially be underestimated if pri-mary production had occurred during the hours used for ER model calibration. Direct validation of the partitioning of measured NEE flux to GPP and ER is not possible. However in a sensitivity study Lasslop et al. (2010) compared two independent meth-ods for partitioning and found general agreement in the results. This agreement across
20
methods increases our confidence in the partitioned GPP and ER estimates in the LaThuile FLUXNET dataset. When measurements come from nearly ideal sites the error bound on the net annual exchange of CO2 has been estimated to be less than
±50 g C m−2yr−1(Baldocchi, 2003). Systematic errors in eddy covariance fluxes due to non-ideal observation conditions are uncertain at this time. Total error is likely below
25
BGD
12, 2257–2305, 2015CO2 exchange across
Northern Eurasia
M. A. Rawlins et al.
Title Page
Abstract Introduction
Conclusions References
Tables Figures
◭ ◮
◭ ◮
Back Close
Full Screen / Esc
Printer-friendly Version
Interactive Discussion
Discussion
P
a
per
|
Discussion
P
a
per
|
Discussion
P
a
per
|
Discussion
P
a
per
|
4.2 Model uncertainties contributing to errors in net CO2sink/source activity
Regionally averaged GPP is within 20 % of the MOD17 average (470 g C m−2yr−1) for 8 of the 9 models. While the models generally capture the spatial pattern in GPP, the percentage of variance explained in several models indicates that improvements are needed. Tower-based data suggest the timing of the seasonal cycle in CO2drawdown
5
and release is well captured in most of the models (Fig. 4). Yet, while peak summer drawdown and to a large extent the net CO2flux (NEP) is well simulated, several
mod-els overestimate by a considerable degree the net CO2source before and after winter
dormancy. Overestimates in GPP and ER are more common than underestimates (Ta-ble 4). Indeed, all errors are positive for site Nur-Hakasija and five of the seven models
10
show relatively large overestimates in ER at Zotino. It should be noted that large sea-sonal flux errors (e.g. Keenan et al., 2012; Richardson et al., 2012; Schaefer et al., 2012) will appear as more modest monthly errors such as those noted in our analysis. While it is not possible to evaluate sources of error separately forRh and Ra, several model processes warrant investigation. The tendency to overestimate GPP suggests
15
that model parametrization and process specifications controlling primary production may require further refinement. Other recent work supports our findings and also sug-gests a closer examination of model-simulated respiration rates is needed. Quegan et al. (2011) found that NPP simulated by two DGVMs examined was nearly balanced by the models’ estimate of Rh. Dolman et al. (2012) find that the GPP increase from
20
1920 to 2008 in the DGVMs of that study is balanced equally by increases in respira-tion. They reported NEP over the Russian territory as an average of three methods at nearly 30 g C m−2yr−1. The DGVM average, however, was only 4.4 g C m−2yr−1and so low that the authors chose to remove the estimates from their final carbon budget. This underestimate was attributed to an excess in heterotrophic respiration. Of the three
25
BGD
12, 2257–2305, 2015CO2 exchange across
Northern Eurasia
M. A. Rawlins et al.
Title Page
Abstract Introduction
Conclusions References
Tables Figures
◭ ◮
◭ ◮
Back Close
Full Screen / Esc
Printer-friendly Version
Interactive Discussion
Discussion
P
a
per
|
Discussion
P
a
per
|
Discussion
P
a
per
|
Discussion
P
a
per
|
Averaged across the nine models NEP is approximately 20 g C m−2yr−1. This is more consistent with the three-method average of Dolman et al. (2012) than the lower DGVM estimates described in their study. The multimodel mean sink of 270 Tg C g C yr−1
esti-mated in this study is also broadly consistent with inventory assessments for Eurasian forests which range between 93 and 347 Tg C yr−1(Hayes et al., 2011). However,
de-5
spite these general agreements, recent research points to phenology as one of the principle sources of error in model simulations of land–atmosphere exchanges of CO2.
Graven et al. (2013) found that the change in NEP simulated by a set of CMIP5 mod-els could not account for the observed increase in the seasonal cycle amplitude in atmospheric CO2concentrations. They point to data showing that boreal regions have
10
experienced greening and shifting age composition which strongly influence NEP and suggest that process models under-represent the observed changes. Model inability to capture canopy phenology has been identified as a major source of model uncer-tainty leading to large seasonal errors in carbon fluxes such as GPP (Keenan et al., 2012; Richardson et al., 2012; Schaefer et al., 2012). Indeed, evaluated against flux
15
tower data across the Eastern US current state-of-the-art terrestrial biosphere models have been found to mis-characterize the temperature sensitivity of phenology, which contributes to poor model performance (Keenan et al., 2014). Examining 11 coupled carbon-climate models from the IPCC Fifth Assessment Report for land areas pole-ward of 30◦N, Anav et al. (2013) found that the models consistently overestimate the
20
mean value of leaf area index (LAI) and have an increased growing season, mostly due to a later dormancy, compared to satellite data. Several of the models also showed de-layed dormancy in autumn and low spatial correlations across the pan Arctic. Dede-layed dormancy would explain much of the error in autumn NEP in land models that has been attributed to overestimation ofRh. Relatively low NEP simulated by several models in
25
the present study support these findings.
BGD
12, 2257–2305, 2015CO2 exchange across
Northern Eurasia
M. A. Rawlins et al.
Title Page
Abstract Introduction
Conclusions References
Tables Figures
◭ ◮
◭ ◮
Back Close
Full Screen / Esc
Printer-friendly Version
Interactive Discussion
Discussion
P
a
per
|
Discussion
P
a
per
|
Discussion
P
a
per
|
Discussion
P
a
per
|
Nilsson (2003) of 139 g C m−2yr−1and Schepaschenko et al. (2013) of 174 g C m−2yr−1 as being more representative for the region. Our benchmark comparisons of ER against tower-based data are consistent with these recent studies and suggest that several models are likely overestimatingRh, particularly over the boreal forest zone. Among the model examined in this study a wide range in soil carbon parameterizations
5
is noted (Table 2). Not surprisingly the effects of active layer depth on the availability of soil organic carbon for decomposition and combustion has been recognized as a key sensitivity in process models (Hayes et al., 2014). Regarding below-ground processes, model parameterizations and processes controlling carbon storage and turnover such as litter decomposition rates and biological activity in frozen soils (Hobbie et al., 2000)
10
require close examination as well. Model simulations ofRhduring the nongrowing sea-son are sensitive to the presence or absence of snow (McGuire et al., 2000), sug-gesting that future studies of mechanisms controlling winter CO2 emissions in tundra
may help resolve uncertainties in processes within land surface models and provide a means to connect a warming climate with vegetation changes, permafrost thaw and
15
CO2source/sink activity across high northern latitude terrestrial ecosystems.
4.3 Uncertainties in temporal trend estimates
Uncertainties exist as to whether tundra areas are presently a net sink or source of CO2. Across tundra regions, process models indicate a stronger sink in the 2000s compared with the 1990s, attributable to a greater increase in vegetation net primary
20
production than heterotrophic respiration in response to warming (McGuire et al., 2012; Belshe et al., 2013). The spatial pattern in multimodel mean NEP in this study points to small areas in Scandinavia (<1 % of the domain) as sources of CO2. Broadly, areas
classified as tundra are a modest CO2sink of approximately 15 g C m− 2
yr−1. Estimates of NEP sink magnitudes must be interpreted with caution knowing that the models in
25
BGD
12, 2257–2305, 2015CO2 exchange across
Northern Eurasia
M. A. Rawlins et al.
Title Page
Abstract Introduction
Conclusions References
Tables Figures
◭ ◮
◭ ◮
Back Close
Full Screen / Esc
Printer-friendly Version
Interactive Discussion
Discussion
P
a
per
|
Discussion
P
a
per
|
Discussion
P
a
per
|
Discussion
P
a
per
|
analyzed here include a dynamic vegetation component. The absence of time-varying vegetation specifications also limits our ability to more accurately assess the influence of changing species composition on NEP in tundra areas. Models must also take into account lateral carbon fluxes and methane (CH4) in order to characterize a more com-prehensive carbon budget.
5
Previous studies have pointed to changes in the seasonal drawdown and release of CO2across the northern high latitudes (Graven et al., 2013). A change in the seasonal cycle of GPP and ER is also noted (figure not shown), with the models analyzed in this study simulating a relatively higher productivity rate from late spring to mid-summer. Indeed, increased productivity did not occur uniformly across the growing season, as
10
most of the models show little change in August or September NEP over time. The models also simulate little change in NEP over the cold season. Greater productivity in spring and early summer may be due in part to earlier spring thawing and temporal advance in growing season initiation (McDonald et al., 2004), whereas GPP and NEP are more strongly constrained by moisture limitations later in the growing season (Yi
15
et al., 2014). Extension of the growing season is therefore attributed more to a regional warming driven advance in spring thaw than a delay in autumn freeze-up (Kimball et al., 2006; Euskirchen et al., 2006; Kim et al., 2012) which correlates with regional annual evapotranspiration for the region above 40◦N (Zhang et al., 2011). There are however signs of a delay in the timing of the fall freeze (−5.4 days decade−1) across
20
Eurasia over the period 1988–2002 (Smith et al., 2004) consistent with fall satellite snow cover (SCE) increases, and attributed to greater fall/winter snowfall and regional cooling (Cohen et al., 2012). Consistent with the advance in spring thaw, the models examined here show a greater NEP increase in spring compared to autumn.
Soil carbon storage across the region increased significantly over the study period
25
BGD
12, 2257–2305, 2015CO2 exchange across
Northern Eurasia
M. A. Rawlins et al.
Title Page
Abstract Introduction
Conclusions References
Tables Figures
◭ ◮
◭ ◮
Back Close
Full Screen / Esc
Printer-friendly Version
Interactive Discussion
Discussion
P
a
per
|
Discussion
P
a
per
|
Discussion
P
a
per
|
Discussion
P
a
per
|
found that while the coupled climate/carbon-cycle models reproduce the latitudinal pat-terns of carbon turnover times, differences between the models of more than one order of magnitude were also noted. The authors suggest that more accurate descriptions of hydrological processes and water–carbon interactions are needed to improve the model estimates of ecosystem carbon turnover times. Apart from climatological
fac-5
tors, vegetation growth is also dependent on biological nitrogen availability. Failure to account for nitrogen limitation may thus impart a bias in the modeled carbon flux esti-mates. However, more process models are incorporating linkages between carbon and nitrogen dynamics (Thornton et al., 2009). Given the broad range in spatial patterns in GPP across the models, a closer examination of processes related to nitrogen
limita-10
tions and primary production is needed. The lower rate of NEP increase over the latter decades of the simulation period suggests a weakening of the land CO2sink, driven by
increasedRh from warming, associated permafrost thaw, and an upward trend in fire emissions (Hayes et al., 2011).
5 Conclusions
15
Outputs from a suite of land surface models were used to investigate elements of the land–atmosphere exchange of CO2 across northern Eurasia over the period 1960–
2009. Evaluated against tower data, overestimates in both GPP and ER are noted in several of the models, with larger errors in ER relative to GPP, particularly for the comparisons at the two forest sites. Regarding agreement in the spatial pattern in GPP,
20
less than half of the variance in GPP expressed in the MOD17 product is explained by the GPP pattern from four of the nine models. Over the simulation period NEP increases between 10 and 400 % of the respective model mean. The models exhibit a decrease in residence time of the soil carbon pool that is driven by an increase inRh, simultaneous with an increase in soil carbon storage. This suggests that net primary
25
BGD
12, 2257–2305, 2015CO2 exchange across
Northern Eurasia
M. A. Rawlins et al.
Title Page
Abstract Introduction
Conclusions References
Tables Figures
◭ ◮
◭ ◮
Back Close
Full Screen / Esc
Printer-friendly Version
Interactive Discussion
Discussion
P
a
per
|
Discussion
P
a
per
|
Discussion
P
a
per
|
Discussion
P
a
per
|
Several recommendations are made as a result of this analysis. The range in area and climatological mean NEP across the models, more than double the mean value, illustrates the considerable uncertainty in the magnitude of the contemporary CO2sink.
The results of the site-level comparison point to a need to better understand the con-nections between model simulated productivity rates, soil dynamics controlling
het-5
erotrophic respiration rates, and errors in total ER. Given the strong connections be-tween soil thermal and hydrological variations and soil respiration, we recommend that model improvements are targeted at processes and parameterizations controlling soil respiration with depth in the soil profile. These validation efforts are especially impor-tant given the likelihood of net carbon transfer from ecosystems to the atmosphere from
10
permafrost thaw (Schuur and Abbott , 2012). Model responses to CO2fertilization and nitrogen limitation, processes largely underrepresented in the models, should be eval-uated in the context of ecosystem productivity in this region. While insights have been gained by examining the model estimates of GPP, ER, and NEP, an improved under-standing of the net CO2sink/source activity will require improvements in carbon losses
15
due to fire and other disturbances. The limited number of measured site data across this important region clearly hampers model assessments, highlighting the critical need for new field, tower, and aircraft data for model validation and parametrization. Specifi-cally, new observations in the boreal zone are needed to further evaluate model biases documented in this and in other recent studies. Moreover, our finding of elevated CO2
20
source activity during the shoulder seasons points to a critical need for more observa-tions during autumn, winter, and spring. New observaobserva-tions from current and upcoming field campaigns such as Carbon in Arctic Reservoirs Vulnerability Experiment (CARVE) and the Arctic Boreal Vulnerability Experiment (ABoVE) should be used to confirm our results. Future model evaluations will benefit from continued development of
consis-25
min-BGD
12, 2257–2305, 2015CO2 exchange across
Northern Eurasia
M. A. Rawlins et al.
Title Page
Abstract Introduction
Conclusions References
Tables Figures
◭ ◮
◭ ◮
Back Close
Full Screen / Esc
Printer-friendly Version
Interactive Discussion
Discussion
P
a
per
|
Discussion
P
a
per
|
Discussion
P
a
per
|
Discussion
P
a
per
|
imize or eliminate differences in a priori climate forcings used in the simulations. At a programmatic level support for these activities should lead to well designed model intercomparisons which minimize, to the extent possible, differences in model forcings and other elements which confound model intercomparisons.
Author contributions. M. A. Rawlins conceived the study with input from A. D. McGuire,
5
J. K. Kimball and P. Dass. Co-authors D. Lawrence, E. Burke, X. Chen, C. Delire, C. Koven, A. MacDougall, S. Peng, A. Rinke, K. Saito, W. Zhang, R. Alkama, T. J. Bohn, P. Ciais, B. Decharme, I. Gouttevin, T. Hajima, D. Ji, G. Krinner, D. P. Lettenmaier, P. Miller, J. C. Moore, B. Smith, and T. Sueyoshi provided model simulation outputs. M. A. Rawlins analyzed the outputs and other data. M. A. Rawlins prepared the manuscript with contributions from all
co-10
authors.
Acknowledgements. This research was supported by the U.S. National Aeronautics and Space Administration NASA grant NNX11AR16G and the Permafrost Carbon Network (http://www. permafrostcarbon.org/) funded by the National Science Foundation. The MODIS Land Cover Type product data was obtained through the online Data Pool at the NASA Land Processes
Dis-15
tributed Active Archive Center (LP DAAC), USGS/Earth Resources Observation and Science (EROS) Center, Sioux Falls, South Dakota (https://lpdaac.usgs.gov/data_access). We thank the researchers working at FLUXNET sites for kindly providing CO2 flux data. We also thank Eugenie Euskirchen and Dan Hayes for comments on an earlier version of the manuscript, and Yonghong Yi for assistance with the FLUXNET data. Charles Koven was supported by
20
the Director of the Office of Biological and Environmental Research, Office of Science, U.S. Department of Energy, under Contract DE-AC02-05CH11231 as part of the Regional and Global Climate Modeling Program (RGCM). Eleanor J. Burke was supported by the Joint UK DECC/Defra Met Office Hadley Centre Climate Programme (GA01101) and the European Union Seventh Framework Programme (FP7/2007–2013) under grant agreement no. 282700.
25
BGD
12, 2257–2305, 2015CO2 exchange across
Northern Eurasia
M. A. Rawlins et al.
Title Page
Abstract Introduction
Conclusions References
Tables Figures
◭ ◮
◭ ◮
Back Close
Full Screen / Esc
Printer-friendly Version
Interactive Discussion
Discussion
P
a
per
|
Discussion
P
a
per
|
Discussion
P
a
per
|
Discussion
P
a
per
|
References
Anav, A., Murray-Tortarolo, G., Friedlingstein, P., Sitch, S., Piao, S., and Zhu, Z.: Evaluation of land surface models in reproducing satellite Derived leaf area index over the high-latitude Northern Hemisphere. Part II: Earth system models, Remote Sens., 5, 3637–3661, 2013. 2273
5
Avis, C. A., Weaver, A. J., and Meissner, K. J.: Reduction in areal extent of high-latitude wet-lands in response to permafrost thaw, Nat. Geosci., 4, 444–448, 2011. 2263
Baldocchi, D.: Turner Review No. 15. “Breathing” of the terrestrial biosphere: lessons learned from a global network of carbon dioxide flux measurement systems, Aust. J. Bot., 56, 1–26, 2008. 2264, 2290, 2291
10
Baldocchi, D. D.: Assessing the eddy covariance technique for evaluating carbon dioxide ex-change rates of ecosystems: past, present and future, Glob. Change Biol., 9, 479–492, 2003. 2271
Belshe, E., Schuur, E., and Bolker, B.: Tundra ecosystems observed to be CO2sources due to differential amplification of the carbon cycle, Ecol. Lett., 16, 1307–1315, 2013. 2261, 2274
15
Best, M. J., Pryor, M., Clark, D. B., Rooney, G. G., Essery, R .L. H., Ménard, C. B., Ed-wards, J. M., Hendry, M. A., Porson, A., Gedney, N., Mercado, L. M., Sitch, S., Blyth, E., Boucher, O., Cox, P. M., Grimmond, C. S. B., and Harding, R. J.: The Joint UK Land Envi-ronment Simulator (JULES), model description – Part 1: Energy and water fluxes, Geosci. Model Dev., 4, 677–699, doi:10.5194/gmd-4-677-2011, 2011. 2263
20
Bohn, T. J., Podest, E., Schroeder, R., Pinto, N., McDonald, K. C., Glagolev, M., Filippov, I., Maksyutov, S., Heimann, M., Chen, X., and Lettenmaier, D. P.: Modeling the large-scale effects of surface moisture heterogeneity on wetland carbon fluxes in the West Siberian Lowland, Biogeosciences, 10, 6559–6576, doi:10.5194/bg-10-6559-2013, 2013. 2263 Bond-Lamberty, B., Wang, C., and Gower, S. T.: A global relationship between the heterotrophic
25
and autotrophic components of soil respiration?, Glob. Change Biol., 10, 1756–1766, 2004. 2268
Carvalhais, N., Forkel, M., Khomik, M., Bellarby, J., Jung, M., Migliavacca, M., Mu, M., Saatchi, S., Santoro, M., Thurner, M., Weber, U., Ahrens, B., Beer, C., Cescatti, A., Ran-derson, J. T., and Reichstein, M.: Global covariation of carbon turnover times with climate in
30
BGD
12, 2257–2305, 2015CO2 exchange across
Northern Eurasia
M. A. Rawlins et al.
Title Page
Abstract Introduction
Conclusions References
Tables Figures
◭ ◮
◭ ◮
Back Close
Full Screen / Esc
Printer-friendly Version
Interactive Discussion
Discussion
P
a
per
|
Discussion
P
a
per
|
Discussion
P
a
per
|
Discussion
P
a
per
|
Chapin III, F. S., Sturm, M., Serreze, M. C., McFadden, J. P., Key, J. R., Lloyd, A. H., McGuire, A. D., Rupp, T. S., Lynch, A. H., Schimel, J. P., Beringer, J., Chapman, W. L., Epstein, H. E., Euskirchen, E. S., Hinzman, L. D., Jia, G., Ping, C.-L., Tape, K. D., Thomp-son, C. D. C., Walker, D. A., and Welker, J. M.: Role of land-surface changes in Arctic summer warming, Science, 310, 657–660, doi:10.1126/science.1117368, 2005. 2263
5
Clark, D. B., Mercado, L. M., Sitch, S., Jones, C. D., Gedney, N., Best, M. J., Pryor, M., Rooney, G. G., Essery, R. L. H., Blyth, E., Boucher, O., Harding, R. J., Huntingford, C., and Cox, P. M.: The Joint UK Land Environment Simulator (JULES), model description – Part 2: Carbon fluxes and vegetation dynamics, Geosci. Model Dev., 4, 701–722, doi:10.5194/gmd-4-701-2011, 2011. 2263
10
Cohen, J. L., Furtado, J. C., Barlow, M. A., Alexeev, V. A., and Cherry, J. E.: Arctic warming, increasing snow cover and widespread boreal winter cooling, Environ. Res. Lett., 7, 501– 506, 2012. 2275
Cox, P. M., Betts, R. A., Jones, C. D., Spall, S. A., and Totterdell, I. J.: Acceleration of global warming due to carbon-cycle feedbacks in a coupled climate model, Nature, 408, 184–187,
15
doi:10.1038/35041539, 2000. 2260
Crutzen, P. J.: The “Anthropocene”, in: Earth System Science in the Anthropocene, edited by: Ehlers, P. D. E. and Krafft, D. T., Springer, Berlin, Heidelberg, 13–18, available at: http: //link.springer.com/chapter/10.1007/3-540-26590-2_3, 2006. 2260
Dai, Y., Zeng, X., Dickinson, R. E., Baker, I., Bonan, G. B., Bosilovich, M. G., Denning, A. S.,
20
Dirmeyer, P. A., Houser, P. R., Niu, G., et al.: The common land model, B. Am. Meteorol. Soc., 84, doi:10.012/201590876, 2003. 2263
Dai, Y., Dickinson, R. E., and Wang, Y.-P.: A two-big-leaf model for canopy temperature, photo-synthesis, and stomatal conductance., J. Climate, 17, 2281–2299, 2004. 2263
Decharme, B., Boone, A., Delire, C., and Noilhan, J.: Local evaluation of the interaction between
25
soil biosphere atmosphere soil multilayer diffusion scheme using four pedotransfer functions, J. Geophys. Res.-Atmos., 116, D20126, doi:10.1029/2011JD01600.2, 2011. 2263
Dolman, A. J., Shvidenko, A., Schepaschenko, D., Ciais, P., Tchebakova, N., Chen, T., van der Molen, M. K., Belelli Marchesini, L., Maximov, T. C., Maksyutov, S., and Schulze, E.-D.: An estimate of the terrestrial carbon budget of Russia using inventory-based, eddy
covari-30
BGD
12, 2257–2305, 2015CO2 exchange across
Northern Eurasia
M. A. Rawlins et al.
Title Page
Abstract Introduction
Conclusions References
Tables Figures
◭ ◮
◭ ◮
Back Close
Full Screen / Esc
Printer-friendly Version
Interactive Discussion
Discussion
P
a
per
|
Discussion
P
a
per
|
Discussion
P
a
per
|
Discussion
P
a
per
|
Dutta, K., Schuur, E. A. G., Neff, J. C., and Zimov, S. A.: Potential carbon release from permafrost soils of Northeastern Siberia, Glob. Change Biol., 12, 2336–2351, doi:10.1111/j.1365-2486.2006.01259.x, 2006. 2260
Euskirchen, E., McGuire, A. D., Kicklighter, D. W., Zhuang, Q., Clein, J. S., Dargaville, R., Dye, D., Kimball, J. S., McDonald, K. C., Melillo, J. M., et al.: Importance of recent shifts
5
in soil thermal dynamics on growing season length, productivity, and carbon sequestration in terrestrial high-latitude ecosystems, Glob. Change Biol., 12, 731–750, 2006. 2260, 2275 Fisher, J. B., Sikka, M., Oechel, W. C., Huntzinger, D. N., Melton, J. R., Koven, C. D.,
Ahlström, A., Arain, M. A., Baker, I., Chen, J. M., Ciais, P., Davidson, C., Dietze, M., El-Masri, B., Hayes, D., Huntingford, C., Jain, A. K., Levy, P. E., Lomas, M. R., Poulter, B.,
10
Price, D., Sahoo, A. K., Schaefer, K., Tian, H., Tomelleri, E., Verbeeck, H., Viovy, N., Wa-nia, R., Zeng, N., and Miller, C. E.: Carbon cycle uncertainty in the Alaskan Arctic, Biogeo-sciences, 11, 4271–4288, doi:10.5194/bg-11-4271-2014, 2014. 2261
Goetz, S. J., Bunn, A. G., Fiske, G. J., and Houghton, R.: Satellite-observed photosynthetic trends across boreal North America associated with climate and fire disturbance, P. Natl.
15
Acad. Sci. USA, 102, 13521–13525, 2005. 2260
Goetz, S. J., Fiske, G. J., and Bunn, A. G.: Using satellite time-series data sets to analyze fire disturbance and forest recovery across Canada, Remote Sens. Environ., 101, 352–365, 2006. 2260
Gouttevin, I., Menegoz, M., Dominé, F., Krinner, G., Koven, C., Ciais, P., Tarnocai, C., and
20
Boike, J.: How the insulating properties of snow affect soil carbon distribution in the continen-tal pan-Arctic area, J. Geophys. Res.-Biogeo., 117, G02020, doi:10.1029/2011JG001916, 2012. 2263
Graven, H., Keeling, R., Piper, S., Patra, P., Stephens, B., Wofsy, S., Welp, L., Sweeney, C., Tans, P., Kelley, J., et al.: Enhanced seasonal exchange of CO2 by northern ecosystems
25
since 1960, Science, 341, 1085–1089, 2013. 2260, 2273, 2275
Groisman, P. and Soja, A. J.: Ongoing climatic change in Northern Eurasia: justification for ex-pedient research, Environ. Res. Lett., 4, 045002, doi:10.1088/1748-9326/4/4/045002, 2009. 2262
Groisman, P. Y. and Bartalev, S. A.: Northern Eurasia Earth Science Partnership Initiative
30
(NEESPI), science plan overview, Global Planet. Change, 56, 215–234, 2007. 2262
BGD
12, 2257–2305, 2015CO2 exchange across
Northern Eurasia
M. A. Rawlins et al.
Title Page
Abstract Introduction
Conclusions References
Tables Figures
◭ ◮
◭ ◮
Back Close
Full Screen / Esc
Printer-friendly Version
Interactive Discussion
Discussion
P
a
per
|
Discussion
P
a
per
|
Discussion
P
a
per
|
Discussion
P
a
per
|
partnership: an example of science applied to societal needs, B. Am. Meteorol. Soc., 90, 671–688, 2009. 2262
Hayes, D. and Turner, D.: The need for “apples-to-apples” comparisons of carbon dioxide source and sink estimates, EOS T. Am. Geophys. Un., 93, 404–405, 2012. 2268
Hayes, D. J., McGuire, A. D., Kicklighter, D. W., Gurney, K., Burnside, T., and Melillo, J. M.: Is
5
the northern high-latitude land-based CO2 sink weakening?, Global Biogeochem. Cy., 25, GB3018, doi:10.1029/2010GB003813, 2011. 2261, 2273, 2274, 2276
Hayes, D. J., Kicklighter, D. W., McGuire, A. D., Chen, M., Zhuang, Q., Yuan, F., Melillo, J. M., and Wullschleger, S. D.: The impacts of recent permafrost thaw on land–atmosphere green-house gas exchange, Environ. Res. Lett., 9, 045005, doi:10.1088/1748-9326/9/4/045005,
10
2014. 2274
Hobbie, S. E., Schimel, J. P., Trumbore, S. E., and Randerson, J. R.: Controls over carbon stor-age and turnover in high-latitude soils, Glob. Change Biol., 6, 196–210, doi:10.1046/j.1365-2486.2000.06021.x, 2000. 2274
International Permafrost Association Standing Committee on Data Information and
Communi-15
cation (comp.): Circumpolar Active-Layer Permafrost System (CAPS), Tech. rep., National Snow and Ice Data Center, doi:10.7265/N5SF2T3B, 2003.
Keenan, T., Baker, I., Barr, A., Ciais, P., Davis, K., Dietze, M., Dragoni, D., Gough, C. M., Grant, R., Hollinger, D., et al.: Terrestrial biosphere model performance for inter-annual vari-ability of land–atmosphere CO2exchange, Glob. Change Biol., 18, 1971–1987, 2012. 2272,
20
2273
Keenan, T. F., Gray, J., Friedl, M. A., Toomey, M., Bohrer, G., Hollinger, D. Y., Munger, J. W., O’Keefe, J., Schmid, H. P., Wing, I. S., et al.: Net carbon uptake has increased through warming-induced changes in temperate forest phenology, Nat. Clim. Change, 499l, 324–327, 2014. 2273
25
Kim, Y., Kimball, J., Zhang, K., and McDonald, K.: Satellite detection of increasing Northern Hemisphere non-frozen seasons from 1979 to 2008: Implications for regional vegetation growth, Remote Sens. Environ., 121, 472–487, 2012. 2275
Kimball, J., McDonald, K., and Zhao, M.: Spring thaw and its effect on terrestrial vegetation pro-ductivity in the western Arctic observed from satellite microwave and optical remote sensing,
30
Earth Interact., 10, 1–22, 2006. 2275
insu-BGD
12, 2257–2305, 2015CO2 exchange across
Northern Eurasia
M. A. Rawlins et al.
Title Page
Abstract Introduction
Conclusions References
Tables Figures
◭ ◮
◭ ◮
Back Close
Full Screen / Esc
Printer-friendly Version
Interactive Discussion
Discussion
P
a
per
|
Discussion
P
a
per
|
Discussion
P
a
per
|
Discussion
P
a
per
|
lation by organic matter in a land surface model, Geophys. Res. Lett., 36, L21501, doi:10.1029/2009GL040150, 2009. 2263
Koven, C. D., Ringeval, B., Friedlingstein, P., Ciais, P., Cadule, P., Khvorostyanov, D., Krinner, G., and Tarnocai, C.: Permafrost carbon-climate feedbacks accelerate global warming, P. Natl. Acad. Sci. USA, 108, 14769–14774, 2011. 2261, 2263
5
Kurganova, I. and Nilsson, S.: Carbon dioxide emission from soils of Russian terrestrial ecosys-tems, Interim Report, IR-02, 70, 2003. 2273
Lasslop, G., Reichstein, M., Papale, D., Richardson, A. D., Arneth, A., Barr, A., Stoy, P., and Wohlfahrt, G.: Separation of net ecosystem exchange into assimilation and respiration using a light response curve approach: critical issues and global evaluation, Glob. Change Biol.,
10
16, 187–208, 2010. 2271
MacDougall, A. H., Eby, M., and Weaver, A. J.: If anthropogenic CO2 emissions cease, will atmospheric CO2 concentration continue to increase?, J. Climate, 26, 9563–9576, 2013. 2261, 2263
McDonald, K. C., Kimball, J. S., Njoku, E., Zimmermann, R., and Zhao, M.: Variability in
spring-15
time thaw in the terrestrial high latitudes: monitoring a major control on biospheric assim-ilation of atmospheric CO2 with spaceborne microwave remote sensing, Earth Interact., 8, 1–23, 2004. 2275
McGuire, A., Melillo, J., Randerson, J., Parton, W., Heimann, M., Meier, R., Clein, J., Kicklighter, D., and Sauf, W.: Modeling the effects of snowpack on heterotrophic
respi-20
ration across northern temperate and high latitude regions: comparison with measure-ments of atmospheric carbon dioxide in high latitudes, Biogeochemistry, 48, 91–114, doi:10.1023/A:1006286804351, 2000. 2274
McGuire, A. D., Christensen, T. R., Hayes, D., Heroult, A., Euskirchen, E., Kimball, J. S., Koven, C., Lafleur, P., Miller, P. A., Oechel, W., Peylin, P., Williams, M., and Yi, Y.: An
as-25
sessment of the carbon balance of Arctic tundra: comparisons among observations, pro-cess models, and atmospheric inversions, Biogeosciences, 9, 3185–3204, doi:10.5194/bg-9-3185-2012, 2012. 2260, 2264, 2274
Melillo, J. M., McGuire, A. D., Kicklighter, D. W., Moore, B., Vorosmarty, C. J., and Schloss, A. L.: Global climate change and terrestrial net primary production, Nature, 363, 234–240, 1993.
30
2260


![Table 5. Trend in GPP, ER, and NEP over simulation period for each model. Trend slopes (g C m −2 yr −2 ) are estimated using an auto-regressive AR[1] model to account for temporal au-tocorrelation](https://thumb-eu.123doks.com/thumbv2/123dok_br/18197960.333132/36.918.180.528.267.482/trend-simulation-slopes-estimated-regressive-account-temporal-tocorrelation.webp)