of Chemical
Engineering
ISSN 0104-6632 Printed in Brazil www.abeq.org.br/bjche
Vol. 34, No. 02, pp. 567 - 581, April - June, 2017 dx.doi.org/10.1590/0104-6632.20170342s20150631
RED WINE EXTRACT OBTAINED BY
MEMBRANE-BASED SUPERCRITICAL FLUID EXTRACTION:
PRELIMINARY CHARACTERIZATION OF
CHEMICAL PROPERTIES.
W. S
ilva
1, J. Romero
1*, E. Morales
1, R. Melo
2, L. Mendoza
2and M. Cotoras
31Laboratory of Membrane Separation Processes (LabProSeM), Department of Chemical Engineering, University of Santiago de Chile. Phone: +56 2 27181821
E-mail: [email protected]
2Department of Materials Chemistry, Faculty of Chemistry and Biology, University of Santiago de Chile. 3Department of Biology, Faculty of Chemistry and Biology, University of Santiago de Chile.
(Submitted: October 7, 2015; Revised: December 21, 2015; Accepted: January 24, 2016)
Abstract – This study aims to obtain an extract from red wine by using membrane-based supercritical luid
extraction. This technique involves the use of porous membranes as contactors during the dense gas extraction process from liquid matrices. In this work, a Cabernet Sauvignon wine extract was obtained from supercritical
luid extraction using pressurized carbon dioxide as solvent and a hollow iber contactor as extraction setup. The
process was continuously conducted at pressures between 12 and 18 MPa and temperatures ranged from 30 to
50ºC. Meanwhile, low rates of feed wine and supercritical CO2 varied from 0.1 to 0.5 mL min
-1 and from 60 to
80 mL min-1 (NCPT), respectively. From extraction assays, the highest extraction percentage value obtained from the total amount of phenolic compounds was 14% in only one extraction step at 18MPa and 35ºC. A summarized chemical characterization of the obtained extract is reported in this work; one of the main compounds in this extract could be a low molecular weight organic acid with aromatic structure and methyl and carboxyl groups. Finally, this preliminary characterization of this extract shows a remarkable ORAC value equal to 101737 ± 5324 µmol Trolox equivalents (TE) per 100 g of extract.
Keywords: Supercritical luid extraction, wine, membrane contactor, extract, chemical characterization.
INTRODUCTION
In terms of food classiication, some foods and beverages are not classiied as functional, but these contain
active substances of natural origin and may provide the
same beneits ofered by functional foods like green tea,
chocolate and red wine (Sarmento et al., 2008).
Wines, speciically the red wines, are a rich source of diferent phenolic compounds, which contribute to its
sensorial and antioxidant properties. Phenolic compounds
have been identiied as antioxidant, anti-inlammatory,
neuro-sedative, anti-viral, anti-cancer and antimicrobial agents (Atanackovic et al., 2012; Colon and Nerin, 2012) and these are synthesized during plant growth in response to stress, representing the basic components of
pigments, essences and lavors. These compounds are
directly related to a huge variety of applications in food technology because of their contribution to oxidative stability and organoleptic characteristics (Sánchez et al., 2012). In humans, the consumption of these compounds
has frequently demonstrated positive efects on health, due
absorption, triglyceride equilibrium and plasma lipoprotein processing. Furthermore, phenolic compounds may
induce cardiovascular protective efects. Thanks to their antioxidant, vasodilator, anti-inlammatory, anti-ibrotic,
antiapoptotic and metabolic properties, these biological properties are attributed mainly to their antioxidant and antiradical activity, which is related generally to the redox properties (Sánchez et al., 2012; Quintieri et al., 2012; Porgali and Büyüktuncel, 2011). At the same time, it is possible that all the properties described for red wines are
due the efect of a mixture of compounds, rather than the efect of just one type of compound (Mendoza et al., 2011).
MEMBRANE –BASEDSUPERCRITICAL FLUID EXTRACTION TO OBTAIN WINE EXTRACTS
Chemical composition of wines
The phenolic compounds present in wines mainly derive from simple benzoic and cinnamic acids, stilbenes
and lavonoids, which lead to more complex compounds
formed by condensation, glycosylation and polymerization, where relevant contributions are made by tannic acids, anthocyanins, stilbene dimers, tartaric esters of cinnamic acids and proanthocyanidins and most generally could be divided into two major classes, based on their carbon
structure: lavonoids and non-lavonoids. Flavonoids include anthocyanidins, lavanols, lavones and lavanones. The main non-lavonoid phenolic compounds include
cinnamic acids, benzoic acids and stilbenes (Sánchez et al., 2012; Granato et al., 2011). Moreover, the phenolic acids are one of the most important quality parameters of wine, and they contribute to characteristics such as astringency and bitterness (Mendoza et al., 2011). Furthermore, some authors report direct and rapid chromatographic protocols
for identiication of speciic active species in red wine,
grape, and winemaking byproducts (Careri et al., 2003; Kolouchová-Hanzlíková et al., 2004).
On the other hand, through the supply chain of a
product like red wine, we might ind inal products that
do not meet the quality criteria, which may be a potential source for production of phenolic extracts, functional food components, healthy ingredients and additives (Boussetta et al., 2011). This extracts can be obtained by conventional and non-conventional processes.
The extraction process is a critical step in the isolation and recovery of high-added value compounds, in particular phenolic compounds (Aliakbarian et al., 2010). At the industrial scale, hydrodistillation or solvent extraction using methanol, ethanol, acetone or ethyl acetate, represent the traditional extraction methods for recovery of phenolic compounds from vegetable byproducts. These techniques require high volumes of organic solvents, which involve a high environmental impact (Li and Chase, 2010; García– Abarrio et al., 2012).
Membrane–based supercritical luid extraction
At present, membrane processes have been extensively applied to the recovery of valuable products (Li and Chase, 2010), which preserve the biological activity of the compounds contained in the raw materials, since these techniques reduce the consumption of chemicals, operating generally at low temperature.
On the other hand, supercritical luids (SCFs) are good
extracting solvents, with density and viscosity close to
liquids and difusivities of species like in gases (Bocquet et al., 2007; Oliveira et al., 2012). Carbon dioxide is a luid
widely used as supercritical solvent because of its relatively low critical point (Tc= 304.15 K and Pc = 7.28 MPa) and non-toxic character. Furthermore, after extraction it is easy to separate it from the solute of interest by means of a depressurization step.
Membrane-based supercritical luid extraction or Porocritical extraction is a commercial supercritical luid extraction (SFC), which uses a hollow iber membrane
contactor (HFMC). In this process a macroporous membrane allows contact between two phases, where an aqueous liquid solution is circulated on one side and on the other side the extraction solvent in a SCF (Estay et al., 2007). However, supercritical CO2 (scCO2) shows
ainity with lipophilic compounds and this characteristic
becomes an inconvenience when polar compounds must be extracted, therefore, organic solvent (ethanol, methanol, ethyl acetate) mixtures – CO2 under pressure have also been used to improve the extraction. Results reported by Santos and coworkers (Santos et al., 2012) showed a
signiicant performance increase of phenolic extraction
when ethanol was added as cosolvent. Meanwhile, the number of species detected by HPLC-MS increased from two to sixteen with this change. In the same way, Murga et al. (2000) reported that low molecular weight polyphenols were better extracted with scCO2 and 15 % of methanol.
Previous studies by Yilmaz et al. (2011) on supercritical
luid extraction (SFE) show that the most important efect on the extraction of proanthocyanidins from dry
grape seed in batch mode was the amount of ethanol added as cosolvent. Moreover, a large body of literature
reports diferent experimental procedures for extraction of phenolic compounds using supercritical luids and
cosolvents (Satyajit and Lutfun, 2012).
Ruiz-Rodriguez et al. (2010) reported the production of a functional beverage prepared from wine, which was dealcoholized, obtaining a concentration of ethanol equal
to 1% (v/v), by means of supercritical luid extraction
using a packed column of 2.8 m height with a pressure of 9.5 MPa and a temperature of 313K.
To our knowledge, there is no previous research on
the continuous supercritical luid extraction of speciic
compounds from wine using a membrane contactor device. In this work, an extract of red wine was obtained from
non-dispersive contact between the wine and dense carbon dioxide streams was achieved by a specially implemented
hollow iber contactor device.
This work aims to identify the main operating variables on the overall extraction performance, as well as to show a preliminary chemical characterization of the extract in terms of its potential applications.
METHODOLOGY
Materials and reagents
Chilean red wine Cabernet Sauvignon (Gran 120, Viña Santa Rita, L1309.2S) was obtained from a local market (Santiago, Chile). Meanwhile, liquid CO2 (purity
≥ 99.0 %) was obtained from Praxair Chile. Furthermore,
gallic acid C7H6O5 (purity ≥ 99.0 %), sodium carbonate Na2CO3 (purity ≥ 99.9 %), Folin-Ciocalteu phenol reagent,
deuterated chloroform (purity ≥ 99.8 %), glacial acetic acid (purity ≥ 99 %) and methanol (HPLC grade) were supplied
by Merck. Acetonitrile (HPLC grade) and RMN tubes were obtained from Sigma Aldrich Chile.
Membrane–based supercritical extraction assays
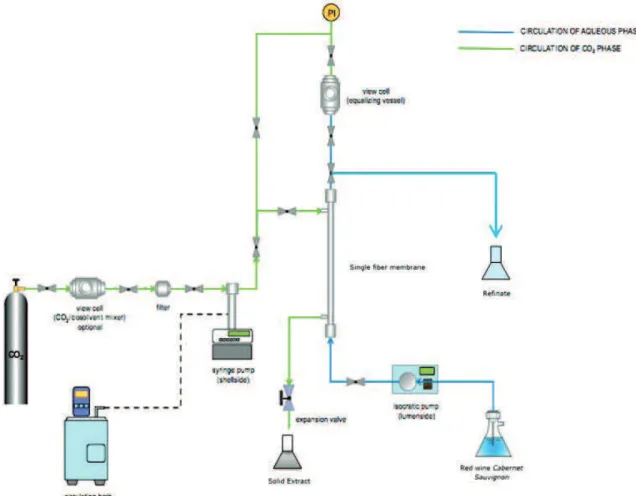
The supercritical luid extraction setup was designed and built in the Laboratory of Membrane Separation Processes, LabProSeM, at the University of Santiago de Chile. This system contains a membrane contactor, which
is formed by a single PTFE iber (GoreTeX©; porosity=60
%; ID = 1.0 mm; OD = 1.8 mm), which is housed in a
stainless steel module. This hollow iber membrane
contactor separates two independent circuits, one for the
wine circulated into the lumen of the iber by means of an
isocratic pump (Jasco®PU-2080) and another one for the scCO2 stream, which was circulated through the shell side by using a ISCO® 500D syringe pump. Red wine Cabernet Sauvignon was iltered before circulation through the extraction system.
This extraction system was operated in steady-state conditions and wine and scCO2 streams were contacted countercurrently in the membrane contactor. Extract and
rainate samples were collected 15 min after the beginning
of the operation in order to reach the steady state. Figure 1 shows the outline of the membrane-based extraction apparatus.
Preliminary experiments were carried out in order to evaluate the feasibility of phenolic extraction from Chilean red wine Cabernet Sauvignon. The operational conditions tested involved temperatures ranging from 303 to 323 K, pressure varying from 120 to 180 bar and CO2 low rate between 60 and 80 mL min-1 (NCPT); meanwhile, wine
low rates ranged from 0.1 to 0.5 mL min-1.
In order to assess the inluence of the operational
conditions on the extraction performance of this process, a full 34 factorial design, which was distributed in 9 blocks,
was previously deined.This experimental design considers the assessment of the efect of temperature, pressure, CO2
low rate and wine low rate on the extraction percentage (%) and overall transmembrane phenolic lux (mol GAE
h-1 m-2).
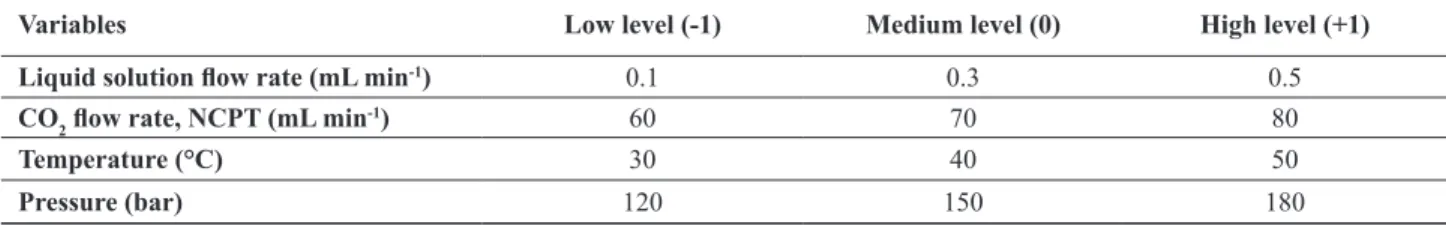
The coded and not-coded values of operating variables are reported in Table 1. The statistical analyses were carried out using the software Statgraphics® Centurion XV Version 15.2.05.
Table 1. Range of select levels for the variables in continuous supercritical extraction method.
Variables Low level (-1) Medium level (0) High level (+1)
Liquid solution low rate (mL min-1) 0.1 0.3 0.5
CO2 low rate, NCPT (mL min-1) 60 70 80
Temperature (°C) 30 40 50
Pressure (bar) 120 150 180
The experimental extraction percentage was estimated
from the diference between the total concentration of phenolic compounds in the raw wine (in) and in the processed wine (out). This value is represented by equation 1:
Simultaneously, overall phenolic transmembrane lux
transferred through the contactor was calculated from the
extraction percentage value according to equation 2.
where Qfeedwine represents the wine low rate, MW
G.Ac is the
molecular weight of gallic acid and Ainnermantle is the contact
surface available for mass transfer into the lumen side. Probably, the extract is not composed exclusively of phenolic compounds, but these compounds represent a
good basis to quantify the eiciency to obtain a dry extract
from red wine.
Chemical characterization of wine and extracts: analytical methods
Total phenolic content
The total polyphenols extraction was quantiied using
the Folin-Ciocalteu method (Sarmento et al., 2008) at 760 nm. The concentration of phenolic compounds in was calculated using Gallic acid standard solutions between 5 and 55 µg mL-1 and the measurement were carried out in
duplicate. The result was expressed as equivalent of gallic acid (mg GAE mL-1 red wine).
Determination of ethanol content in raw wine and
rainate
The concentration of ethanol for raw wine and rainate obtained after extraction were quantiied by HPLC. This
analysis was done with an Aminex HPX–87 H column, stainless steel 300 mm x 7.8 mm. The isocratic separation was done at 323K, using 0.004 M sulfuric acid solution as
mobile phase with a volumetric low rate of 0.5 mL min-1
and running time of 30 min.
FTIR spectrum measurement
FTIR spectroscopy (Bruker, model ALPHA) was carried out on the dry extract obtained from the expansion valve of the membrane-based supercritical extractor device described in Figure 1. After expansion through the valve, freeze-drying at pressures between 0.01 and 0.10 mbar and – 40 ºC during 24 hours was applied to dry the collected extract sample.
����������
�����
(%) =
�����ℎ�����
������
− �����ℎ�����
��� ���������ℎ�����
�������
100
������
.
����
���
���
ℎ
−1�
−2=
�����ℎ�����
������
− �����ℎ�����
��� �����
������������
�
���������
.
�
�.��(1)
On the other hand, the extract samples were analyzed
by Attenuated Total Relectance (ATR) spectroscopy,
scanned from 4000 to 400 cm-1 at 4 cm-1 and 24 scans were
generated per sample. Meanwhile, the processing of the obtained spectra was done with the Software Opus V.7.
Analytical and semipreparative HPLC of extracts
Both analytical and semipreparative HPLC of extracts were carried out with a Waters 600 Chromatograph (Waters, Mildford, MA, USA), which was equipped with detector array diode Waters 2990. Analytical HPLC was achieved using a Symmetry C18 column (5 µm) 4.6 x 250 mm with 0.8 mL min-1of mobile phase at room temperature
by means of reverse phase with gradient (Table 2) at a wavelength of 300 nm. Moreover, semipreparative HPLC was implemented using a semipreparative column Waters Spherisorb S10 ODS2 10 x 250 mm isocratically operated
(1400 psi) with mobile phase low rates of 1.5 mL min-1
and acetic acid (1%)/acetonitrile ratio equal to 40:60 at 300 nm.
The 1H NMR spectra (400.13 Hz) and 13C (100.62 Hz)
were recorded in CDCL3 solvent using a Bruker Advance DRX400 spectrometer with TMS as internal standard at 30 ºC.
Antioxidant capacity ORAC assay
The procedure for ORAC assays was deined according
to the method reported by Zhang et al. (2010). AAPH was used as a peroxyl radical generator, Trolox as a standard,
and luorescein as a luorescent probe. The assays were
carried out on a Victor Multilabel (Perkin Elmer, Germany) plate reader. All samples were analyzed in triplicate. The
inal ORAC value was calculated from the net area under the luorescence decay curve and expressed in µmol Trolox
equivalent (TE) per 100 g of sample.
RESULTS AND DISCUSSION
Extraction performance
Extraction assays were done according to the procedure described above. The extraction performance was assessed through the experimental estimation of extraction
percentage and transmembrane lux of total phenolic
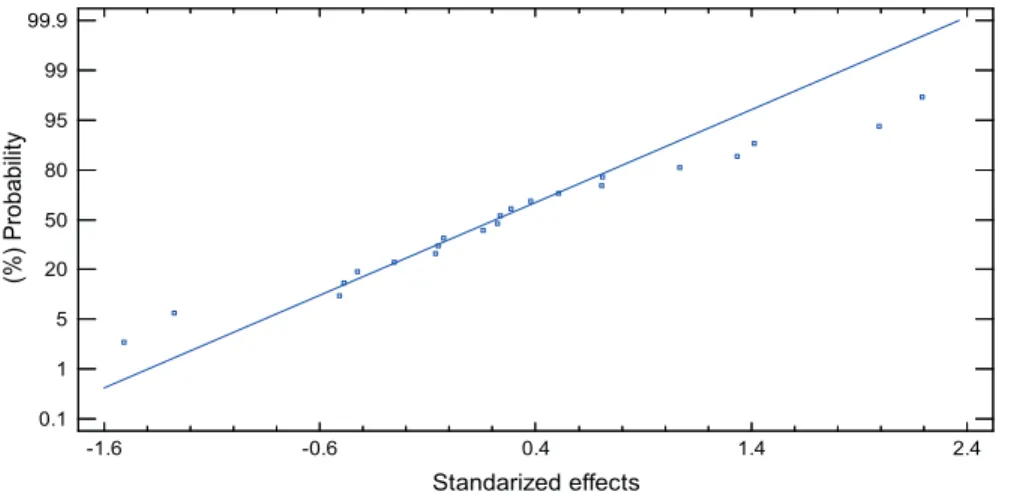
compounds, which were estimated from equations 1 and 2, respectively. Figure 2 shows the normal probability plot for extraction yield where it can be observed that extraction experiments were correctly done according to the random distribution of these tests.
Table 3 shows the summary of the extraction eiciency and transmembrane low (expressed in GAE, Gallic Acid
Equivalent) obtained from experiments as a function of pressure, temperature, wine and scCO2 low rates. This
table shows that the most signiicant efect on the extraction percentage of total phenolic compounds is the wine low
rate, followed by pressure.
Figures 3 and 4 show that the phenolic extraction
yield and the transmembrane lux of phenolic compounds
increase for higher operating pressures and for higher
wine low rates in the membrane contactor. The combined efect of these operational variables allows obtaining transmembrane luxes of phenolic extract ranging from
Table 2. Mobile phase gradient utilized at analytic HPLC procedure.
Time (min)
Volumetriclow (mLmin-1)
A (Acetic acid 1%)
B (Acetonitrile)
0 0.8 90 10
20 0.8 80 20
41 0.8 80 20
45 0.8 50 50
65 0.8 50 50
1H NMR and 13C analysis of extracts
Standarized effects
(%)
Pro
ba
bilit
y
-1.6 -0.6 0.4 1.4 2.4
0.1 1 5 20 50 80 95 99 99.9
0.007 to 0.034 (mol GAE h-1 m-2) and extraction yields
ranging between 8.3 to 14.0 %.
A large body of literature (Ruiz–Rodriguez et al., 2010; Moncada et al., 2013; Choi et al., 2010; Paviani et al., 2008)
shows the efect of the pressure on extraction performance. However, this efect could be less important in our system
because the mass transfer resistance in the feed solution boundary layer (red wine circulating in the lumen side) is
Table 3. Values of signiicant efects on extraction percentage and transmembrane lux obtained under 95 % of conidence with Stat -graphics Centurion XV.
Efects Extraction percentage Transmembrane lux(molGAE h-1 m-2)
Estimated (± 3.0596)
Optimum
level Magnitude
Value (%)
Estimated (± 0.0035518)
Optimum
level Magnitude
Value (mol h-1 m-2)
Temperature (ºC) -0.4053 -0.5 35
13.99
-0.0004220 34.4 34.4
0.034
Pressure(bar) 1.7059 0.7 170 0.0030090 178 178
Red wine low (mLmin-1) 3.4962 1 0.5 0.0242481 0.5 0.5
CO2 SC low (mL min
-1) 3.1773 80 80 0.0055239 75 75
Codified Red Wine Flow Rate
Codified Pressure
E
xt
ra
c
ti
on Y
ie
ld (%)
-1
-0.5
0
0.5
1 -1
-0.5 0
0.5 1
7.3 8.3 9.3 10.3 11.3 12.3 13.3 14.3
Codified Pressure
Codified Red Wine Flow Rate
N
(m
ol
/h m
2)
-1
-0.5
0
0.5
1 -1
-0.5 0
0.5 1 0
0.01 0.02 0.03 0.04 0.05
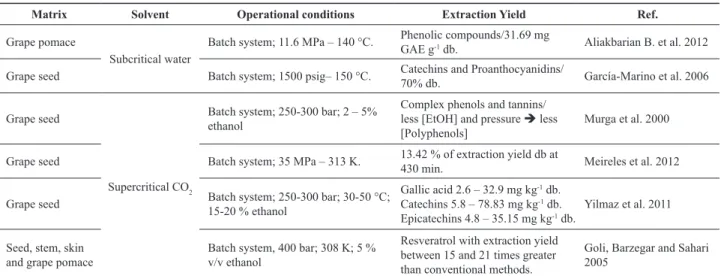
Table 4. Extraction processes of phenolic compounds from grape products and byproducts.
Matrix Solvent Operational conditions Extraction Yield Ref.
Grape pomace
Subcritical water
Batch system; 11.6 MPa – 140 °C. Phenolic compounds/31.69 mg
GAE g-1 db. Aliakbarian B. et al. 2012
Grape seed Batch system; 1500 psig– 150 °C. Catechins and Proanthocyanidins/
70% db. García-Marino et al. 2006
Grape seed
Supercritical CO2
Batch system; 250-300 bar; 2 – 5% ethanol
Complex phenols and tannins/ less [EtOH] and pressure less [Polyphenols]
Murga et al. 2000
Grape seed Batch system; 35 MPa – 313 K. 13.42 % of extraction yield db at
430 min. Meireles et al. 2012
Grape seed Batch system; 250-300 bar; 30-50 °C; 15-20 % ethanol
Gallic acid 2.6 – 32.9 mg kg-1 db.
Catechins 5.8 – 78.83 mg kg-1 db.
Epicatechins 4.8 – 35.15 mg kg-1 db.
Yilmaz et al. 2011
Seed, stem, skin and grape pomace
Batch system, 400 bar; 308 K; 5 % v/v ethanol
Resveratrol with extraction yield between 15 and 21 times greater than conventional methods.
Goli, Barzegar and Sahari 2005
signiicantly higher. The Reynolds number in the lumen side of capillary tubes or hollow ibers is extremely low (Re < 30). Thus, the feed solution low rate represents a more important efect on the extraction performance for
this system.
Table 4 summarizes the main results reported in the literature for extracts obtained from grape pomace, seeds, stem and skin using supercritical carbon dioxide and subcritical water. In these studies, the obtained extracts contain phenolic compounds, which could
show degradation at high temperature or long times of processing. In the membrane extractor system of this study the residence time in the contactor varied between 5 and 32
seconds depending on the wine low rates.
Chafer et al. (2007) report the increase of the solubility of gallic acid in scCO2 when the pressure increases. The
solubility of diferent types of compounds increases with pressure since the density of the supercritical luid
increases (Drake and Smith, 1990). Moreover, the natural presence of ethanol in red wine could improve the
extractability of phenolic compounds in this case. The concentration of ethanol was measured before and after the supercritical extraction assays in the raw wine and
rainate, respectively, observing a decrease from 13.2 ±
0.5 % v/v to 12.6 ± 0.12 % v/v because of this processing.
This slight decrease could involve a modiication in the extractability of diferent types of compounds present in
wine at low concentrations.
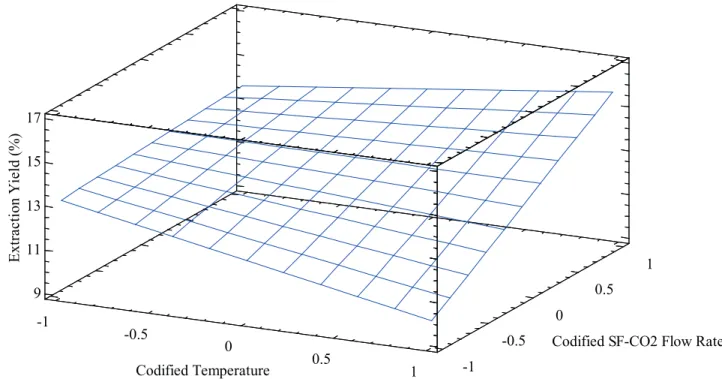
On the other hand, the efect of the temperature on the
extraction performance changes depending on the pressure or scCO2 low rate levels. Temperature can modify the density of pressurized CO2 used as solvent as well as the transport properties through the membrane and boundary layers. This fact could explain the results reported in Figure 5
where the increase of temperature has a negative efect on
the extraction yield at low scCO2 low rates and this efect is reversed at the highest level of scCO2 low rate.
The desirability function was calculated for optimization of the operating variables in the intervals studied in this work (Vera et al., 2014). Thus, the experimental responses
-extraction percentage and transmembrane lux of phenolic
compounds - are maximized in terms of the operating variables as a one objective function. Figure 6 shows the result obtained from this optimization where the optimum desirability value is equal to 0.76 for the lowest and
highest values of temperature and pressure, respectively. Furthermore, the values of the factor levels that allow obtaining the maximum of the desirability function are summarized in Table 5.
Previously, the results reported in Table 3 showed that the highest value of extraction percentage reached
14 % when the wine low rate, CO2 low rate, pressure
and temperature were 0.5 mL min-1, 80 mL min-1 NCPT,
17 MPa and 35 ºC, respectively. The statistical analysis reported in Table 5 and Figure 6 validates this result.
Under the best operating condition tested in this work, 20.6 ± 1.13 mg of dry extract and 86.7 ± 2.1 mg GAE were collected per liter of processed red wine. This condition involves a residence time of wine in the extractor equal to 32 seconds with a consumption of 0.538 kg of CO2, which can be considered low if compared with values reported by studies summarized in Table 4.
On the other hand, the highest transmembrane lux of
total phenolic compounds obtained from a single extraction step was 0.034(mol GAE h-1 m-2) under the optimized
conditions. This behavior is in agreement with the increase
of the Reynolds number (Hof et al., 2014) in the lumen side
Codified SF-CO2 Flow Rate
Codified Temperature
E
xt
ra
c
ti
on Y
ie
ld (%)
-1
-0.5
0
0.5
1 -1
-0.5 0
0.5 1
9 11 13 15 17
Figure 5. Estimate response surface of scCO2 extraction yield from red wine Cabernet Sauvignon. P = 180 bar and Qwine = 0.5 mL min-1.
D
es
ir
ab
ility
in
d
ex
Codified Pressure Codified Temperature
-1
-0.5
0
0.5
1 -1
-0.5
0
0.5
1 0.6
0.7 0.8
Figure 6. Estimated response surface of desirability for scCO2 extraction of compounds from red wine Cabernet Sauvignon. Qwine = 0.5 mL min-1 and Q
CO2 = 70 mL min
Table 5. Values of factor levels to obtain the maximum of the desirability function.
Factor Value Optimum level
Temperature 32 ºC -0.9
Pressure 180 bar 1
Red wine low rate 0.5 mL min-1 1
scCO2 low rate 70 mL min-1 NCPT 0
side of the contactor. It is possible to observe a relatively
signiicant change of the Sherwood number in function of
the Re in both sides of the membrane contactor. Thus, the
efect of the wine and scCO2 low rates on the extraction
percentages can be understood.
Chemical characterization of wine extracts
Figure 8 shows the FTIR spectra, where it is possible to see the C–H stretching vibration for methyl and methylene groups, being the characteristic bands related to the main compounds in the dry extract with at least one aliphatic fragment (Coates, 2000) and potential presence of functional groups like alkanes, aromatics, ether, carboxylic acid, aldehydes or ketones.
Generally, bands of phenolic compounds found in grapes can be observed in the region between 900 and 1680 cm-1.
The bands in the range 1520 – 1600 cm-1 might be attributed
to vibrations of C=C bonds, typical of aromatic systems (Coates, 2000). The C–O bonds show peaks in the range 1060 – 1150 cm-1, indicating the presence in the extract
of an organic acid component (Edelman et al., 2001). The absorption band at 1750 cm-1 is attributable to the stretching
vibration of a C=O group in esteriied carboxyl to methyl
or protonated carboxylic acid O=C–O–H (Manrique and Lajolo, 2002). The presence of absorption bands in the interval 1420 – 1620 cm-1 is attributable to absorbance of
deprotonated COO- groups (Boulet et al., 2007). Peaks in
the region 1407-1618 cm-1 correspond to symmetric and
asymmetric stretching for carboxyl ion (COO-), indicating
the presence of a carboxylic acid, ester or carbonyl group according to the information reported by other studies (Zhang et al., 2010). Thus, the change from carboxylic
acid to salt could be a conirmation of acid structure, and
logically the O–H stretching band disappears.
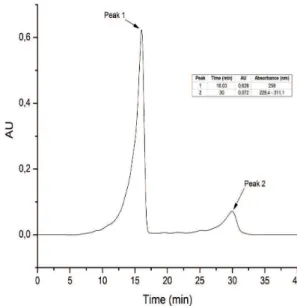
From the gradient HPLC analysis done on dry extract, it is possible to see only two peaks (Figure 9).
Figure 7. Dimensionless Sherwood number as a function of Reynolds number. T = 35 ºC; P = 180 bar. Correlation for shell and lumen sides (Bocquet et al., 2007):
Shshell = 1.25∙[(Deq/L)∙Reshell]0.93· Sc shell
1/3
Visualizing the spectra obtained for the two separated compounds, it is seen that the component with the lowest retention time shows an absorption peak at 259 nm. However, the other compound showed two absorbance peaks at 228.4 and 311.1 nm. These values suggest the phenolic nature of one or both components according to the absorption range obtained (de Villiers et al., 2010).
The results of thermal analysis (DSC) show two endothermic peaks. Both peaks might represent one or two compounds present in the solid extract, showing that it does not represent a second order phase transition. Increasing the
temperature, the irst peak corresponds to the mean melting
point temperature 124.42 ºC and it involves an absolute latent heat of 62.57 J g-1, presenting a base width lower
than the second peak. The width of the peak is associated with the change of size distribution of the structure from crystalline state to a disordered liquid state. The second peak presents a mean temperature of 248.4 ºC, which could denote a thermal resistance of the compound; this resistance might be attributed to the presence of aromatic rings. Masoud et al. (2012) obtained an identical result for gallic acid, which presented two endothermic peaks, at 124.5 ºC and 267.6 ºC in DTA analysis. Furthermore, benzoic acid shows two endothermic peaks, around 122.4 ºC and 250 ºC for melting point and boiling point, respectively, according to calibration standard DSC LGC2606.
The 13C Nuclear Magnetic Resonance (NMR) spectrum
of extract is reported in Figure 10 where it can be seen
chemical shifts of δ = 172.63; 147.47; 140.91; 129.84;
118.23; 18.85 ppm, which could establish the presence of
a carbonyl group with a displacement to lower ield around δ = 172.63 ppm attributable to the presence of carbon in a
O-COCH3 group (Topcu and Ulubelen, 2007).
At higher ield values, the carbon nuclei belong to aliphatic chains. Nevertheless, the peak at δ = 18.85 ppm
could be related to CH2 or CH3 groups. The distribution of those types of carbon in the structure involves the presence of an aromatic ring structure because of the presence of the
other 4 peaks above chemical displacement δ = 110 ppm
and at least 1 type of carbon associated with a CH3 group.
Furthermore, at low ield (δ < 40 ppm) in the level of the
noise, there are peaks that could be associated with linear aliphatic structures of other components extracted from the red wine with supercritical CO2. The compounds would represent a minor fraction of the whole extract.
The 1H NMR spectrum reported in Figure 10 shows
nuclei in aromatic, oleinic and alkyl regions. Moreover, its complexity makes it diicult to identify individual
organic species in the absence of authenticated standard and/or reference NMR spectra. The spectrum obtained from this analysis showsaromatic regions with intensity lower than observed in the aliphatic region, showing
chemical displacement values δ = 7.32 – 7.37 ppm for
a doublet of doublets integrating as 4 hydrogens, which might correspond to an aromatic substituted compound
bonded to an electron withdrawing aliphatic chain. Those peaks appearing at chemical shifts 6.23 ppm as a singlet and 6.21 ppm as a triplet with coupling constant J = 3.1 Hz are associated with hydrogens present in aromatic rings and/or carbons linked to double bonds. Furthermore, peaks around 5.75 – 5.79 ppm allow establishing the coupling
constant J = 15.4 Hz for a doublet with coniguration
trans between neighboring hydrogens or the presence of negative elements in its composition.
Figure 8. FTIR spectrum of the dry extract obtained from red wine Cabernet Sauvignon by means of membrane-based supercritical extraction under the best process conditions.
Figure 9. High performance liquid chromatography for dry solid extract obtained from red wine Cabernet Sauvignon using as mobile phase a solution of acetic acid 1 % in
methanol under isocratic coniguration 1.5 mL min-1 and
Figure 10. NMR spectrum 13C (0 – 180 ppm) and 1H (0 – 8 ppm) of the dry solid extract obtained from red wine Cabernet
Sauvignon by means of membrane-based supercritical extraction under the best condition of extraction at 30 ºC using CDCl3 as deuterated solvent
From the ensemble of these results, the most probable structure of the main molecules that constitutes the dry red wine extract obtained by membrane-based supercritical
luid extraction could be mainly two compounds of a
intermediate polarities and low molecular weight. The principal compound could correspond to an acid with aromatic structure and the presence of methyl and carboxyl functional groups in the structure.
Antioxidant Capacity ORAC
The antioxidant capacity quantiication of the obtained
red wine extract was by means of the ORAC method. The curve of ORAC assay reported in Figure 11 shows two
curves of luorescein decaying at dilution factors 100x and 60x for the solid extract in phosphate bufer, where the lag
time decreased when the sample was diluted. It is possible
to verify a signiicant antioxidant capacity and lag time of
around 2000 seconds.
The antioxidant capacity of red wine extract is shown in Table 6 and equal to 101737 ± 5324 µmol TE per 100
g of lyophilized extract. This value is equivalent to the antioxidant activity of Açai fruit pulp/skin powder (ORAC value of 102700 µmol TE per 100 g) but is lower than
Chemical characterization of the extract described
above involves the identiication of a mixture with at least
two main compounds. These compounds seem to show a synergic antioxidant action. Nevertheless, it is necessary to
emphasize that the ORAC assay is a simpliied technique
that reduces the complex antioxidant mechanism to a reaction between the radicals produced by AAPH and the
analyzed antioxidant. The combined efect of a mixture of antioxidants on diferent paths of the food oxidation
processes efectively acts in a synergistic way, providing extra protection higher than the addition of the efects
of the single antioxidant components (Bentayeb et al.,
2014). However, red wine polyphenols have diferent
physiological properties, which depend on the composition of the extracts (Zoechling et al., 2011). Thus, redox values become only a surrogate parameter and further investigation is necessary for the detailed characterization of the extract composition.
Table 7. Antioxidant capacity of substances and food products evaluated by the ORAC method.
Substance/Food ORAC value Unit Source
Ascorbic Acid 40.4 ± 2.1 µM TE
Zulueta et al. (2009)
Gallic Acid 161 ± 4.8 µM TE
β - carotene 582 ± 30.3 µM TE
Zeaxanthin 1108 ± 5.9 µM TE
BHA (Butylated Hydroxy anisole) 13500 ± 332 µmol TE g-1 Dávalos et al. (2004)
Squalene 304.3 µmol TE g-1 Kraujalis and Venskutonis (2013)
Cinnamon, ground 131420 ± 13867 µmol TE/100g-1
Haytowitz and Bhagwat (2010)
Rosemary, dried 165280 ± 1319 µmol TE/100g-1
Oregano, dried 175295 ± 7683 µmol TE/100g-1
Cloves, ground 290283 ± 3292 µmol TE/100g-1
Red wine Cabernet Sauvignon
Santa Tierra (Chile) 28.064 ± 2.073 µmol TE mL-1
Van Leew et al. (2014) Casillero del Diablo (Chile) 42.669 ± 1,14 µmol TE mL-1
Sunrise (Chile) 25.773 ± 1.493 µmol TE mL-1 Chocolate, Dark
Black & Green´s Organic 118.9 µM TEg-1
Stockham et al. (2011) Lindt, 70 % 171.8 µM TE g-1
Lindt, 90 % 290.0 µM TE g-1 Fruits
Strawberry 154 µmol TEg-1
Yilmaz et al. (2006)
Plum 80 µmol TE g-1
Red Grape 36 µmol TE g-1
Orange 52 µmol TE g-1
Blueberries 63 – 282 µmol TE g-1
Blackberries 8650 ± 200 µM TE
Atala et al. (2009)
Raspberry 2870 ± 700 µM TE
Tomato dry 222.3 ± 285.61 µmol TE g-1 Li et al. (2012)
Table 6. Equivalences for ORAC values of extract obtained from red wine Cabernet Sauvignon by means of membrane-based supercritical extraction.
mmol TE g-1 µM Trolox µmol TE g-1 µmol TE per 100 g
1.017 10878.69 1017.37 101737.07
spices such as cinnamon, rosemary, oregano and cloves among others reported in Table 7, which shows a value range varying from 131420 to 290283 µmol TE per 100 g of sample (USDA, 2010). Thus, the extract obtained from red wine Cabernet Sauvignon by membrane-based supercritical CO2 extraction could be among the 12 food products with higher antioxidant capacities reported in the ORAC database of the USDA (2010). Furthermore, the ORAC value of this extract is around ten times lower than
BHA, which represents a commercial artiicial antioxidant.
CONCLUSIONS
In this work, the membrane-based supercritical luid
extraction process was used to obtain an extract directly from Cabernet Sauvignon wine. During the extraction runs
implemented in a single PTFE iber contactor, a permanent
stability of the extraction system it was observed, as well as reproducible measurements.
The continuous extraction system with supercritical CO2 coupled to a membrane contactor allowed the extraction of organic compounds from red wine Cabernet Sauvignon, as well as evidenced the great mechanical stability presented
by membrane iber.
The process of this extraction gave a maximum dry extract yield of 20.6 mg per L of red wine processed in only one extraction step in steady-state conditions when
the wine low rate, CO2 low rate, pressure and temperature
were 0.5 mL min-1, 80 mL min-1 NCPT, 17 MPa and 35
ºC, respectively. Furthermore, the extraction yield as a function of supercritical CO2 consumption was 40.9 mg per kg of CO2.
From the chemical characterization of the dry extract, the most probable structure of the main molecules extracted
by membrane-based supercritical luid extraction could be
associated with an acid with aromatic structure and the presence of methyl and carboxyl functional groups.
The extract obtained under the best operational condition showed an antioxidant activity equivalent to 101737± 5324 µmol TE per 100 g of lyophilized extract. This value was obtained by the ORAC method and is higher than those obtained for other raw food materials like fruits, chocolate, green tea leaves and red wine Cabernet Sauvignon itself. This ORAC – FL value of extracts allows
positioning among food compounds with a signiicant
antioxidant capacity for its use in food formulations or in mixtures with other compounds with synergic action. Nevertheless, further investigation is required to know the detailed chemical composition of these extracts.
ACKNOWLEDGEMENTS
This study has been developed in the framework of the research projects FONDECYT 1140208 and FONDECYT 1130389, granted by CONICYT Chile, and RC-130006-CILIS granted by Fondo de Innovación para la Competitividad, del Ministerio de Economía, Fomento y Turismo, Chile. The Doctoral Scholarship Program of CONICYT Chile supported Wladimir Silva Vera.
REFERENCES
Aliakbarian B., Casazza A.A., Montoya E.J.O., A. Convert A., Valorization of olive oil solid wastes: Valuable compounds recovery using high pressure –
high temperature. Journal of Biotechnology.150, 332, (2010).
Aliakbarian B., Fathi A., Perego P., Dehghani F., Extraction of antioxidants from winery wastes using subcritical water. Journal of Supercritical Fluids. 65, 18 – 24, (2012).
Atanackovic M., Petrovic A., Jovic S., Gojkovic-Bukarica
L., Bursac M., Cvejic T., Inluence of winemaking
techniques on the resveratrol content, total phenolic content and antioxidant potential of red wines. Food Chemistry. 131, 513 – 518, (2012).
Bentayeb K., Vera P., Rubio C., Nerín C., The additive properties of Oxygen Radical Absorbance Capacity (ORAC) assay: the case of essential oils. Food Chemistry. 148, 204 – 208, (2014).
Bocquet S., Romero J., Sanchez J., Rios G.M., Membrane contactors for the extraction process with subcritical
carbon dioxide or propane: Simulation of the inluence
of operating parameters. Journal of Supercritical Fluids .41, 246 – 256, (2007).
Boulet J.C., Williams P., Doco T., A Fourier transform infrared spectroscopy study of wine polysaccharides. Carbohydrate Polymers. 69, 79 – 85, (2007).
Boussetta N., Vorobiev E., Reess T., de Ferron A., Pecastaing L., Ruscassié R., Lanoisellé J.L., Scale-up of high voltage electrical discharges for polyphenols
extraction from grape pomace: Efect of the dynamic
shock waves. Innovative Food Science and Emerging Technologies. 16, 129 – 136, (2011).
Careri M., Corradini C., Elviri L., Nicoletti I., Zagnoni I., Direct HPLC analysis of quercetin and trans-resveratrol in red wine, grape, and winemaking byproducts. Journal of Agricultural and Food Chemistry.51, 5226-5231, (2003).
Chafer A., Fornari T., Stateva R., Berna A. and García – Reverter J.,Solubility of the natural antioxidant Gallic acid in supercritical CO2 + ethanol as a cosolvent. Journal of Chemical Engineering Data.52, 116 – 121 (2007).
Coates J., Interpretation of infrared spectra, a practical approach. Encyclopedia of Analytical Chemistry. Chichester, England: Meyers, (2000).
Colon M., Nerin C., Role of catechins in the antioxidant
capacity of an active ilm containing green tea, green cofee and grapefruit extracts. Journal of Agriculture
Food Chemistry. 60, 9842 – 9849, (2012).
De Villiers A., Kalili K.M., Malan M., Roodman J.,Improving HPLC separation of polyphenols. LCGC Europe. 23, 466 – 478, (2010).
Drake B.D., Smith Jr R.L., Measurement of static dielectric
Carbon dioxide and argon, carbon dioxide, and methanol at 323 K and pressures to 25 MPa. Journal of Supercritical Fluids.3, 162 – 168, (1990).
Edelmann A., Diewok J., Schuster K.C., Lendl B., Rapid method for the discrimination of red wine cultivars based onmid-infrared spectroscopy of phenolic wine extracts. Journal of Agricultural Food Chemistry. 49, 1139 – 1145, (2001).
EFSA Panel on Food Additives and Nutrient Sources added to Food. EFSA Journal. 49, (2011).
Estay H., Bocquet S., Romero J., Sánchez J., Ríos G.M., Valenzuela F., Modeling and simulation of mass
transfer in near – critical extraction using a hollow iber
membrane contactor. 62, 5794 – 5808, (2007)
Fragoso S., Aceña L., Guasch J., Busto O., Mestres M., Application of FT-MIR spectroscopy for fast control of red grape phenolic ripening. Journal of Agricultural Food Chemistry. 59, 2175 – 2183, (2011).
García – Abarrio S.M., Marqués J.L., Scognamiglio M., Della Porta G., Reverchon E., Mainar A.M., Urieta J.S., Supercritical extraction and separation of antioxidants from residues of the wine industry. Procedia Engineering. 42, 1762 – 1766, (2012).
García-Marino M., Rivas-Gonzalo J.C., Ibáñez E., García-Moreno C., Recovery of catechins and proanthocyanidins from winery by-products using subcritical wáter extraction. Analytica Chimica Acta. 563, 44 – 50, (2006).
Ghafor K., Park J., Choi Y.H., Optimization of supercritical luid extraction of bioactive compounds from grape
(Vitislabrusca B.) peel by using response surface methodology. Innovative Food Science and Emerging Technologies. 11, 485 – 490, (2010).
Granato D., Katayama F.C.U., de Castro I.A., Phenolic
composition of South American red wines classiied
according to their antioxidant activity, retail price and sensory quality. Food Chemistry. 129,366 – 373, (2011).
Haytowitz D.B, Bhagwat S., USDA database for the oxygen radical absorbance capacity ORAC of selected food, Release 2, U.S. Department of Agriculture, Agricultural Research Service. 12 – 41 (2010).
Hof K.A., Svendsen H.F., Membrane contactors for CO2
absorption – Application, modeling and mass transfer
efects. Chemical Engineering Science. 116, 331 – 341,
(2014).
Kolouchová-Hanzlíková I., Melzoch K., Filip V., Smidrkal J., Rapid method for resveratrol determination by HPLC with electrochemical and UV detections in wines. Food Chemistry. 87, 151–158, (2004).
Li J., Chase H.A., Applications of membrane techniques
for puriication of natural products. Biotechnology
Letters. 32, 601 – 608, (2010).
Manrique G.D., Lajolo F.M., FT-IR spectroscopy as a
tool for measuring degree of methyl esteriication in
pectins isolated from ripening papaya fruit. Postharvest Biology and Technology. 25, 99 – 107, (2002).
Masoud M.S., Hagagg S.S., Ali A.E., Nasr N.M., Synthesis and spectroscopic characterization of Gallic acid and some of its azo complexes. Journal of Molecular Structure. 1014, 17 – 25, (2012).
Mathkar S., Kumar S., Bystol A., Olawoore K., Min D.,
Markovich R., Rustum A., The use of diferential scanning calorimetry for the purity veriication
of pharmaceutical reference standards. Journal of Pharmaceutical and Biochemical Analysis. 627 – 631, (2009).
Meireles M.A., Prado J.M., Dalmolin I., Carareto N., Basso R., Meirelles A., Oliveira J.V., Batista E., Supercritical
luid extraction of grape seed: Process scale-up, extract
chemical composition and economic evaluation. Journal of Food Engineering. 109, 249 – 257, (2012). Mendoza L., Matsuhiro B., Aguirre M.J., Isaacs M.,
Sotés G., Cotoras M., Melo R., Characterization of
phenolic acids proile from Chilean red wines by high –
performance liquid chromatography. Journal Chemical Soc. 56, 688 – 691, (2011).
Moncada J., Cardona C.A., Pisarenko Y.A., Solubility of some phenolic acids contained in citrus seeds in supercritical carbon dioxide: comparison of mixing
rules, inluence of multicomponent mixture and model
validation. Theoretical Foundations of Chemical Engineering. 47, 381 – 387, (2013).
Murga R.R., Beltran R., Cabezas J.L., Extraction of natural complex phenols and tannins from grape sedes by using supercritical mixtures of carbon dioxide and alcohol. Journal of Agricultural and Food Chemistry. 48, 3408 – 3412, (2000).
Oliveira D.A., Salvador A.A., Smânia J.A., Smânia E.F.A., Maraschin M., Ferreira S.R.S., Antimicrobial activity
and composition proile of grape (Vitisvinífera) pomace extracts obtained by supercritical luids. Journal of
Biotechnology. 164, 423 – 432, (2013).
Paviani L.C., Dariva C., Marcucci M.C., Cabral F.A., Supercritical carbon dioxide selectivity to fractionate phenolic compounds from the dry ethanolic extract of propolis. Journal of Food Process Engineering. 33, 15 – 27, (2008).
Porgali E., Büyüktuncel E., Determination of Phenolic Composition and Antioxidant Capacity of Native Red Wines by High Performance Liquid Chromatography and Spectrophotometric Methods.Food Research International. 45, 145 – 154, (2012).
mammalian myocardial and coronary performance and protects the heart against ischemia/reperfusion injury. Journal of Nutritional Biochemistry, 24(7), 1221 – 1231, (2013).
Ruiz–Rodriguez A., Fornari T., Hernández E., Señorans F., Reglero G., Thermodynamic modeling of dealcoholization of beverages using supercritical CO2: Application to wine samples. Journal of Supercritical Fluids. 52, 183 – 188, (2010).
Sánchez A., Martinez – Fernández M., Chicharro M., The role of electroanalytical techniques in analysis of polyphenols in wine. Trends in Analytical Chemistry. 34, 78 – 94, (2012).
Santos S.A.O., Villaverde J.J., Silva C.M., Neto C.P.,
Silvestre A.J.D, Supercritical luid extraction of
phenolic compounds from Eucalyptus globulusLabill bark. Journal of Supercritical Fluids. 71, 71 – 79, (2012).
Sarmento L.A., Machado R.A., Petrus J.C., Tamanini T.R., Bolzan A., Extraction of polyphenols from cocoa seeds and concentration through polymeric membranes. Journal of Supercritical Fluids. 45, 64 – 69, (2008). Satyajit D.S., Lutfun N. Natural Products isolation,
Methods in Molecular Biology, vol. 864, DOI
10.1007/978-1-61779-624-1_3, © Springer Science +
Business Media, LLC 2012.
Topcu G., Ulubelen A., Structure elucidation of organic compounds from natural sources using 1D and 2D NMR techniques. Journal of Molecular Structure. 834, 57 – 73, (2007)
Vera Candioti L., de Zan M.M., Cámara M.S., Goicoechea H.C., Experimental design and multiple response optimization. Using the desirability function in analytical methods development. Talanta. 124, 123 – 138, (2014).
Yilmaz EE, Özvural EB, Vural H, Extraction and
identiication of proanthocyanidins from grape seed
(VitisVinifera) using supercritical carbon dioxide. Journal of Supercritical Fluids. 55, 924 – 928, (2011). Zhang L., Li J., Hogan S., Chung H., Welbaum G.E., Zhou
K., Inhibitory efect of raspberries on starch digestive
enzyme and their antioxidant properties and phenolic composition. Food Chemistry. 119, 592 – 599, (2010). Zhang Y., Chen J., Lei Y., Zhou Q., Sun S., Evaluation of
diferent grades of ginseng using Fourier-transform
infrared and two-dimensional infrared correlation spectroscopy Journal of Molecular Structure. 974, 144 – 150, (2010).
Zoechling A., Liebner F, Jungbauer A., Red wine: a source of potent ligands for peroxisome proliferator-activated