Maximal Workload Prediction Models in the Clinical
Cardio-pulmonary Effort Test
Fernando dos Santos Nogueira e Fernando Augusto Monteiro Sabóia Pompeu Universidade Federal do Rio de Janeiro - UFRJ - Rio de Janeiro, RJ - Brazil
Mailing Address: Fernando A. M. S. Pompeu • Av. Brigadeiro Trompowisky, 212 s/nº - Cidade Universitária – 29141-590 – Rio de Janeiro, RJ - Brazil
E-mail: [email protected] Received on 10/09/05 Accepted on 03/30/06
O
BJECTIVEThis study sought to derive generalized equations for predicting maximal workload for young men and women.
M
ETHODSDirect ergospirometry (Aerosport TEEM 100, USA)
was used to determine VO2máx and the maximal work load (Wmax) on the cycle ergometer test (Monark
, Brazil) of
thirty men (25 ± 5 years, 75.0 ± 10.7 kg; 48.4 ± 8.8 mL . kg -1 . min -1 and 243 ± 51 Watts) and thirty women
(26 ± 5 years, 56.7 ± 5.9 kg, 39.8 ± 7.6 mL . kg -1 .
min -1 and 172 ± 37 Watts). Age and body mass were
used as independent variables. For all statistic tests, a p
≤ 0.05 signifi cance level was adopted.
R
ESULTSIn the multiple linear adjustment, the maximal workload was explained by age and body mass as 54% (r = 0.73) for men, and as 76% (r = 0.87) for women, with standard errors of 0.66 W . kg -1 and 25 Watts. The
proposed equations were cross-validated using another sample with similar age and VO2máx characteristics comprised of fifteen men and fifteen women. The intraclass correlation between the predicted Wmax values
and those measures by ergospirometry were 0.70 and 0.69, with standard errors of 28.4 and 15.8 Watts, respectively, for men and women.
C
ONCLUSIONSThis study exhibits valid generalized equations for determining the maximal cycle ergonometer workload for men and women.
K
EY WORDSThe term ergospirometry or spiroergometry was coined in 1929, suggested by Knipping & Brauer (see the comprehensive review by Hollmann & Prinz1). The
primary metabolic measurement in this test is the aerobic capacity (VO2max). Maximal aerobic capacity (VO2max) is the highest oxygen capture that an individual can attain during physical work when breathing air at sea level2. This variable, according to the Fick principle,
is determined by the cardiac output and the mixed arteriovenous difference of oxygen. The ergospirometric test, therefore, allows a valuable study of the integration between pulmonary, cardiovascular, and musculoskeletal systems2,3, and in some cases is the only way to
comprehend physiopathological mechanisms, such as in severe pulmonary vascular disease without direct hypertension, in the patent foramen ovale with left-right shunt development during exercise, in exertional dyspnea, and in exertional hypoxemia, among others4.
Its application before invasive or high-cost procedures in large groups of patients with heart disease and lung disease has many advantages 3,4.
The maximal effort cycle ergometric protocol with 1-min load increments was fi rst proposed by Wasserman et al5, and later perfected by Buchfuhrer et al6. This
protocol consists of continuous load increments added each minute in order to attain the maximal workload (Wmax), characterized by objective criteria7 as 10 ± 2 min.
Therefore, prediction of Wmax from variables available before the beginning of the study for 10% increments Wmax per minute is necessary. The equations normally used8-12 are not very accurate, since they come from
populations with anthropometric, cardiopulmonary, and biomechanical characteristics different from those of Brazilians. Valuable experimental assays and normative reviews published by groups of Brazilian researchers, however, have failed to present an alternative to these equations13-16. Because of this diffi culty, this study aims to
a) develop mathematical equations for predicting Wmax in
a continuous and escalating cycloergometer test with 10
± 2 min duration, and b) test the external validity of the equations developed herein, confronting them with the validity of those derived for a foreign population.
M
ETHODSThe subjects of this study were 90 apparently healthy, non-smoking and non-athletic adult volunteers, 45 men and 45 women, women (Table 1). Subjects were randomly divided into two groups similar in age and body mass; the number of subjects was established according to Hopkins17. Thirty men and thirty women were randomly
selected for the internal validity group (IV), and fi fteen men and fi fteen women for the external validity group (EV). Subjects were advised to abstain from extenuating physical activities and to maintain a mixed diet on the day prior to the test (> 5 METs). It was also recommended that they avoid ingestion of food and caffeine for three hours before the exercise. Prior to the test, the subjects fi lled out an informed consent form. The procedures adopted were approved by the local Ethics Committee for studies with human subjects.
Test protocol -A continuous and maximal escalating
protocol was used5, comprised of an initial resting period
for six minutes with the patient sitting on the cycle ergometer (Monark®, Brazil), followed by a four-minute
warm-up of pedaling without any workload, and later, by the escalating phase with a maximum duration between eight and twelve minutes6. Any test not interrupted
because of fatigue during this period of time was excluded. Overload increments were determined for a constant pace in an empirical and individualized manner. These increments were maintained throughout the test (approx. 25 W . min-1). The pace was controled by means of an
audiovisual metronome (approx. 74 rev . min-1).
Gas exchange and ventilatory variables were measured by a metabolic analyzer (Aerosport® TEEM 100, USA) in
an open circuit and by a medium fl ow pneumotachometer (Hans Rudolph®, USA). These data were recorded every
Table 1 – Anthropometric characteristics and ergometric variables obtained in the maximal cycle ergometer test (mean ± SD)
Men Women
Variables IV
(n = 30)
EV
(n = 15) p
IV (n = 30)
EV
(n = 15) p
Age (years) 25 ± 5 28 ± 7 0.12 26 ± 5 24 ± 5 0.35
Mass (kg) 75.0 ± 10.7 81.3 ± 10.0 0.06 56.7 ± 5.9 56.6 ± 6.8 0.92
Stature (cm) 176.9 ± 6.6 180.0 ± 8.3 0.19 161.7 ± 8.1 161.3 ± 8.1 0.89
VO2max (L . min-1) 3.61 ± 0.71 4.03 ± 0.70 0.07 2.26 ± 0.71 2.03 ± 0.45 0.14
VO2max (mL . kg-1. min-1) 48.36 ± 8.80 50.07 ± 10.15 0.56 39.81 ± 7.64 35.91 ± 6.68 0.10
Wmax 243 ± 51 289 ± 59 0.01 172 ± 37 163 ± 26 0.39
W . kg-1
max 3.29 ± 076 3.62 ± 0.97 0.21 3.02 ± 0.50 2.88 ± 0.32 0.33
twenty seconds. Heart rate was monitored throughout the test by a cardiotachometer (Polar® Vantage NV, Finland).
Before each test, equipment was calibrated. The ergospirometer was calibrated in a closed circuit (AGA®,
Brazil), furnishing a gas mixture containing 17.01% oxygen, 5.00% carbon dioxide, and balanced with nitrogen. Gas fl ow was calibrated using a three-liter syringe (Hans Rudolph®, USA) and the cycle ergometer
by means of a 3 kg ballast.
Tests were considered maximal when at least three of the following criteria were observed7: plateau in VO
2
(increase ≤ 150 mL . min-1 or 2 mL . kg-1 . min-1), HR max ≥ 90% of predicted value for age (220 - age), Concept
of Perceived Effort ≥ 18, RER (respiratory exchange rate)
≥ 1.15, and maximal voluntary fatigue with inability to maintain the preestablished rhythm. VO2max was determined as the highest value found at the end of the test. In this study, the maximal workload was defi ned as that observed in VO2max.
Statistical analysis - Statistical processing was done by
means of the Statistical Package for the Social Sciences®
package (SPSS, USA) version 13.0 and Microsoft Excel®
for Windows XP® (USA). Descriptive statistics were used
with means ± standard deviations (SD). For Group IV, stepwise multiple regression analysis was used to deduce mathematical models for prediction of maximal workload expressed in Watts (W). Eight equations8-12 (Chart 1 and
2) for the same purpose (male and female genders) were analyzed by cross-validation with the subjects from Group IV. Values predicted for Group IV by means of foreign equations, and the values measured were confronted by analysis of variance with one factor and a post-hoc
Tukey-HSDtest. External validity of the equations derived
in this investigation were tested by applying them to the EV group. Bland-Altman19 and modifi ed Bland-Altman20
limits of agreement plots were used with the results measured and calculated by the predictive formulas. The degree of association between the values measured and those predicted was determined by the intraclass correlation coeffi cient (ICC)21. The error of prediction
was also noted by means of the technical error of the measurement (s=S.D.dif÷ √2) and the coeffi cient of
variation (CV %). All statistical tests were performed at the ≤ 0.05 signifi cance level.
R
ESULTSCharacteristics of VO2max and Wmax of the volunteers are displayed on Table 1. The equation for prediction of maximal workload derived for the male group was:
Equation 1
W . kg-1=6.413–(0.0531.age)–(0.0242.weight) R2 = 0.54 and SEE = 0.66 W . kg-1
For the female group:
Equation 2
Wmáx=-115.756+(2.271 . age)+(4.043 .weight) R2= 0.76 and SEE = 25.03 W
Where: R2 = coeffi cient of determination and SEE =
Standard Error of the Estimate
The prediction results using equations 1 and 2 derived in this study did not signifi cantly differ from the results measured for the EV group (Fig. 1). A signifi cant difference was detected for foreign equations between the values measured and those predicted, for both male and female groups (Fig. 1 and Chart 2).
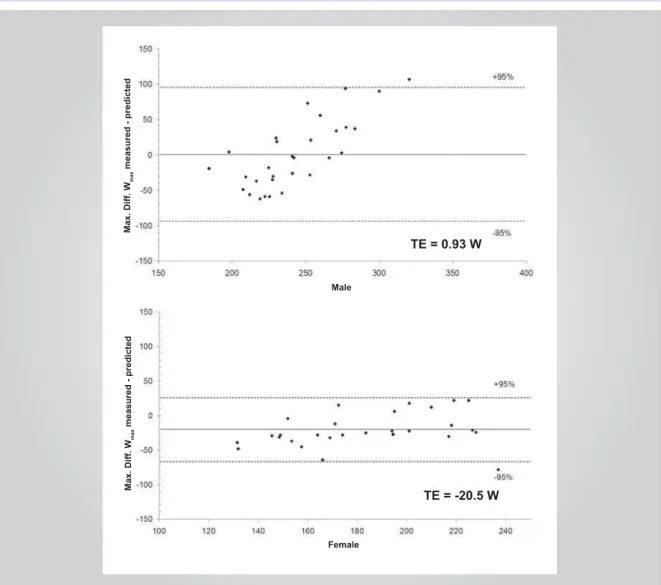
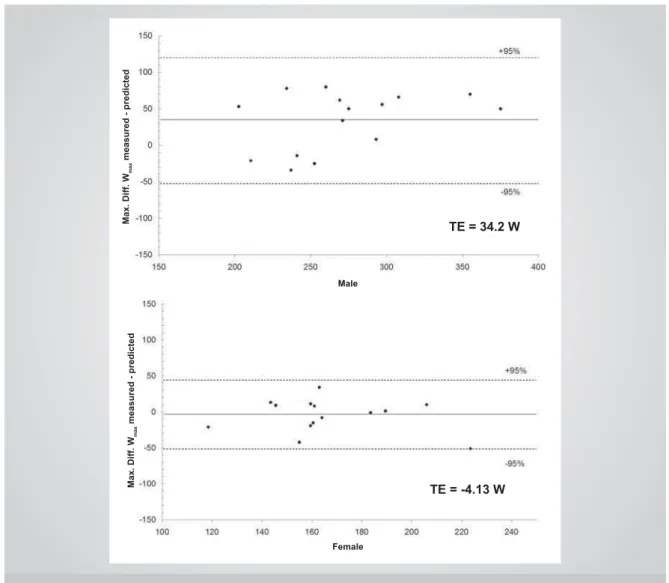
Table 2 displays the results of the analysis performed with the foreign equations. Group IV had limits of agreement of 0.93 ± 95.0 W for the male group, and -20.5 ± 47.6 W for the female group (Fig. 2). These indexes for the EV group were 34.2 ± 86.0 W for the male group, and -4.14 ± 47.87 W for the female group (Fig. 3). There was a moderate association between the values measured and those predicted (ICC = 0.70 and 0.69), respectively, for men and women. The SEE for the male group was 28.42 W (CV = 10.45%), and for the female group, 15.78 W (CV = 9.55%).
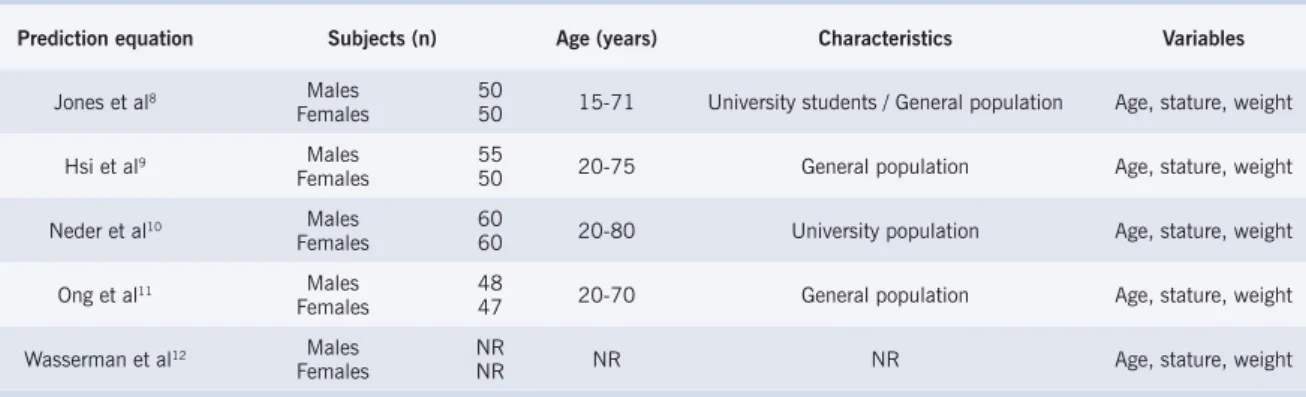
Chart 1 – Characteristics of maximal workload prediction equations for incremental progressive cycle ergometer tests
Prediction equation Subjects (n) Age (years) Characteristics Variables
Jones et al8 Males
Females 5050 15-71 University students / General population Age, stature, weight
Hsi et al9 Males
Females 5550 20-75 General population Age, stature, weight
Neder et al10 Males
Females 6060 20-80 University population Age, stature, weight
Ong et al11 Males
Females 4847 20-70 General population Age, stature, weight
Wasserman et al12 Males
Females NRNR NR NR Age, stature, weight
D
ISCUSSIONWe recommend a 10% progression of the maximal workload per minute in the escalating, continuous and maximal protocol on the cycle ergometer for the detection of the anaerobic threshold and VO2max. The
test should be fi nalized by maximal effort criteria6 after
eight to twelve minutes6. Based on these requirements,
different equations were presented for determining the Wmax, normally using the anthropometric variables obtained at rest such as gender, age, weight, and stature. Despite the large number of prediction equations found in literature, none has proved to be well suited to the Brazilian population. It seems wise to expect a reasonable prediction capacity when the equation is applied to the
population from which it was derived. The results of this study suggest a good external validity for the equations proposed herein when compared to equations coming from alien populations.
In rapid tests (< eight minutes), Buchfuhrer et al.,6
observed a low VO2max value. This was possibly due to
limitations of muscular force. However, a reduction of VO2maxin longer (> sixteen minutes) tests would also be
expected because of an increase in core temperature, dehydration, discomfort, or fatigue of ventilatory muscles6. Since longer tests require more time, do
not furnish additional information, and do not produce maximal values, protocols with 10 ± 2 minutes duration are recommended.
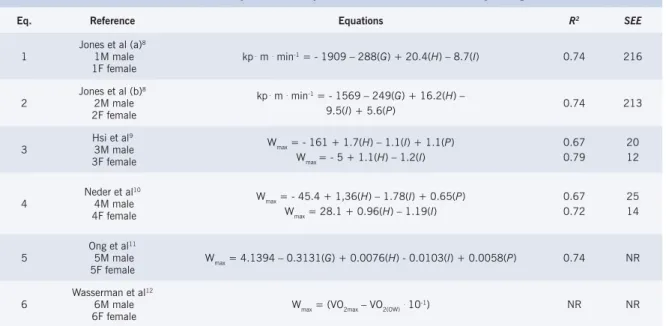
Chart 2 – Maximal workload prediction equations for the incremental cycloergometer test
Eq. Reference Equations R2 SEE
1 Jones et al (a)
8
1M male
1F female kp
. m . min-1 = - 1909 – 288(G) + 20.4(H) – 8.7(I) 0.74 216
2 Jones et al (b)
8
2M male 2F female
kp . m . min-1 = - 1569 – 249(G) + 16.2(H) –
9.5(I) + 5.6(P) 0.74 213
3 Hsi et al
9
3M male 3F female
Wmax = - 161 + 1.7(H) – 1.1(I) + 1.1(P) Wmax = - 5 + 1.1(H) – 1.2(I)
0.67 0.79
20 12
4 Neder et al
10
4M male 4F female
Wmax = - 45.4 + 1,36(H) – 1.78(I) + 0.65(P) Wmax = 28.1 + 0.96(H) – 1.19(I)
0.67 0.72
25 14
5 Ong et al
11
5M male
5F female Wmax = 4.1394 – 0.3131(G) + 0.0076(H) - 0.0103(I) + 0.0058(P) 0.74 NR
6 Wasserman et al
12
6M male
6F female Wmax = (VO2max – VO2(OW)
. 10-1) NR NR
Equations 1 and 2 used the gender as a predictor (0 for males and 1 for females); equation 5 used the gender as a predictor (1 for males and 2 for females) and uses logarithmic transformation; for equation 6, VO2max is predicted as mL . min-1 = (H – I) . 20 for sedentary men and 14 for sedentary
women, and VO2max(ow) is mL . min-1 = 150 + 6(P); G, gender; H, stature (cm); I, age (years); P, weight (kg); NR, not reported.
Fig. 1 – Maximal capacity (W
max) measured and predicted by the current equation and by foreign equations, where (a) male group and (b) female group;
* p ≤ 0.05 between Wmax measured (Table 1) and predicted (Table 2).
W
max
Current
Male
W
max
Table 2 – Cross-validation for Wmax on the cycle ergometer
Eq. Reference Wmaxpredicted
(Mean ± SD) Limits of Agreement ICC s CV %
1
Jones et al(a)8
1M male 1F female
242 ± 24 143 ± 29
1.0 ± 104.0 29.2 ± 72.4
0.13 0.37
37.69 26.14
15.52 16.56
2
Jones et al(b)8
2M male 2F female
242 ± 25 143 ± 27
1.0 ± 102.0 29.6 ± 70.6
0.18 0.38
36.81 25.46
15.18 16.16
3
Hsi et al9
3M male 3F female
195 ± 20 142 ± 11
48.4 ± 99.5 30.6 ± 71.6
0.17 0.10
35.91 25.82
16.40 16.43
4
Neder et al10
4M male 4F female
200 ± 16 153 ± 10
43.6 ± 97.2 19.8 ± 72.1
0.17 0.07
35.07 26.01
15.84 16.01
5
Ong et al11
5M male 5F female
212 ± 22 123 ± 13
31.6 ± 98.0 49.6 ± 68.5
0.23 0.19
35.29 24.73
15.52 16.75
6
Wasserman et al12
6M male 6F female
244 ± 16 141 ± 12
-0.8 ± 101.1 31.4 ± 61.5
0.09 0.01
36.79 27.27
15.10 17.40
Wmax predicted = maximal workload predicted. ICC = interclass correlation coeffi cient. s = technical error of the measurement; and CV = coeffi cient of variation.
Fig. 2 – Limits of agreement between values measured and predicted for maximal workload estimate in Group IV. Solid line is the total error (TE) from zero, with ± 95% (intermitent lines). Figure 3 follows the same format.
Female Male
TE = -20.5 W TE = 0.93 W
Max. Diff. W
max
measured - predicted
Max. Diff. W
max
Fig. 3 – Limits of agreement between values measured and predicted for maximal workload estimate in EV group.
The precision of gas exchange and ventilatory measurements is essential for data to be reproduced, and quality control needs to be made by means of calibration, operation, and analysis performed by experienced technicians15. Tests in which these precautions are taken
show a low variation in repeat measurements at the nearest timepoints15,22-25. Daily intrasubject variation,
due to error and physiological fl uctuations of oxygen consumption, minute ventilation, and heart rate, are25
3.8%, 8.0%, and 3.0%, respectively. Granja Filho et al22,observed a 5.5% intrasubject variation for VO
2max
in a study carried out recently. We conclude that this result is a fruit of our equipment for clinical use. Even with this greater inaccuracy, the ergospirometer adopted here was validated by another group23 and is amply used
in Brazilian laboratories because of its low cost. This difference in accuracy between measurements obtained with more sofi sticated equipement and ours (3.8% versus 5.5%) may lead to a small error in the application of our formulas, which could not yet be determined.
Coefficients of determination for the prediction equations of this study were moderate for the male
group (R2 = 0.54) and high for the female group (R2=
0.76). We chose to express the maximal workload as Wmax and W . kg-1, respectively, for women and men. This
adjustment in the dependent variable was necessary in order to obtain a greater predictive power in the second case. This is probably due to the lower body adiposity in the male group26,27; therefore, a greater weight variation
would imply a greater heterogeneity of lean body mass, and consequently, of muscular strength. These indexes are close to those of other studies9-11. Ong et al11,sought
to improve the predictive model of Wmax using logarithmic transformation. The use of a nonlinear model was proposed in order to correct the infl uence of age in the decline of physical conditioning. The research performed by Ong et al11, however, did not obtain more precise
results than other studies8-10.
The SEE indexes for the equations in this study were
similar to those of other equations8-10. As a comparison,
because of the difference in units recorded (W . kg-1 ,W ,
kg . m . min-1), the SEE was divided by the average of the
group studied in order to express the SEE in a porcentage of the mean (SEE %). Jones et al,8 found 15% indexes for
Female
TE = 34.2 W
Max. Diff. W
max
measured - predicted
Max. Diff. W
max
measured - predicted
TE = -4.13 W
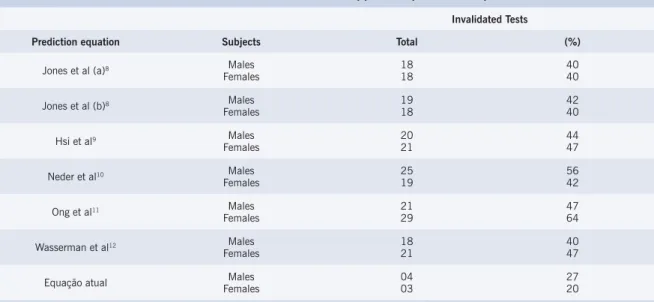
Table 3 – Stress tests invalidated* when applied to predictive equations.
Invalidated Tests
Prediction equation Subjects Total (%)
Jones et al (a)8 Males
Females 1818 4040
Jones et al (b)8 Males
Females 1918 4240
Hsi et al9 Males
Females 2021 4447
Neder et al10 Males
Females 2519 5642
Ong et al11 Males
Females 2129 4764
Wasserman et al12 Males
Females 1821 4047
Equação atual FemalesMales 0403 2720
*Tests invalidated when interruption occurred out of the 10 ± 2 minute range for n = 45 men and 45 women. For the current equation, the EV group was used (n = 15 men and n = 15 women).
the male group and 26% indexes for the female group. On the other hand, Hsi et al,9 and Neder et al,10 found
14% and 17% values for the male group, and 12% and 13% values for the female group, respectively. In this study, these indices were 20% for the male group, and 14% for the female group. The indexes of SEE%for an
indirect estimate of VO2max in several fi eld methods, such as the step test, submaximal cycle ergometer test, or walking/running on track test, represent 10% to 20% of the VO2max measured28.
No other author, among all those researched, performed a cross-validation study of his Wmax prediction
equations. We see on Table 2 that the intraclass correlation coeffi cients for external validity of the main equations analyzed in literature varied from ICC = 0.01 (6F) to ICC = 0.38 (2F). These indexes, as was expected, were lower than those found in the original assays and in the present study. Analyzing the proportion of possibly invalidated tests when these equations are used8-12, there
is a 40% to 64% loss of tests (Table 3). The equations we propose show 27% and 20% indexes for the male and female groups, respectively (Table 3).
Figures 4 and 5 present dispersion diagrams of the predicted values and the measured values for the equations with the lowest indexes of invalidated tests (1M and 1F). One can see that the inclination of the tendency line is near zero, suggesting an absence of covariance. Distortions such as these are common when the population validity of predictive models is considered9,11.
Analysis of the limits of agreement reveals that there is a great variation between the equations. The total error (TE - the measured value minus the predicted value) varied considerably between the predictive models. A
tendency to underestimate Wmax when using the foreign models was noted. The present study, however, presented acceptable limits of agreement (Fig. 2). Some points showed considerable distancing as to the error in the male group. Nevertheless, for this analysis, one should consider the ± 2 min range previously recommended6
and the index of invalidated tests shown on Table 3. For the female group, a small overestimation of the measured value was noted.
The predictive technique error suggested is close to the variation range recommended by Buchfuhrer et al6.
We conclude, therefore, that the inference equations of Wmax derived in this study for the escalating and
continuous cycle ergometer protocols, with eight to twelve minutes duration, can be used with satisfactory external validity. We also conclude that the equations derived for alien populations that we studied did not show fully satisfactory results for the local population. For the future, a repetition of this assay for other age brackets and for the diverse patient groups that could not be included here is recommended.
Acknowledgements
Fig. 4 – Dispersion diagram between values measured and predicted by the proposed equation (a) and predicted by equation 1M(b) for the male group (n = 45, regression [____], identity line [...]).
Fig. 5 – Dispersion diagram between values measured and predicted by the proposed equation (a) and predicted by equation 1F(b) for the female group (n = 45, regression [____], identity line [...]).
R
EFERENCES1. Hollmann W, Prinz JP. Ergospirometry and its history. Sports Méd. 1997; 23: 93-105.
2. Åstrand PO, Rodahl K, Dahl HA, Strømme SB. Evaluation of physical performance on the basis of tests. In: Textbook of Work Physiology. 4th
ed. Champaign: Human Kinetics; 2003: 273-97.
3. Jones NL. Clinical exercise testing.4th ed. Philadelphia: W.B.
Saunders; 1997.
4. Wasserman K, Hansen JE, Sue DY, Whipp BJ, Casauri R. Principles of exercise testing and interpretation. 2th ed. Philadelphia: Lea & Febiger;
1994: 2-8.
5. Wasserman K, Whipp BJ, Koyal SN, Beaver WL. Anaerobic threshold and respiratory gas exchange during exercise. J Appl Physiol. 1973; 35: 236-43.
6. Buchfuhrer MJ, Hansen JE, Robinson DY, Sue DY, Wasserman K, Whipp BJ. Optimizing the exercise protocol for cardiopulmonary
assessment. J Appl Physiol. 1983; 55: 1558-64.
7. Howley ET, Basset Jr. DR, Welch HG. Criteria for maximal oxygen uptake: review and commentary. Med Sci Sports Exerc. 1995; 27: 1292-301.
8. Jones NL, Makrides L, Hitchcock C, Chypchar T, Mccartney N. Normal standards for an incremental progressive cycle ergometer test. Am Rev Respir Dis. 1985; 131: 700-8.
9. Hsi WL, Lan C, Lai JS. Normal standards for cardiopulmonary responses to exercise using a cycle ergometer test. J Formos Med Assoc. 1998; 97: 315-22.
10. Neder JA, Nery LE, Castelo A, Andreoni S, Lerario MC, Sachs A, et al. Prediction of metabolic and cardiopulmonary responses to maximum cycle ergometry: a randomized study. Eur Respir J. 1999; 14: 1304-13.
11. Ong KC, Loo CM, Ong YY, Chan SP, Earnest A, Saw SM. Predictive values for cardiopulmonary exercise testing in sedentary chinese
Wmax measured
W
max
Predicted (Current Eq.)
Wmax measured
W
max
Predicted (1M)
Wmax measured
W
max
Predicted (Current Eq.)
Wmax measured
W
max
Predicted (1M)
Potencial Confl ict of Interest
adults. Respirology. 2002; 7: 225-31.
12. Wasserman K, Hansen JE, Sue DY, Whipp BJ. Protocols for exercise testing. In: Principles of exercise testing and interpretation. Philadelphia: Lea & Febiger; 1987: 58-71.
13. Guimarães GV, Bellotti G, Wajngarten M, et al. Exercício e insufi ciência cardíaca. Estudo da relação da gravidade da doença com o limiar anaeróbio e o ponto de compensação respiratório. Arq Bras Cardiol. 1999; 73: 339-43.
14. Ribeiro JP. Limiares metabólicos e ventilatórios durante o exercício. Aspectos fi siológicos e metodológicos. Arq Bras Cardiol. 1995; 64: 171-81.
15. Guimarães JI, Stein R, Vilas-Boas F, et al. Normatização de técnicas e equipamentos para realização de exames em ergometria e ergoespirometria. Arq Bras Cardiol. 2003; 80: 458-64.
16. Yazbek Jr P, Carvalho RT, Sabag LMS. Batistella LR. Ergoespirometria: Teste de esforço cardiopulmonar, metodologia e interpretação. Arq Bras Cardiol. 1998; 71: 719-24.
17. Hopkins WG. A new view of statistics. Sportscience [online]. Available from: URL: http://sportsci.org/resourse/stats [Accessed 2005 Jan 5].
18. Malek MH, Berger DE, Housh TJ, Coburn JW, Beck TW. Validity of VO2máx equations for aerobically trained males and females. Med Sci
Sports Exerc. 2004; 36: 1427-32.
19. Bland JM, Altman DG. Statistical methods for assessing agreement
between two methods of clinical measurement. Lancet. 1986; 2:
307-10.
20. Hall C, Figueroa A, Fernhall B, Kanaley JA. Energy expenditure of walking and running: comparison with prediction equations. Med Sci Sports Exerc. 2004; 36: 2128-34.
21. Bartko JJ. The intraclass correlation coefficient as a measure of reliability. Psych Reports. 1966; 19: 3-11.
22. Granja Filho PCN, Pompeu FAMS, Ribeiro AP. A acurácia da determinação do VO2máx e do limiar anaeróbio. Rev Bras Med Esporte. 2005; 11: 167-71.
23. Novitsky S, Degal KR, Chatr-Aryamontri B, Gubakov D, Katch VL. Validity of a new portable indirect calorimeter: the Aerosport TEEM 100. Eur J Appl Physiol. 1995, 70: 104/1-104/6.
24. Davies CTM, Tuxworth W, Young IM. Physiological effects of repeated exercise. Clin Sci. 1970; 39: 247-58.
25. Jones NL, Kane JW. Quality control of exercise test measurements. Med Sci Sports. 1979; 11: 368-72.
26. Pollock ML, Laughridge E, Coleman B, Linnerud AC, Jackson A. Prediction of body density in young and middle-aged women. J Appl Physiol. 1975; 38: 745-9.
27. Pollock ML, Hickman T, Kendrick Z, Jackson A, Linnerud AC, Dawson G. Prediction of body density in young and middle-aged men. J Appl Physiol. 1976; 40: 300-4.
![Fig. 5 – Dispersion diagram between values measured and predicted by the proposed equation (a) and predicted by equation 1F (b) for the female group (n = 45, regression [____], identity line [.......]).](https://thumb-eu.123doks.com/thumbv2/123dok_br/15444114.599780/8.892.102.769.128.420/dispersion-measured-predicted-proposed-equation-predicted-equation-regression.webp)
