M a i l i n g A d d r e s s : R o s e l i S a c c a r d o S a r n i • R u a R e n ê Z a m l u t t i , 9 4 / 5 2 – 0 4 1 1 6 - 2 6 0 – S ã o P a u l o , S P - B r a z i l
E-mail: [email protected] Received on 09/17/03 • Accepted on 06/08/05
Relationship Between Waist Circumference and
Nutritional Status, Lipid Profile and Blood Pressure in Low
Socioeconomic Level Pre-School Children
Roseli Saccardo Sarni, Fabíola Isabel Suano de Souza, Denise de Oliveira Schoeps, Priscila Catherino, Maria Carolina Cozzi Pires de Oliveira, Cristiane Félix Ximenes Pessotti, Cristiane Kochi, Fernando Antonio Basile Colugnati
Faculdade de Medicina do ABC e UNIFESP-EPM - São Paulo, SP - Brazil
O
BJECTIVETo evaluate anthropometric data, blood lipid levels, blood pressure (BP) and waist circumference (WC) in preschool children. To relate WC with blood lipid levels and BP in obese and non-obese children.
M
ETHODSIn a transversal study we investigated 65 preschool children of low socioeconomic level in Santo André, São Paulo. The evaluation consisted of BP measurement (Task Force, 1996), weight (W), height (H) expressed as z score (WHO,1995) and body mass index (BMI), triglycerides, total and fractions of cholesterol blood levels (Kwiterovich and AHA). Statistical analysis: Fisher test and correlations.
R
ESULTSWe observed high BP and lipid levels unrelated to nutritional status. WC was signifi cantly and positively correlated to BMI and ZWH (r = 0,87 and r = 0,83, respectively).Using as a cut-off 75 percentile of WC we found an accuracy of 89,1% with 87,2% specifi city and 70,6% sensitivity and predictive value (+) 66,7% and (-) 66,7%. There was no relationship between WC and lipid and BP levels.
C
ONCLUSIONSWC showed direct correlation with anthropometric indexes commonly used and in preschool children wasn’t predictor of cardiovascular risk.
K
EY WORDSObesity has been clearly identifi ed in literature as a critical risk factor for the development of cardiovascular diseases (CVD). However, other factors are known to play a part in that risk, whether the individual is obese or not. Among those factors, waist circumference stands out. It has been widely investigated in adults as part of the metabolic syndrome1 and more recently identifi ed as a risk factor in the pediatric age range2,3,4.
Visceral fat increase is considered one of the most relevant risk factors for CVD, diabetes and other metabolic conditions5. Different methods used to study visceral fat are currently in use – one of the simplest, and easy to use and to reproduce is waist circumference5,6.
In a study carried out with severely obese children – mean age 10.15±2.01 years – abdominal fat index (sum of skinfolds as related to limbs) proved to be positively correlated to total cholesterol (TC) triglycerides (TG), LDL-c, and negatively to HDL-c. Marelli et al7 have found signifi cant correlation between waist-hip ratio and TG level. Those results confi rm that even in childhood severe obesity is related to lipid changes, and that abdominal adiposity is associated to profi le worsening7,8.
Results from the Bogalusa Heart Study have also emphasized the relevance of body fat distribution, especially waist circumference. According to the authors, that measure may help identify lipid and serum insulin changes. Children with waist circumference in the 90 percentile reported mean values above those in the 10 percentile for LDL-c, and TG, and lower for HDL-c. Those differences – highly signifi cant – showed not to be related to body weight or height for boys or girls, in all ethnic groups9.
Having in mind the already confi rmed relevance of waist circumference in adults metabolic syndrome, as well as the perspectives of international literature pointing towards an association of that measure in childhood with morbid-mortality in adult age, we have decided to conduct the present study that focuses the following objectives: to assess nutritional diagnosis, lipid profi le, blood pressure levels, and waist circumference in a sample of pre-schoolers in Santo André, São Paulo, S.P., Brazil. The purpose was to investigate whether waist circumference is associated to other usual anthropometric measures involved in obesity diagnosis, such as blood pressure and lipid profi le in the population under study.
M
ETHODSSample population was made up of 65 low socioeco-nomic level pre-schoolers, screened from a total of 297 children enrolled at the Municipal School in Santo André, São Paulo, Brazil (age range – from 4 years old to 6 years old and 11 months). School visit took place on 5 consecutive days (April, 2001) by researchers. Out of the total number, 84.2% (250/297) of pre-schoolers were evaluated. The protocol was approved by the Ethics
Committee at the ABC Medical School.
Based on mean and standard deviation waist circum-ference measures in the obese (62.5cm – 5.01) and non-obese group (52.4cm – 3.9), the sample reporting 18 and 45 showed > 90% power for the 0.05 (5%) significance level. The sampsi procedure was used (software STATA 8.0).
The study only included children whose parents or guardians signed the written consent. Children with the following conditions were excluded from the study: chronic conditions (nephropathy, cardiopathy, endocrinopathy, collagenosis, neuropathies, and hepatopathies); genetic syndromes, immunodefi ciencies, or those under systemic corticotherapy or current morbid condition.
Comparative analysis of the anthropometric assessment of the obese children included and not included in the study did not show statistically signifi cant difference. BMI mean and SD was 20.76 kg/m2 (1.92) and 19.96 kg/m2 (2.05), for those included and not included, respectively (Student t-test, p=0.28).
Children were weighted on platform scales (capacity 150 kg, 100 g gradation), on a fl at surface, with scale reviewed before every weighing procedure. Height was obtained from a stadiometer, with the T-square adjusted to scalp, in a straight angle with stadiometer, following Jellife recommendations10.
Based on weight and height data, weight indices were calculated for weight according to height (ZWH), height according to age (ZHA), and weight according to age (ZWA), all expressed in z score, and body mass index (BMI). Obese or undernourished children were those reporting 2 SD above or below reference pattern in relation to ZWH11, respectively.
Waist circumference was obtained through extensible measure tape with millimeter gradation by one examiner only, as recommended by MacCarthy HD et al, 200112. Blood pressure (BP) was obtained through one single
measure, by one examiner only, and values obtained were
classifi ed individually according to reference pattern for gender, age, and height percentile13.
Blood was collected (5 mL) through peripheral venopuncture after at least 12-hour fasting for TC, HDL-c, LDL-c, VLDL-c and TG (enzyme method)14. As reference for TC, LDL-c, HDL-c and TG, Kwiterowich15 pattern was used. For VLDL-c, the classifi cation proposed by the
American Heart Association16 was used.
study (percentiles 25, 50 and 75).Rejection level for null hypothesis was fi xed at 0.05 or 5%.
R
ESULTSOut of the 65 pre-schoolers under study, 53.8% (35/65) were males. Median age was 5.8 years. Obese children: 27.7% (18/65).
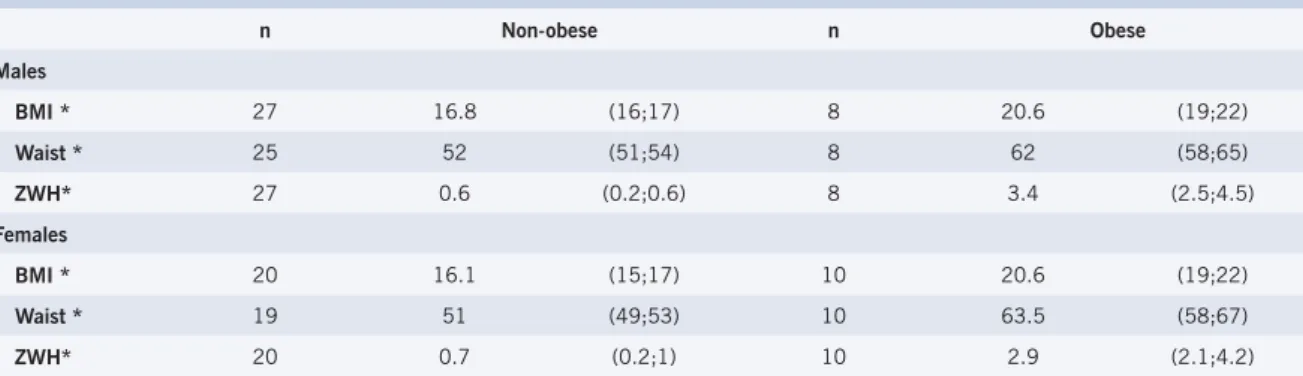
Table 2 shows medians and interquartile intervals for waist circumference, ZWH and BMI, among obese and non-obese. Statistically signifi cant difference was found for all variables in the two groups.
BMI and ZWH were compared to waist through linear correlation (Table 3). It should be pointed out that the waist keeps statistically signifi cant correlation with the two variables, both for the population in general as when genders are considered. Such result is also found in fi gure 1, as indicated by dispersion and by rvalues (linear correlation coeffi cient). No signifi cant difference was found for that tendency between males and females (p=0.23 for BMI and p=0.30 for ZWH). The obese are seen to be concentrated in the upper corner in the fi gures. The groups are visually well discriminated.
Using percentile 75 as the cutt-off point for WC for the population under study (58.2cm), and ZWH as the pattern, accuracy reported is 89.1%, matching values for specifi city, sensitivity, and positive and negative predictive
values (Table 4).
No statistically significant correlation was found between WC and BP (SBP – systolic blood pressure and DBP – diastolic blood pressure) or lipid profi le in the population under study. (Table 5). When WC was compared (characterized as quartiles: First quartile 45¬51; Second quartile 51¬53; Third quartile 53¬58; and Fourth quartile 58¬70) to BP and lipid profi le – both for the population as a whole as for obese and non-obese – no statistically signifi cant different was found either.
D
ISCUSSIONMetabolic syndrome or X-syndrome is defi ned as a set of risk factors for CVD, including: hyperinsulinemia/ insulin resistance, hypertension, dyslipidemia, obesity and glucose intolerance17. The association of that syndrome to CVD has been documented by epidemiological studies in children and adults18,19.
In our study, the prevalence of high BP level, the increase in TG, TC, LDL-c and VLDL-c, and low levels of HDL-c showed to be higher than that found in other papers carried out in Brazil, as the one with schoolers in Porto Alegre20, thus placing the population in our study – low socioeconomic level pre-schoolers—under high cardiovascular risk (Table 1).
The present study reported the correlation between waist circumference and BMI and ZWH, with straight correlation between those patterns while identifying adiposity level in pre-schoolers. (Figure 1, Table 2 and 3). A recent study carried out with 87 American children in the 4-11 age range, showed that waist circumference and fat percentage are extremely relevant factors for CVD. The present work defi ned values between 33% and 71 cm as the cut-off points for high risk of CVD: fat percentage (determined by dual X-ray absorptiometry – DXA) and waist circumference, respectively3.
Another cross-sectional, more recent study was carried out with 1,254 children in the 6-12 year-old age range, correlating anthropometric measures (waist included) and serum lipids and BP. The work showed Table 1 – Inadequacy percentage among obese
(n=18) and non-obese (n=47), in regard to SBP, DBP, TC, LDL-c, HDL-c, VLDL-c and TG
Non-obese Obese p
SBP 13% 22% 0.44
DBP 14% 38% 0.11
TC 14% 27% 0.16
LDL-c 22% 27% 0.74
HDL-c 11% 20% 0.71
VLDL-c 18% 27% 0.48
TG 22% 23% 0.71
Fisher exact test; SBP - systolic blood pressure; DBP - diastolic blood pressure; TC - total cholesterol; TG - triglycerides.
Table 2 – Median and interquartile interval (p25; p75) of BMI (Kg/m2), ZWH and waist diameter (cm),
among obese and non-obese, by gender
n Non-obese n Obese
Males
BMI * 27 16.8 (16;17) 8 20.6 (19;22)
Waist * 25 52 (51;54) 8 62 (58;65)
ZWH* 27 0.6 (0.2;0.6) 8 3.4 (2.5;4.5)
Females
BMI * 20 16.1 (15;17) 10 20.6 (19;22)
Waist * 19 51 (49;53) 10 63.5 (58;67)
ZWH* 20 0.7 (0.2;1) 10 2.9 (2.1;4.2)
strong waist correlation between increased SP and DP – stronger than that between body weight and tricipital and subscapular skinfolds. Through a multivariate linear analysis model we were able to also show that changes in SBP, DBP and HDL-c were signifi cantly associated to waist circumference, thus pointing out its relevance: an easy to do and to put into practice measure, with good reproductibility4.
The results found in the present study are evidence that waist circumference is discriminating in the diagnosis for obesity. However, due to sample size, the quantifi cation of such power in diagnosis – as sensitivity and specifi city – must be interpreted with caution.
It is interesting to point out the similarity in the behavior of waist circumference between boys and girls (Table 2), which differs from adult individuals but do match results from studies with other children in similar age range as the one in our study3.
Age range effect should be investigated. The present study did not carry out that investigation due to sample size constraints. A British study carried out with 8,355 children – both boys and girls – where waist circumference was stratified in percentiles - showed that waist circumference average increases with age: for girls, the curve reaches a plateau before they are 13, whereas for boys, it goes on increasing quite strongly after 13. The authors point out the fact that such fi ndings are related to Caucasian children characteristics, and encourage
Table 3 – Coeffi cients of linear correlation for BMI, ZWH and Waist circumference
BMI r p
Female 0.87 <0.001
Male 0.87 <0.001
General 0.87 <0.001
ZWH r p
Female 0.82 <0.001
Male 0.85 <0.001
General 0.83 <0.001
BMI - body mass index; ZWH - weight-height index.
Table 4 – Study on the power in diagnosis for waist circumference (cut-off point at percentile 75 for
population under study), with ZWH as pattern
Pattern = ZWH
Waist Obese Non-obese Total
>p75 12 6 18
<p75 5 41 46
Total 17 47 64
Sensitivity 70.6%; specifi city 87.2%; predictive value (+) 66.7%; predictive value (-) 66.7%; accuracy 89.1%; ZWH - weight-height index.
comparison with children from other countries12.
Obesity and abdominal fat distribution are associated to HDL-c reduction and TG increase, as shown by many studies with adults and teenagers21,22,23. Visceral fat is associated to the increase of circulating free fatty acids, hyperinsulinemia, insulin resistance, and increase of TG synthesis and VLDL-c secretion by the liver. In the light of all this, the defi nition of a cut-off point for waist circumference in children has been extensively investigated in the literature, since it has proven to be a better risk predictor for cardiovascular diseases than BMI24,25.
The present study has not reported correlation between waist measure and blood pressure levels or lipid profi le (Table 5) - either for all children or when assessment is restrained to nutritional condition (obese and non-obese). That may have been due to age range and sample size constraints. NHANES III – a study carried out with 5,056 American children in the 4-11-year-old range - identifi ed a positive, non-dependent relationship between waist-hip ratio and triglycerides level in pre-puberty children26.
In regard to BP, some studies have demonstrated a negative correlation between DBP and sensitivity to insulin, and a positive correlation with insulin levels, with no correlation, however, to adiposity in pre-puberty children27,28.
A defi nition of local patterns for central adiposity measures is, therefore, to be encouraged for pediatric
Fig. 1 – Dispersion between BMI x Waist and ZWH x Waist, in regard to nutritional status. 70,00 65,00 60,00 55,00 50,00 45,00 Cintura (cm) 6,00 4,00 2,00 0,00 -2,00 ZPE 70,00 65,00 60,00 55,00 50,00 45,00 Cintura (cm) 26,00 24,00 22,00 20,00 18,00 16,00 14,00 12,00 IMC (kg/m²)
= Non-obese and = Obese
Waist (cm) Waist (cm)
ZWH BMI (kg/m 2) 6.00 4.00 2.00 0.00 -2.00
45.00 50.00 55.00 60.00 65.00 70.00 45.00 50.00 55.00 60.00 65.00 70.00
Table 5 – Correlations between waist circumference and blood lipids and blood pressure
SBP DBP TOTCL LDL VLDL HDL TG
SBP 1.00
DBP 0.27 1.00
TOTCL 0.14 0.36 1.00
LDL 0.07 0.24 0.96 1.00
VLDL 0.37 -0.05 0.58 0.49 1.00
HDL 0.03 0.68 0.66 0.49 0.11 1.00
TG 0.30 -0.10 0.43 0.38 0.91 -0.07 1.00
Waist 0.15 -0.11 -0.01 -0.09 0.09 0.13 0.11
SBP - systolic blood pressure; DBP - diastolic blood pressure; TOTCL - total cholesterol; TG - triglycerides.
age range. Although not conclusive at this point, studies as ours do encourage the investigation of this new measure (waist) while searching for cut-off points and reference distributions as a help tool in the diagnosis of obesity in childhood and in setting parameters for cardiovascular risk.
Potencial Confl ict of Interest
No potential confl ict of interest relevant to this article was reported.
R
EFERENCES1. Donauhe RP, Abbott RD, Bloom E, Reed DM, Yano K. Central obesity and coronary heart disease in men. Lancet. 1987; 332 (1): 821-4.
2. Daniels SR, Morrison JA, Sprecher DL, Khoury P, Kimball TR. Association of body fat distribution and cardiovascular risk factors in children and adolescents. Circulation. 1999; 99: 541-5.
3. Higgins PB, Gower BA, Hunter GR, Goran MI. Defi ning health-related obesity in prepubertal children. Obesity Res. 2001; 9 (4): 233-40.
4. Sjarif DR, Meilany TA, Hendarto A, Nasar SS, Sudbijo S. Waist circumference and “metabolic syndrome” in obese children. J Inherit Metab Dis. 2002; 25 (1): 175-83.
5. Goran MI, Ball GDC, Cruz ML. Obesity and risk of type 2 diabetes and cardiovascular disease in children and adolescents. J Clin Endocrinol Metab. 2003; 88 (4): 1417-27.
6. Blackett PR, Kittredge D. Hyperlipidemia in children. South Med J. 1993; 86 (10): 1083-92.
7. Marelli G, Andreotti M, Liuzza R, Dalzano M, La Placa G. Relation of body fat distribution to blood lipid pattern in severe childhood obesity. Int J Obes Relat Metab Disord. 1993; 17 (suppl 2): 38-45.
8. Rolland-Cachera MF, Deheeger M. Correlations between anthropometric indicators of abdominal fat and fatness indices in children. Int J Obes Relat Metab Disord. 1998; 22 (suppl 4): 11-9.
9. Freedman DS, Serdula MK, Srinivasan SR, Berenson G. Relation of circumferences and skinfold thickness to lipid and insulin concentrations in children: The Bogalusa Heart Study. Am J Clin Nutr. 1999; 69: 308-15.
10. Jelliffe DB. Evaluacion del estado de nutricion de la comunidad. Organización mundial de la Salud – OMS, 1968.
11. World Health Organization. Physical Status: The use and interpretation of anthropometry. WHO Technical Report Series 854, Geneva, 1995, 452.
12. MacCarthy HD, Jarret KV, Crawley HF. The development of waist circumference percentiles in British children aged 5.0-16.9y. Eur J Clin Nutr. 2001; 55: 902-7.
13. National Heart, Lung and Blood Institute. Update on the Task Force (1987) on High Blood Pressure in children and adolescents. Pediatrics 1996; 98: 649-58.
14. Allain CC, Poon LS, Chan CSG, Richmond W, Fu PC. Enzymatic determination of total serum cholesterol. Clin Chem. 1974; 20 (4): 470-5.
15. Kwitterovich PO. Biochemical, clinical, epidemiologic, genetic, and pathologic data in pediatric age group relevant to the cholesterol hypothesis. Pediatrics. 1986; 78: 349-61.
16. American Heart Association. National Heart, Lung and Blood Institute. National Cholesterol Education Program Expert: Panel on blood cholesterol levels in children and adolescents. U.S. Department of Health and Human Services, 1991.
17. Haffner SM, Valdez RA, Hazuda HP. Prospective analysis of the insulin-resistance syndrome (syndrome X). Diabetes. 1992; 41: 715-22.
18. Chen W, Srinivasan SR, Elkasabany A, Berenson GS. Cardiovascular risk factors clustering features of insulin resistance syndrome (syndrome X) in a biracial (black-white) population of children, adolescents, and young adults. The Bogalusa Heart Study. Am J Epidemiol. 1999; 150 (7): 667-74.
19. Schmidt MI, Watso RL, Duncan BB. Clustering of dyslipidemia, hiperuricemia, diabetes, hypertension and its association with fasting insulin and central and overall obesity in a general population. Atherosclerosis risk in communities study investigators. Metabolism. 1996; 45: 699-706.
20. Gerber ZRS, Zielinsky P. Fatores de risco de aterosclerose na infância. Um estudo epidemiológico. Arq Bras Cardiol. 1997; 69 (4): 231-6.
21. Gillum RF. Distribution of waist to hip ratio, other indices of body fat distribution and obesity and associations with HDL cholesterol in children and young adults aged 4-19 years; The Third National Health and Nutrition Examination Survey. Int J Obes. 1999; 23: 556-63.
22. Freedman DS, Srinivasan SR, Harsha DW, Webber LS, Berenson GS. Relation of body fat patterning to lipid and lipoproteins concentrations in children and adolescents: the Bogalusa Heart Study. Am J Clin Nutr. 1989; 50: 930-9.
23. Asayama K, Hayashibe H, Dobashi K, Uchia N, Kawada Y, Nakazawa S. Relationships between biochemical anthropometric indexes of overweight, adiposity, and body fat distribution in Japanese elementary school children. Int J Obes. 1995; 19: 253-9.
24. Savva SC, Tornaritis M, Savva ME, Kourides Y, Panagi A, Silikiotou N, et al. Waist circumference and waist-to–height ratio are better predictors of cardiovascular disease risk factors in children than body mass index. Int J Obes Relat Metab Disord. 2000; 24 (11): 1453-8.
26. Gillum RF. Indices of adipose tissue distribution, apolipoproteins B and AI, lipoprotein (a), and tryglicerides concentration in children aged 4-11 years: The Third National Health and Nutrition Examination Survey. J Clin Epidemiol. 2001, 54: 367-75.
27. Arslanian S, Suprasongsin C. Insulin sensivity, lipids, and body composition in childhood: is “Syndrome X” present ? J Clin Endocrinol
Metab. 1996; 81: 1058-62.