SEISMIC INVESTIGATION IN THE BERTIOGA COASTAL PLAIN, BRAZIL
Emilio Eduardo Moreira Barbosa
1, Renato Luiz Prado
1, Matheus Cafaro Arouca Sobreira
1,
Rodrigo Dias Sam˜oes
1and C´elia Regina de Gouveia Souza
2Recebido em 8 novembro, 2011 / Aceito em 29 maio, 2012 Received on November 8, 2011 / Accepted on May 29, 2012
ABSTRACT.This paper presents results of seismic data from shallow seismic reflection onshore acquisition in the coastal plain of Bertioga (S˜ao Paulo State, Brazil)
in order to support studies of its geological-geomorphological evolution. By using data from a CMP survey, we sought to analyze and interpret the record of three distinct events: reflected waves, refracted waves and surface waves. From the data processing, three sections were generated: stacked section of the reflected waves, tomographic section from the inversion of travel times of refracted P waves, and S-wave velocity section obtained from the inversion of dispersion curves of surface waves. The integration provided a detailed geological section with information about important contacts of quaternary units, surface of the basement rock and a geological structure that suggests a quaternary reactivation of an inferred fault.
Keywords: seismic methods, coastal plain of Bertioga, quaternary deposits.
RESUMO.Este trabalho apresenta resultados da interpretac¸˜ao de dados obtidos em uma aquisic¸˜ao de s´ısmica de reflex˜ao rasaonshore na plan´ıcie costeira de
Bertioga (S˜ao Paulo) visando subsidiar estudos da sua evoluc¸˜ao geol´ogica-geomorfol´ogica. Utilizando-se dos dados de um ´unico levantamento CMP, buscou-se analisar e interpretar o registro de trˆes eventos distintos: ondas refletidas, ondas refratadas e ondas de superf´ıcie. Do processamento dos dados foram geradas: sec¸˜ao empilhada das ondas refletidas, sec¸˜ao tomogr´afica da invers˜ao dos tempos de percurso das ondas P refratadas e sec¸˜ao de velocidades das ondas S, obtida a partir da invers˜ao das curvas de dispers˜ao das ondas de superf´ıcie. A integrac¸˜ao forneceu uma sec¸˜ao geol´ogica detalhada com informac¸˜oes de contatos importantes entre unidades quatern´arias, superf´ıcie do embasamento rochoso, e estrutura que sugere reativac¸˜ao quatern´aria de falha inferida.
Palavras-chave: m´etodos s´ısmicos, plan´ıcie costeira de Bertioga, dep´ositos sedimentares quatern´arios.
1Instituto de Astronomia, Geof´ısica e Ciˆencias Atmosf´ericas, Universidade de S˜ao Paulo, Rua do Mat˜ao, 1226, 05508-090 Cidade Universit´aria, S˜ao Paulo, SP, Brazil. Phone: +55 (11) 3091-2762; Fax: +55 (11) 3091-5034 – E-mails: emilio facu@hotmail.com; renato@iag.usp.br; matheuscaf@hotmail.com;
rodrigo.samoes@gmail.com
2Instituto Geol´ogico do Estado de S˜ao Paulo, Avenida Miguel St´efano, 3900, 04301-903 ´Agua Funda, S˜ao Paulo, SP, Brazil. Mailbox: 8772. Phone: +55 (11) 5073-5511; Extension: 2050; Fax: +55 (11) 5073-5511 – E-mail: celia@igeologico.sp.gov.br
INTRODUCTION
The coastal plains of the S˜ao Paulo State have been the target of many geoscientific studies (Suguio & Martin, 1976, 1978; Gian-nini, 1987; Suguio & Tessler, 1992; Souza, 2007), as they present important data about the geological-geomorphological evolution of the Quaternary of Brazil. These studies have also been used as basis for land management policies and the management of natural resources as these areas have been suffering continuous degradation.
However, reports of direct investigations of the subsurface, as well as of shallow seismic investigations focused on the inter-pretation of quaternary evolution of the S˜ao Paulo coastal plains are rare. A few papers can be mentioned presenting offshore shallow seismic studies, such as: Tessler & Souza (1998), Mahiques & Souza (1999), Paolo & Mahiques (2008).
The coastal plain of Bertioga is of particular importance for the geological study, as it comprises all types of deposits present in the S˜ao Paulo coast (Souza, 2007; Souza et al., 2008), aside from bringing data of the quaternary tectonic activity during its geomorphological development (Souza & Souza, 2001), as it seems to have happened in other locations of the Southeastern coast of Brazil (Suguio, 2010).
The relevance of this paper is associated to the scarcity of reports of onshore reflection seismic investigation in quaternary environments of the Brazilian coastal plain, in the same scale of the shallow investigation presented in this paper. Furthermore, the objective here was to analyze and interpret three distinct events using data from a single CMP survey (common midpoint): re-flected waves, refracted waves and surface waves.
The processing of the data provided: stacked section of re-flected waves; tomographic section from the inversion of travel-times of refracted P waves, and S-wave velocity section, obtained from the inversion of the dispersion curves of the surface waves. The integration of the results obtained in each analysis pro-vided an interpreted section of a transect perpendicular to the coastline.
GEOLOGICAL BACKGROUND
The Bertioga coastal plain is located in the central coast of the S˜ao Paulo State, over an extension of 45 km with a maximum width of approximately 8 km (Suguio & Martin, 1978). It is lim-ited by the mouth of the Bertioga Channel (to the west), the estuary of the Itapanha´u river and the borders of the Atlantic Plateau or the Serra do Mar mountain range (to the North), the Atlantic Ocean (to the South) and the area adjacent to the coastal plain of the district of S˜ao Sebasti˜ao (to the East) (Fig. 1).
In the Bertioga region the crystalline basement of the Serra do Mar mountain range and the isolated hills in the coastal plains are made up of gneiss, migmatites and oftalmites of the Brasiliano Cycle, therefore of Precambrian age (Fierz, 2008). Basic dykes, generated during the Wealdeniana Reactivation (Mesozoic) are also present, mainly observed in the crystalline costal cliffs.
Souza (2007) mapped the sedimentary environments of the coastline, the coastal plain and the low-to-medium hills of Bertioga, calling them Quaternary Geomorphological-Geological Units (QU) (Fig. 1). This classification used the classic methods of geological mapping of quaternary units defining the units through the principle of homogeneous zone.
Figure 1 also identify the locations I and II (LI and LII) where the seismic walkaway noise tests were carried out. LI is located in the Cx-LPTa/LCD unit, a complex made up of Pleistocene raised marine terraces associated to palaeo-estuarine-lagoonal depres-sions (lagoonal and estuarine sediments) that were active, at least, during the Holocene (Santos Transgressive-Regressive event) and filled with continental deposits after the marine regression (fluvial, lacustrine and paludal sediments) from Holocene to present. LII is located in the LCD unit, made up of palaeo-estuarine-lagoonal depressions (lagoonal and estuarine sediments) active, at least, during the Holocene (Santos Transgressive-Regressive event) and filled with continental deposits after the marine regression (flu-vial, lacustrine and paludal sediments) from the more recent Holocene to the present.
METHODOLOGY Walkaway Noise Tests
The walkaway noise tests were carried out in sites of easy access, low level of urban noise, and where the seismic line could be extended for more than 1 km. Moreover, they represented sites of geological relevance for the study, since the geological map of Souza (2007) (Fig. 1) indicates, in both areas, occurrence of sedimentary deposits from the Pleistocene and Holocene (Cx-LPTa/LCD and LCD). One of the goals of the seismic investiga-tion was to map these contacts in the subsurface.
In the walkaway noise tests two types of sources were tested: an impact source using a 8 kg sledge hammer; and a repetitive source using a vibrator soil compactor, making use of the
Mini-Sosie technique (Barbier et al., 1976). Geophones with
natural-frequency of 40 Hz were used, with a spacing of 1 m, with a mini-mum offset of 1 m, and 4 Geode seismographs (Geometrics Inc.), linked in a network, adding up to 96 acquisition channels.
Fi gu re 1 – M ap co nt ain in g th eq ua ter na ry un its of th ec oa sta lp lai n an d lo ca tio n of th eL Ia nd LI Ia re as of th es eis m ic su rv ey s. Ge og ra ph ica lC oo rd in ate s: LI 23 ◦45 012 00S /4 5 ◦55 060 00W an d 23 ◦43 008 00S /4 5 ◦55 007 00W ;L II 23 ◦45 049 00S /4 5 ◦57 063 00W an d 23 ◦44 080 00S /4 5 ◦57 006 00W (m od ifi ed fro m So uz a, 20 07 ).
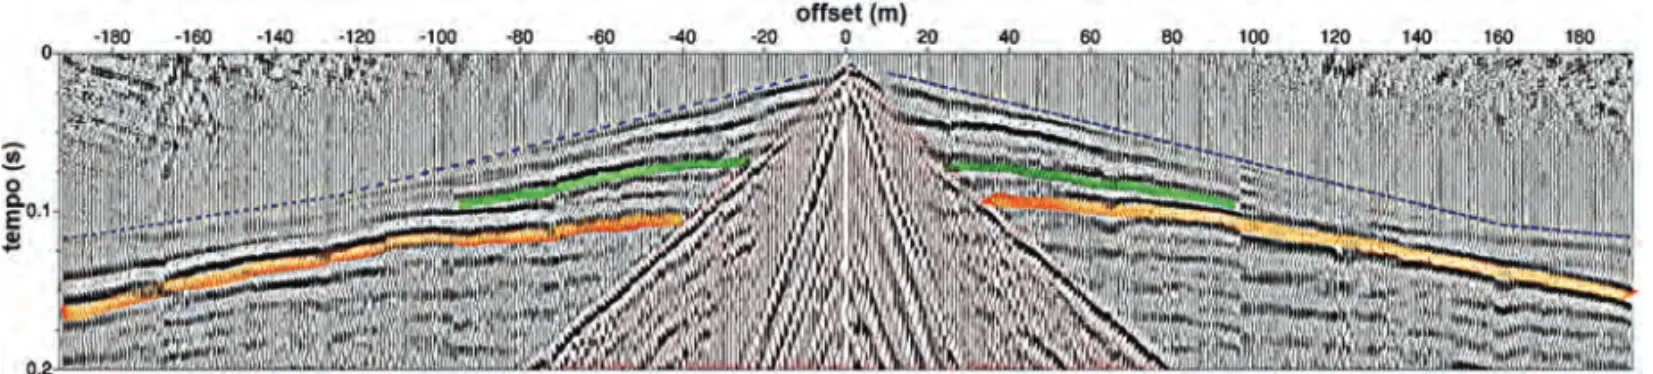
Figure 2 – Seismograms of the walkaway noise tests at location LII. The blue dashed line corresponds to the refraction event, the red area, to the surface waves.
The reflection event in green is a sediment-sediment contact, and, in orange, the sediment-basement contact. 40 Hz geophones with 1 m spacing were used.
Figure 3 – Illustration of the acquisition geometry adopted. The first shot (T1) was fired two meters away from the first geophone (G1), having been moved in
intervals of eight meters towards the center of the spread. After the completion of 12 shots, the first 48 geophones were moved to the end of the spread and the source once again to two meters from the first geophone.
In the two areas where the walkaway noise tests were per-formed two records were made, with the source being positioned to the right and to the left of the geophones array, both with a min-imum offset of 1 m. Both seismograms at site LII (to the right and to the left of the array) were joined, to facilitate the interpretation of the observed events (Fig. 2).
CMP acquisition and data processing
After the analysis of the noise tests, LII was chosen (Figs. 1, 2) for the CMP acquisition due to the better quality of the records ob-tained in this area. The sledge hammer source presented a better response compared to that obtained from the compactor, and was used in the CMP acquisition.
The geometry adopted in the CMP acquisition was based on the work of Diogo et al. (2004), moving half of the geophone spread (48) every sequence of 12 shots (Fig. 3). The shot se-quence was performed in the beach-escarpment direction (SE-NW). The first shot (T1) was fired two meters away from the first geophone (G1), and the following shots were fired every eight meters towards the center of the spread. After the completion of 12 shots, the first 48 geophones were moved to the end of the spread, and the acquisition continued with the same pattern. At the end a total of 180 shots were acquired, making up for a seismic
line of approximately 1.5 km and 12-fold coverage.
After acquisition of the CMP data, three distinct processing sequences were carried out, depending on the event being ana-lyzed: reflected, refracted and surface waves.
For the P-wave reflection data, the basic processing flowchart for the CMP acquisition was applied, using theSeismic Unix – SU software (Cohen & Stockwell Jr., 2010). This included: trace edition (conversion of the formats seg2→segy→su, setting acquisition geometry, mute filtering), amplitude balancing (Automatic Gain Control – AGC), band-pass frequency filter, F-K filter, CMP sorting, velocity analysis (constant velocity stacking panel and semblance panel), NMO correction, stacking, migra-tion, time-depth conversion.
The tomographic processing of the refraction data was per-formed with the Rayfractrsoftware, starting with the first arrival travel time picks of the P waves from all the same 180 shot seis-mograms used in the processing of reflection seismic data. The Rayfractrsoftware uses the WET inversion method –Wavepath
Eikonal Travel time (Schuster & Quintus-Bosz, 1993). The WET
inversion is based on a back projection algorithm for inverting velocities from travel times computed by finite-difference solution to the eikonal equation (Lecomte et al., 2000). The initial velocity-depth model is generated by the method Delta-t-V of Gebrande & Miller (1985apudRohdewald, 2011).
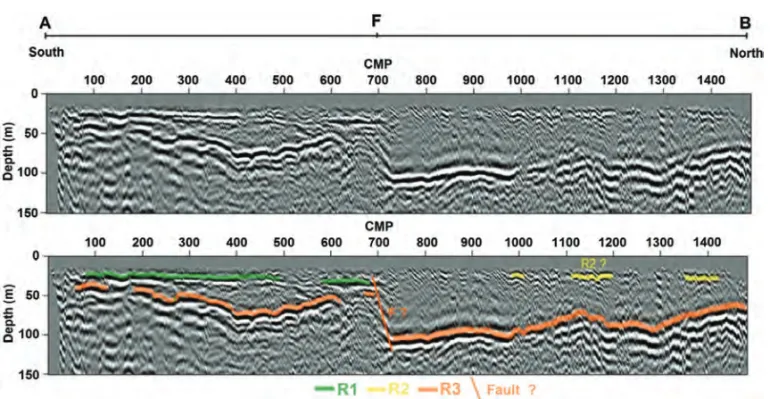
Figure 4 – Stacked section converted from time to depth after the use of an AGC gain, bandpass and mute filters, and the same interpreted section,
with the indication of the reflectors R1, R2 and R3 and the F fault inferred. The segment FB was affected by the reactivation of the fault.
Finally, for the processing of surface wave data (Rayleigh) using the MASW method (Multichannel Analysis of Surface
Waves) the Surfseisr software (Park et al., 1999) was used.
The processing consists in the transformation of the wave field recorded in the shot gather seismogram in order to obtain the image of the dispersion and extraction of experimental disper-sion curve. The disperdisper-sion image represents the sum of the am-plitude values in each offset (x) for each frequency being con-sidered. The sum is made after the application of a phase shift (ϕ) dependent on the offset, and repeated for each one of the phase-velocity values considered. After extracting the disper-sion curve, the inverdisper-sion processes (Xia et al., 1999) are used to infer a velocity profile of the shear waves (S) in the subsur-face, based on the dispersive behavior of the surface waves as they propagate in a vertically heterogeneous environment and in the existing relationship between the velocities of the Rayleigh waves and the S waves.
RESULTS AND DISCUSSION
The walkaway seismograms (Fig. 2) indicated the occurrence of two probable reflections that were later confirmed in almost all the CMP gathers, and resulted in the interfaces interpreted in the final stacked section. The refractions were also easily identified along the whole geophone spread (up to offsets close to 200 m), as well as the surface waves, always predominant in the seismograms of shallow investigations.
Figure 4 presents the depth stacked section obtained after processing the reflection data, and its interpretation. Figures 5 and 6 present, respectively, the sections obtained from the tomo-graphy of the refraction data and from the spectral analysis of the surface waves.
Figure 7 presents the interpreted section that integrates the information obtained from the three methods used.
It was possible to identify three interfaces in the stacked seis-mic section (seisseis-mic reflectors R1, R2 and R3). Seisseis-mic reflec-tor R3 is associated to the contact sediment-basement (confirmed through the refraction data in some shot gather seismograms) and the R2 is a contact between sedimentary packages. Seismic reflec-tor R2 is discontinuous and is only seen in some secreflec-tors of the section (segment FB of Fig. 4).
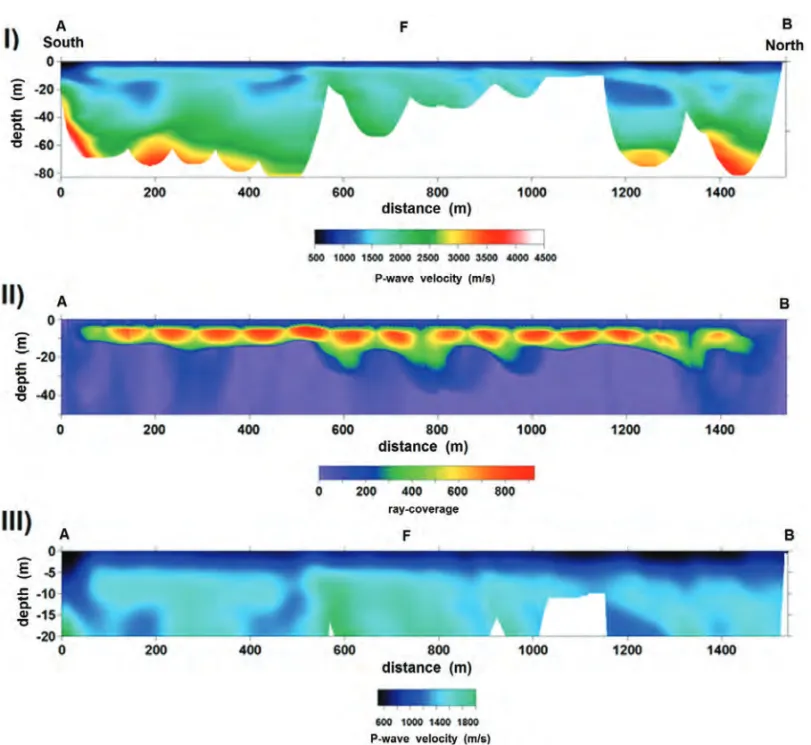
The subsurface images generated by the MASW and tomo-graphy methods of the refracted P waves permitted to map addi-tional interfaces other than those interpreted by the seismic reflec-tion method. The interfaces were inferred from seismic velocity contrasts in images shown in Figures 5 and 6.
The tomographic inversion shows, in some sectors of the tomogram the basement interface intervals of 0 to 400 m and 1200 to 1500 m, approximately (Fig. 5-I). However, refraction ar-rivals from the basement were only recorded in some shot gath-ers. The raypath density image resulted from the inversion pro-cess (Fig. 5-II) presents a low density of rays in depths greater than approximately 20 meters. For this reason, the interpretation of the refraction data was only considered up to this depth.
Figure 5 – P-wave velocities model obtained using the tomography of the refracted P waves travel times (I); Raypath coverage image (II); Detail of the
inversion (presented in I) up to 20 m of depth (III).
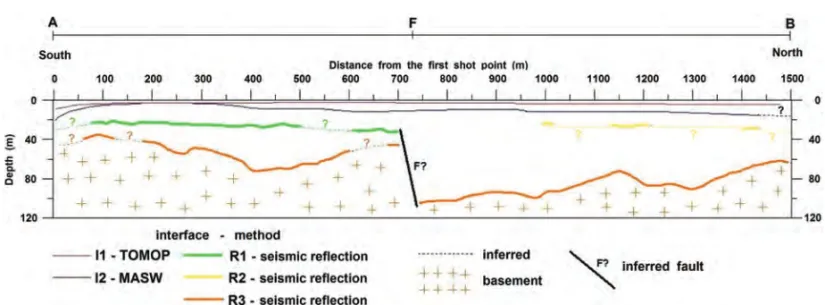
Figure 7 – Integrated section presenting the results obtained from the seismic reflection, tomography of the refracted P waves, and analysis of the surface waves
methods. The segment AF and the superficial sedimentary layers above the R1 and R2 were not affected by the fault.
The units mapped using the refraction tomography and MASW methods are, probably, associated to the more recent de-posits (fluvial, lacustrine and paludal), on average, having thick-ness lesser than 15 meters.
The analysis of the surface waves allowed differentiating one interface within these sediments, not mapped by the P-wave analysis (whether through the refraction or reflection method). This contact should limit sediments with distinct elastic prop-erties, but since it is below the water table it was only mapped through the analysis of the S waves velocity contrast.
In relation to the propagation velocities of the seismic waves, the joint analysis of the results obtained using the refraction and MASW methods for the superficial horizons, reveals a high Vp/Vs ratio which is mainly associated to the saturation of sediments, since the local water level is quite shallow. In these conditions the velocity of the S-wave is not greatly affected by the degree of saturation, as happens with the P-wave. The order of magnitude observed is consistent with those found in the literature for similar sediments. Stuempel et al. (1984), having compiled results from seismic tests of refraction, reflection and drilling holes obtained in saturated shallow sediments in the Northern Germany, report high values for the Vp/Vs ratio, even for those partially saturated, and extremely high values for clayey horizons.
Therefore, it is possible to observe that the tomographic sec-tion and the one obtained using the MASW method were efficient to map the shallower interfaces, whereas the analysis of reflected waves allowed for the mapping of deeper horizons.
CONCLUSIONS
The results showed that the integration of the three methods makes up for an important tool for mapping the shallow
sub-surface of onshore coastal areas. The integration of seismic re-flection, the MASW method and the refracted waves tomography method, using the same seismic data acquired in a standard CMP acquisition (originally used in seismic reflection method), pro-vides a more complete geological section, and important sub-sidies for the geological study.
The seismic reflection, alone, has proven to be an effective method to map the top of the crystalline basement (R3) and also the interfaces between distinct sedimentary units (R1). In this last case, it is admitted that such reflective surface indicates the exis-tence of sediments with significant differences in terms of com-paction, density and consequently acoustic impedances. It is pos-sible to infer from the geological map information that such con-tact (R1) may be the limit between the Holocene and the Pleis-tocene units.
The method also permitted to map an important geological structure, the normal fault observed at the center of the section, shown as a clear discontinuity of the R1 seismic reflector within the segment FB of the seismic section. The seismic reflection method did not present enough resolution to map shallower and recent sedimentary deposits.
However, the MASW and tomography methods, were effec-tive to map the shallower sedimentary deposits.
Therefore, the seismic reflection CMP record, even not be-ing the ideal data to be analyzed by the MASW and tomogra-phy methods, may be used in the interpretation of refracted and surface waves, as they present details of the shallower subsur-face, impossible to map through usual seismic reflection proce-dures. For this, in the initial walkaway tests, aiming at defining the geometry of CMP acquisition, one should have a closer look
at these other events, mainly to surface waves, usually considered undesirable noise in seismic reflection acquisitions.
ACKNOWLEDGEMENTS
The authors would like to express their appreciation to the Conselho Nacional de Desenvolvimento Cient´ıfico e Tecnol´ogico – CNPq (Project 477482/2009-0) and to the Fundac¸˜ao de Amparo `a Pesquisa do Estado de S˜ao Paulo – FAPESP (Project 2008/58549-0) for the financial support in carrying out this research.
REFERENCES
BARBIER MG, BONDON P, MELLINGER R & VIALLIX JR. 1976. Mini-Sosie for land seismology. Geophysical Prospecting, 24: 518–527. COHEN JK & STOCKWELL Jr JW. 2010. CWP/SU: Seismic Unix Re-lease No. 42: an open source software package for seismic research and processing. Center for Wave Phenomena, Colorado School of Mines. 135 pp.
DIOGO LA, LE DIAGON FMM & PRADO RL. 2004. Bedrock imaging using post-critical shallow seismic reflection data. Journal of Applied Geophysics, 57(1): 1–9.
FIERZ MS. 2008. As abordagens sistˆemicas e do equil´ıbrio dinˆami-co na an´alise da fragilidade ambiental do litoral do estado de S˜ao Paulo: contribuic¸˜ao `a geomorfologia das plan´ıcies costeiras. Doctorate Thesis, Faculdade de Filosofia, Letras e Ciˆencias Humanas, Universi-dade de S˜ao Paulo. 410 pp.
GIANNINI PCF. 1987. Sedimentac¸˜ao Quatern´aria na Plan´ıcie Costeira de Peru´ıbe-Itanha´em (SP). M.Sc. Dissertation, Instituto de Geociˆencias, Universidade de S˜ao Paulo. 234 pp.
LECOMTE I, GJØYSTDAL H, DAHLE A & PEDERSEN OC. 2000. Im-proving modelling and inversion in refraction seismics with a first-order Eikonal solver. Geophysical Prospecting, 48: 437–454.
MAHIQUES MM & SOUZA LAP. 1999. Shallow seismic reflectors and upper Quaternary sea level changes in the Ubatuba region, S˜ao Paulo State, Southeastern Brazil. Revista Brasileira de Oceanografia, 47(1): 1–10.
PAOLO FS & MAHIQUES MM. 2008. Utilizac¸˜ao de m´etodos ac´usticos em estudos de dinˆamica costeira: Exemplo na desembocadura lagunar de Canan´eia. Revista Brasileira de Geof´ısica, 26(2): 211–225. PARK CB, MILLER RD & XIA J. 1999. Multimodal analysis of high fre-quency surface wave. In: Proceedings of the Symposium on the Applica-tion of Geophysics to Engineering and Environmental Problems (SAGEEP 99), Oakland, CA, March 14-18, p. 115–122.
ROHDEWALD SR. 2011. Interpretation of first-arrival travel times with Wavepath Eikonal Traveltime Inversion and Wavefront Refraction method. In: EEGS Symposium on the Application of Geophysics to Engineering Environmental Problems, 24., 2011, Charleston. CD-ROM.
SCHUSTER GT & QUINTUS-BOSZ A. 1993. Wavepath Eikonal Traveltime Inversion: Theory. Geophysics, 58(9): 1314–1323.
SOUZA CRG. 2007. Ambientes sedimentares de plan´ıcie costeira e baixa-m´edia encosta em Bertioga (SP). In: Congresso da Associac¸˜ao Brasileira de Estudos do Quatern´ario, 11., 2007, Bel´em. Proceedings... S˜ao Paulo: ABEQUA. CD-ROM.
SOUZA CRG & SOUZA AP. 2001. Evidˆencias de atividade tectˆonica quatern´aria no litoral paulista. In: Congresso da Associac¸˜ao Brasileira de Estudos do Quatern´ario, 8., 2001, Imb´e (RS). Proceedings... S˜ao Paulo: ABEQUA. Boletim de Resumos, p. 302.
SOUZA CRG, HIRUMA ST, SALLUN AEM, RIBEIRO RR & AZEVEDO SOBRINHO JM. 2008. “Restinga”: Conceitos e Empregos do Termo no Brasil e Implicac¸˜oes na Legislac¸˜ao Ambiental. S˜ao Paulo (SP): Secretaria do Meio Ambiente, Instituto Geol´ogico, S˜ao Paulo. 104 pp.
STUEMPEL H, KAHLER S, MEISSNER R & MILKEREIT B. 1984. The use of seismic shear waves and compressional waves for lithological prob-lems of shallow sediments. Geophysical Prospecting, 32: 662–675. SUGUIO K. 2010. Geologia do Quatern´ario e mudanc¸as ambientais. Oficina de Textos. 408 pp.
SUGUIO K & MARTIN L. 1976. Mecanismos de gˆenese das plan´ıcies sedimentares quatern´arias do litoral do Estado de S˜ao Paulo. In: Con-gresso Brasileiro de Geologia, 29, 1976, Ouro Preto. Proceedings... Ouro Preto: SBG. p. 295–305.
SUGUIO K & MARTIN L. 1978. Quaternary formations of the state of S˜ao Paulo and Southern Rio de Janeiro. In: International Symposium on Coastal Evolution in the Quaternary, 1978, S˜ao Paulo. Special Publica-tion, 1, 55 pp.
SUGUIO K & TESSLER MG. 1992. Dep´ositos quatern´arios da plan´ıcie costeira de Canan´eia-Iguape (SP). Publicac¸˜ao Especial do Instituto Oceanogr´afico-USP, 9: 1–33.
TESSLER MG & SOUZA LAP. 1998. Dinˆamica sedimentar e feic¸˜oes sedimentares identificadas na superf´ıcie de fundo do sistema Canan´eia-Iguape, SP. Revista Brasileira de Oceanografia, 46(1): 69–83.
XIA J, MILLER RD & PARK CB. 1999. Estimation of near-surface shear-wave velocity by inversion of Rayleigh waves. Geophysics, 64(3): 691–700.
NOTES ABOUT THE AUTHORS
Emilio Eduardo Moreira Barbosa. Bachelor degree in Geophysics (IAG/USP, 2009), Master’s degree in Geophysics (IAG/USP, 2012). Geophysicist at Global
Servic¸os Geof´ısicos Ltda.
Renato Luiz Prado. Bachelor degree in Geophysics (IGc/USP, 1981), Master’s degree in Geophysics (IAG/USP, 1984) and Ph.D. in Geosciences and Environment
(IGCE/UNESP, 2000). Professor of the Geophysics Department at IAG, Universidade de S˜ao Paulo.
Matheus Cafaro Arouca Sobreira. Bachelor degree in Geophysics (IAG/USP, 2011). Geophysicist at Petr´oleo Brasileiro S.A. – Petrobras.
Rodrigo Dias Sam˜oes. Bachelor degree in Geophysics (IAG/USP, 2011).
C´elia Regina de Gouveia Souza. Bachelor degree in Geology (IGc/USP, 1983), Master’s degree in Geological Oceanography (IO/USP, 1990), Ph.D. in Sedimentary